Introduction
Measuring the complex permittivity (CP) of high loss liquids such as water or water-based liquids at microwaves is an efficient way to obtain information about the properties of liquids at the molecular level, since at microwaves a maximum frequency dispersion of water is observed [Reference Alekseev, Szabo and Ziskin1–Reference Ellison5]. The ratio of imaginary and real parts of the high loss liquid CP is about a unit. Such a property is characteristic of water or water solutions at microwaves. In some cases involving, for example, the production of drugs, or the identification of bioactive liquids under test, the working volume available for measurement is very small. The application of known waveguide or resonator methods [Reference Sato and Buchner6–Reference Afsar, Suwanvisan and Wang9] for CP measurements of high loss liquids in these conditions are not practically effective and meet certain difficulties. In this connection, a problem arises of creating an efficient method for measuring the microwave dielectric properties of high loss liquids in a small volume.
To detect small CP differences of various substances differential measurement methods are widely used along with the others. The necessity of the small CP difference registration for high loss liquids appears, for instance, in biological studies of conformation changes of native protein molecules [Reference Pethig10] or in the reference data preparation for the device calibration for water surface remote sensing [Reference Ellison5]. The dielectric properties of free water are well described by the Debye formula of the second order. The molecules dissolved in water can change the relaxation time due to both coupling some free water molecules (hydration) and rebuilding the hydrogen bonds in water clusters. The latter mechanism is common for water-ethanol mixtures [Reference Sato and Buchner6]. By the reasons mentioned, the CP measurement of water solutions is quite sensitive to the variation of their chemical composition in the Ka band. And also the measurement cell volume can be as small as needed.
The resonator methods use the resonant frequency and the Q-factor of a resonator to obtain the CP of a liquid. And the waveguide methods use the complex wave propagation factor in a waveguide segment under study. A significant limitation of the above-mentioned methods is a high attenuation observed in high loss liquids at microwave measurements. Moreover, high loss liquids have large real and imaginary CP parts, and these values are of the same order. Therefore, the measured parameters (the resonant frequency and Q-factor in a resonator or the electromagnetic wave phase and its attenuation in a waveguide) depend simultaneously on both the real and imaginary CP parts of high loss liquids. Owing to this fact, the CP determination becomes considerably complicated while using these measured parameters. In the resonator methods, the Q-factor is usually rather small (it is approximately 10–100 provided that the CP measurements are sensitive enough) and to determine the resonant frequency with needed accuracy is difficult. In the waveguide methods, the wave attenuation is high even at the wave propagation in a small waveguide section length (compared to the skin layer in high loss liquids).
There are lots of papers where the CP determination of high loss liquids was studied using different resonator methods. For example, in [Reference Barannik, Cherpak, Prokopenko, Filipov, Shaforost and Shipilova11, Reference Shaforost, Klein, Vitusevich, Barannik and Cherpak12] the whispering-gallery modes in cylindrically shaped dielectric resonators (DRs) were studied to obtain the CP of high loss liquids. A resonator like a radially layered dielectric cylinder placed between conducting endplates was studied [Reference Barannik, Cherpak, Prokopenko, Filipov, Shaforost and Shipilova11]. The internal layer was filled with air or a lossy liquid such as water, ethyl alcohol, benzene, and aqueous solutions of ethyl alcohol. In [Reference Shaforost, Klein, Vitusevich, Barannik and Cherpak12], a novel approach of high sensitivity liquid analysis was described for nanoliter volumes with prospects for practical sensor applications in chemistry, biology, and medicine. Whispering-gallery modes in cylindrically shaped dielectric disks made of low-loss single crystalline materials such as sapphire or quartz allow having very high quality factors. The interaction of extremely small liquid volumes with the evanescent field in the vicinity of the dielectric disk surface at micro-to-millimeter wave frequencies was employed for the investigation of aqueous solutions for biological applications. Based on this resonator type, three different liquid sensing approaches were developed and analyzed at 10, 35, and 170 GHz with the emphasis on the determination of the CP of liquids of nanoliter volumes. In [Reference Cherpak, Lavrinovich and Shaforost13], the electrodynamic properties of quasi-optical DRs of two types with liquid-filled small cavities were studied. One of the quasi-optical DRs is a two semi-disc resonator with a diametrical slot in which a cavity with a thin (0.01/0.1 mm) flat liquid layer is placed. The other one is a disc resonator with a small diameter (0.3/2 mm) cylindrical capillary. The measurements were carried out at the room temperature in Ka-waveband by using resonators made of Teflon material. The obtained results allow us to conclude that these approaches to the development of measuring techniques for the characterization of such liquids as water and aqueous solutions are quite promising. In [Reference Shaforost, Barannik and Klein14], they showed that whispering-gallery mode DRs from 10 GHz to 3 THz are attractive for the highly sensitive liquid detection and the identification of small droplets down to picolitre volumes. Since droplets are usually generated by computer controlled microinjection pipettes movable on a 2D scanning table, a free access to the sensitive resonator surface is essential.
The well-known waveguide-differential CP measurement methods are distinguished by the type of the measurement cell for different dielectric properties of liquids and measurement conditions. The measurement cells are based on waveguides completely filled with high loss liquid [Reference Buckmaster, Hansen and Zaghloul15]. Also waveguide cells are used with a liquid filled capillary put inside the waveguide [Reference Masaki, Atsuhiro, Kaori and Shunsuke7, Reference Meriakri and Parchomenko16]. In a set of Buckmaster's papers on the development and improvement of CP measurement techniques for light and heavy water at 9.335 GHz, a possibility is shown to reach a high accuracy of absolute measurements [Reference Buckmaster, Hansen and Zaghloul15, Reference Hu, Buckmaster and Baralas17]. The measurement setup in [Reference Hu, Buckmaster and Baralas17] was a microwave bridge having a waveguide cavity whose rectangular waveguide filled with water could precisely change its length. The thermos-stabilization for the cavity was as good as 0.005°С and a high sensitivity super-heterodyne receiver with double frequency transformation was employed. After this transformation, precise measurements were carried out at a frequency of 1 kHz. As a result, the relative measurement errors for the real and imaginary CP parts were of the order of 0.1 and 0.2%, respectively. The 1σ standard deviations for both real and imaginary CP parts did not exceed 0.02%. With its own metrological characteristics, the setup in [Reference Hu, Buckmaster and Baralas17] can be used for studying dielectric properties of wines and musts with needed accuracy.
We carried out microwave CP measurements in a small volume of a high loss liquid using a hemispherical cavity resonator with a central hemispherical hole filled with the liquid under test [Reference Eremenko and Ganapolskii18]. Earlier we had developed a dielectrometer for CP measurements of any high loss liquid using a layered circular waveguide [Reference Ganapolskii, Eremenko and Skresanov19–Reference Eremenko, Skresanov, Gerzhikova, Zhilyakova, Anikina, Shubnyi and Glamazdin22] with the possibility to use two kinds of measurement cells [Reference Eremenko, Kuznetsova, Shubnyi, Glamazdin and Natarov23].
As known, there are many separate publications on both waveguide methods and resonator methods to measure CP of high loss liquids. In the waveguide method the measured value is the complex wave propagation coefficient, and in the resonator method the measured value is the complex resonant frequency. Still there is no comparison of the measurement sensitivity for these techniques. Thus, our goal in this work is to carry out experimental measurements and compare the measurement sensitivity of the two techniques using a waveguide cell and a resonator cell to determine the dielectric properties of a small volume of water-ethanol solutions as a sample of a high loss liquid.
The differential waveguide measurement cavity
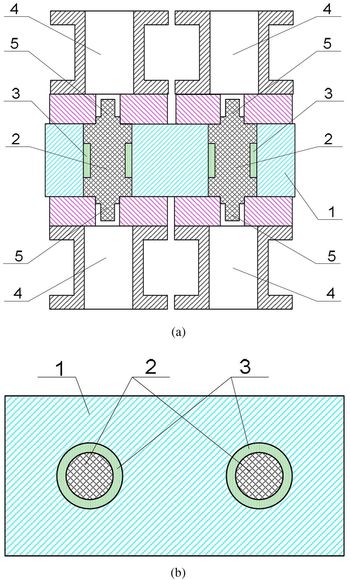
We have designed a measurement waveguide cavity (Figs 1 and 2) for our dielectrometer with the operating frequency 31.82 GHz [Reference Kirichenko and Kogut24]. The advantages of our dielectrometer are as follows: autonomy, small overall dimensions (compared to the laptop size), transportability, ease of operation, short measurement time (up to 5 min.), liquid volume as small as 7 ml. In addition, we can find an exact solution of the electrodynamic problem (the solution of the Maxwell's equations) because of the simple geometry of the cavity. A small volume of liquid does not change the temperature of the cavity. There is a simple technology for washing the cavity. The working wave is НЕ11 which has the lowest attenuation coefficient in a waveguide.
The longitudinal section of the cavity cell of the first modification (a), The cross-section of the measurement cavity (b). 1 is the differential cavity body; 2 is the dielectric rod; 3 is the high loss liquid; 4 is the rectangular waveguide of standard cross-section; 5 is the matching structure.

The photos of our dielectrometer (a), the measurement cavity (b), the view of these two measurement cells of different lengths (c), and dielectric Teflon rods (d).

The new measurement cavity consists of two cells in the form of cylindrical holes made in common body 1. In the center of each hole a dielectric Teflon rod 2 is placed. High loss liquid 3 fills the space between the inner surface of the holes and the outer surface of the rod. Narrow-band matching dielectric inserts 5 are needed to prevent liquid entering waveguides 4, as well as to reduce the reflection coefficient at the input and the output of the cells.
The electromagnetic field distributed in the cell fills the volume of the dielectric rod and partially penetrates into the tested liquid surrounding the rod. The positive features in comparison with our dielectrometer prototype [Reference Ganapolskii, Eremenko and Skresanov19–Reference Eremenko, Kuznetsova, Shubnyi, Glamazdin and Natarov23] are as follows: (1) the volume of the liquid under test required for the measurement is significantly reduced down to 2 ml; (2) the differential sensitivity of the device increases since the depth of field penetration into the liquid is comparable with the thickness of the liquid layer; (3) there is an exact solution to the problem of the electromagnetic waves propagation into a layered circular waveguide with a full consideration of its walls. The rigorous solution of the Maxwell's equations allows us to find CP values for the liquid under test using the measuring phase and attenuation data in the case of electromagnetic wave passage through the measured cavity.
The new design of the measuring cell is used in two versions. In the first modification, as in the dielectrometer prototype, two cavity cells of the same length are used (Fig. 1). Cells of different lengths are used in the cavity of the second modification (Fig. 3). The liquid under test fills both measurement cells unlike the previously used measurement cavity [Reference Kirichenko and Kogut24]. Now we do not need a reference liquid. This method allows measurements over a wide frequency range owing to waveguide junctions and for any microwave losses in liquids. The working wave is НЕ11, the measurement cell contains a central dielectric rod and a concentric layer with the analyzed liquid.
A longitudinal section of the differential cavity cells of the second modification with different length of two cells.

The difference in the attenuation coefficients and the difference in the phase incursions of the wave are measured at a length that is the difference between the lengths of the two cells. The electromagnetic wave diffraction at the ends of the cells has no effect on the CP values. Thus, there is no systematic measurement error that is associated with diffraction phenomena at the ends of the cell and exists in the prototype cells. Therefore, the measurement accuracy with the new cavity is expected to be much better than that of the prototype.
Our two measurement cells have different lengths L1 = 25 and L2 = 30 mm in the cavity shown in Fig. 3. We measure the differences in the wave amplitude and phase shift corresponding to the cell lengths. Thus, we have no systematic measurement error that is associated with the diffraction phenomena at the ends of each cell. The CP of absorbing liquids, as a rule, is strongly dependent on temperature. Therefore the precision measurements in the new-design dielectrometer were performed with the cell temperature control using the Thermoelectric Cooler-Heater.
Waveguide measurement and discussion
Measurement results presented in Fig. 4 were obtained using our dielectrometer [Reference Ganapolskii, Eremenko and Skresanov19–Reference Eremenko, Kuznetsova, Shubnyi, Glamazdin and Natarov23] with the cavity presented in Figs 1 and 2. In the experiment the real and imaginary part of CP of ethanol (96%) at 20 °C as ɛ’ + iɛ” = 4 + i2.22, distilled water with the CP of water at 20 °C as ɛ’ + iɛ” = 23 + i35 and water-ethanol solutions with a 10% step change ethanol concentration in water were studied.
Wave phase changes – pink curves (a,b) in the liquid sample and wave attenuation changes – blue curves (a, b) with respect to the water in the waveguide cell depending on the water-ethanol concentration C. Circles are for equal lengths of the two cells in the measurement cavity (see Fig. 1). Squares are for the cells with different lengths (see Fig. 3).

The dependences of wave phase changes (1) in the liquid sample in the waveguide cell and wave attenuation changes (2) on the water-ethanol concentration have almost an unambiguous character. It makes possible to have similar measurement sensitivity for the wave attenuation and phase change for the water-ethanol solution concentration from 0 to 90%. It needs to underline that the dependences of phase changes (1) and (3) and wave attenuation changes (2) and (4) coincide in the water-ethanol solution concentration measurement range. In the case of equal lengths of the two cells in the measurement cavity we obtain wave phase and attenuation changes using the effective length of each cell in the measurement cavity in order to get linear phase attenuation changes. In the case of different lengths of the two cells in the measurement cavity we obtain wave phase and attenuation changes using the length difference of two cells in the measurement cavity to get linear phase attenuation changes. Thus, two measurement techniques, namely, for equal lengths of the two cells in the measurement cavity and for the cells with different lengths in the measurement cavity have the same measurement results using different calculation algorithm. This fact can be verification for these two techniques at the same time.
The DR measurement cell
To determine the dielectric properties of water-ethanol solutions, we have also proposed to use a resonant measuring cell based on a high-Q semi-disk DR excited on the whispering gallery mode, which is characterized by a very low attenuation in a DR. The estimation of the dielectric properties of water-ethanol solutions depends on the measured changes in the spectral and energy characteristics of the DR, where a liquid under test is located. Initially it is assumed that the sample of the water-ethanol solution is located inside the resonator in the region of maximum values of the intensity (amplitude) of the resonant electromagnetic field of the whispering gallery modes.
The measuring cell for the samples of water-ethanol solutions is based on semi-disk DR 1 (Fig. 5) with a radius of 39.0 mm and a height of 7.2 mm, made of Teflon (permittivity is ɛ = 2.08 + i0.00036). It is located on flat copper mirror 2.
The experimental semi-disk resonator cell: 1 – a semi-disk dielectric resonator, 2 – a copper mirror, 3 – a Teflon capillary with the liquid under test, 4 – an open end of the metal waveguide.

The water-ethanol solutions were placed in thin Teflon capillary 3 with an inner diameter of 0.7 mm. The capillary was located in the region of the maximum intensity of the resonant field of the whispering gallery mode at a 3 mm distance from the dielectric semi-disk surface and was oriented parallel to its height. The angle between the location of the capillary in the DR and the copper mirror was 600. The excitation of the whispering gallery modes in the DR was carried out through a rectangular coupling slot in mirror 2. The excitation was formed by the open end of metal waveguide 4 of the size 7.2 × 0.1 mm2. It should be understood that, in addition to its main functions as the excitation element for whispering gallery modes in a semi-disk DR, the coupling slot is a scattering inhomogeneity. The diffraction losses of the resonant field at its edges lead to the resonator Q-factor decrease. They can reduce the accuracy of measurements. To remove this negative effect, the coupling slot was located in a region of the resonant field with a low intensity – at the edge of the dielectric semi -disk. The coupling slot was oriented in such a way that the hybrid ЕНmsl- whispering gallery modes were excited in the resonator (the wide side of the coupling slot was located along the disk height). The Indices m, s, l are the numbers of variations of the electromagnetic field along the azimuthal, axial, and radial coordinates, respectively. Thus, the vector of the electric field in the resonator was directed perpendicular to the capillary with the liquid.
The experimental study was carried out in the frequency band 31.0–37.5 GHz using a PNA-L Network Analyzer N5230a of 10 MHz ÷ 40 GHz Agilent Technologies. To clarify the distinguishing features of the studied water-ethanol solutions, the resonant frequencies and the Q-factors of the semi-disk DR modes were experimentally determined. The resonant frequency and unloaded Q-factor shifts can be used to determine the CP of the liquids under test using the small perturbation theory approach for such a resonator with liquid in the small capillary.
Resonator measurements and discussion
Earlier we have found that the spectrum of the considered semi-disk DR contains ЕНm 11- whispering gallery modes. It should be expected that the whispering gallery modes with different azimuthal index will have a different response to the disturbance of their resonant electromagnetic field because of the sample of water-ethanol solution. This is determined by the fact that they have a different field distribution along the azimuthal coordinate. It is known that if the sample of water-ethanol solution is located at the maximum of the field intensity of the whispering gallery modes along the azimuthal coordinate, we will have the greatest disturbance of the field. The experimental study of water-ethanol solutions were carried out at different values of the azimuthal indices of the whispering gallery modes which were determined by the probe method.
Along with the above-described scheme for studying liquids, an autodyne measurement scheme based on a resonator-type measuring cell (based on a half-disk DR with a capillary) was proposed and used. In such a circuit, the resonator performs two different functions at the same time. Firstly, it performs the function of stabilizing the frequency of a Ka-band waveguide-coaxial Gunn-diode oscillator. Generation is carried out in monochromatic mode at the eigen frequencies of the half-disk DR with operating whispering gallery modes (WGMs). Secondly, a half-disk DR is a measuring cell of an autodyne type dielectrometer. Thus, the identification of the studied liquids and the detection of their distinguishing features is carried out in accordance with the behavior of the characteristics of the oscillator stabilized by the half-disk DR. It should be expected that filling the capillary placed inside the resonator with various liquids will lead to a change in the frequency of the output signal of the oscillator. It is possible because the eigen frequencies of the half-disk DR, as shown above, are sensitive to the dielectric constant of the capillary filling. In addition, a change in the imaginary part of the dielectric permittivity of the medium filling the capillary will affect the behavior of the energy characteristics of the output signal. The compactness of such a dielectrometer cell, due to the lack of an external source of microwave energy is its obvious advantage.
In the experiment, the Ka-band Gunn-diode oscillator was included in the frequency stabilization circuit of the half-disk DR according to the “reflection” scheme. The waveguide-coaxial oscillator was located on the plane of the metal mirror on the opposite side of the dielectric half-disk. The coupling between the resonator and the oscillator was carried out by means of a rectangular slot with dimensions of 7.2 × 1.0 mm2 in the mirror. The coupling slot was oriented parallel to the generatrix of the dielectric half-disk. Its middle was in the region of the “strong” field of WGMs. In accordance with the concept of the distribution of the WGMs fields in the DR, the coupling slot was located under a flat section of the half-disk at a distance of 2 mm from its edge. This provided a strong electromagnetic coupling of the Gunn-diode oscillator with a stabilizing resonator and, therefore, a high efficiency of the excitation of the operating WGMs in the measuring cell of an autodyne dielectrometer. The signal is output from the resonator through the same coupling slot. Generation characteristics were measured using the Network Analyzer Rohde $ Schwarz FSMR43.
The following solvents were selected for research ethanol, kerosene, pure water, acetone, as well as its solutions in pure water (10 and 30%). When filling the capillary with various liquids, we studied the change δf of the generation frequency and attenuation coefficient A of the output signal relative to the air filling of the capillary (Fig. 6).
The behavior of the frequency and attenuation of the output signal at filling the capillary with pure water (1); aqueous solutions of acetone 10% (2) and 30% (3); acetone (4); ethanol (5); and kerosene (6).

It can be seen that the studied liquids act on the WGM fields as absorbers – with a frequency shift to the low-frequency region. Differences in the frequency changes and the signal attenuation coefficient make it possible not only to reveal the distinguishing features of liquids, but also to estimate a degree of their effect on the generation characteristics. So, the greatest attenuation of the generator output signal is observed when pure water is placed in the capillary, and the least – kerosene. It corresponds to the known values of the imaginary part of their dielectric constant, as well as other liquids. Decreasing the frequency of the output signal during the successive transition from kerosene to pure water is also in good agreement with existing knowledge of the real part of their dielectric constant.
Thus, the new design of the measuring cell of the Ka-band dielectrometer of autodyne type allows carrying out the identification a wide class of liquids, including those with a high loss tangent. The advantages of the proposed method for studying the dielectric properties of liquids include the high sensitivity of measurements with a small volume of liquid and compactness of the proposed device.
Figures 7 and 8 show the dependences of the resonant frequency shift δfm = fm0 – fml and the Q-factor shift δQ = Q0 – Ql with respect to the unloaded (empty) resonator of the whispering gallery modes with azimuthal indices m = 34; 35 and 36, respectively. The Q-factors of the resonator with an empty capillary are Q0 m=34 = 3822, Q0 m=35 = 2911, Q0 m=36 = 3891. Figures 7 and 8 show that the whispering gallery modes with azimuthal mode indices m = 34 and 36 have higher sensitivity than modes with m = 35 at a low water content in the water-ethanol solutions (ethanol concentration from 60 to 100%). This indicates that the sample of liquid is located in the region of electric field maxima of modes with m = 34 and 36.
The dependence of the resonant frequency change of the whispering gallery modes with different azimuthal indexes (m = 34 (curve 2); 35 (curve 3) and 36 (curve 1)) on the percentage C of the ethanol in the water solution.

The dependence of the unloaded Q-factor (a) and their difference (b) with respect to Q0 of the semi-disk DR for the whispering gallery modes with different azimuthal indexes m = 34 (curve 2); 35 (curve 3); and 36 (curve 1) on the percentage C of the ethanol in the water solution.

The possibility of using the HEmsl -modes for water-ethanol solutions was considered as well. The excitation of these whispering gallery modes was achieved by turning the coupling slot at an angle 90° with respect to the orientation for EHmsl. In this case, the electric field vector was oriented parallel to the capillary with the liquid under test. We can conclude that the sensitivity of the HE-modes is much worse than for the EH-modes. For this reason, the data on the behavior of their spectral and energy characteristics are not given.
Measurement error estimation
For our waveguide method the absolute error of measuring the difference in the wave attenuation in the cavities for our experiments did not exceed 0.01 dB in the range of the difference in attenuation of up to 6 and 0.05 dB in the range of the difference of attenuation of up to 10 dB. The absolute error in measuring the phase difference did not exceed 0.4.
The indicated errors were caused by the errors of the measuring attenuator and phase shifter. As a result, for aqueous solutions of ethanol with a concentration of up to 30%, a relative error in measuring the attenuation coefficients and phase of the wave with respect to water was provided, which amounted to 0.05 and 0.1%, respectively. The relative error in measuring the attenuation coefficients of ethanol solutions with a concentration of up to 60% with respect to water was higher, but did not exceed 0.25%.
The error with which the results were obtained additionally included: (1) the error in recalculating the attenuation coefficients and the phase of the wave in the CP of the solution; (2) the error with which the CP of the reference liquid (distilled water) was known; (3) the error with which aqueous solutions of ethanol were prepared. As a result, the total relative measurement error could reach 3%.
The error origins of indirect CP measurement using resonator method are the errors in measuring the quality factor (δQ) and resonant frequency (δf). Error estimation was carried out according to the well-known formula $\Delta F = \sqrt {\sum\limits_{i = 1}^n {{\left({\Delta x_i{{\partial F} \over {\partial x_i}}} \right)}^2} }$ , where F = F(x 1,x 2…xn), xi – directly measurable independent quantities having an error Δxi. These errors are interconnected via partial derivatives ∂ɛ′/∂f, ∂ɛ′/∂Q, ∂ɛ′′/∂f и ∂ɛ′′/∂Q. It was $\Delta {\varepsilon }^{\prime}_2/\Delta f$
 = 15 MGz−1, $\vert \Delta {\varepsilon }^{\prime \prime}_2/\Delta f\vert$
 = 0,1 MGz−1, and, accordingly, at small Q-factors (from 400 to 420) was $\Delta {\varepsilon }^{\prime \prime}_2/\Delta Q$
 = 0.003. As a result, the values of the error of the CP of the liquid under study were obtained $\Delta {\varepsilon }^{\prime}_2 =$
 0.045, $\Delta {\varepsilon }^{\prime \prime}_2 =$
 0.075, which amounts to 0.4%.
In addition to the error associated with the measurement procedure, there is a methodological error associated with determining the effective СP of the rod. It is due to the accuracy of determining the alcohol content of the test aqueous-alcohol solution, as well as the resonant frequency and quality factor of the resonator. It was found that when the error in determining the percentage of alcohol in water is 1%, the relative error in determining the real part of the wine СP is 4%, and the imaginary part of the СP wine is 7%. Thus, the accuracy of determining the CP of a strongly absorbing liquid mainly depends on the accuracy of determining the alcohol content of the test aqueous-alcohol solution. The relative error in determining the alcohol content of the test aqueous-alcohol solution was not more than 0.5%.
Comparison of the two techniques
As known, the sensitivity of a measuring instrument is a property of the measuring instrument, determined by the ratio of the change in the output signal of this medium to its causing change in the measured value Δ C, where Δ C is 40% ethanol concentration in water solutions. We can conclude from Table 1 that the maximum sensitivity in the amplitude change in the waveguide method is ΔA/ΔC = 0.375. And the maximum sensitivity in the resonant frequency change for the higher azimuthal index (m = 36) in the resonator method is Δf/ΔC = 0.375. Thus, these two methods are almost the same in the sense of sensitivity for the water-ethanol solution measurements.
The sensitivity of waveguide and resonator methods.

Conclusion
A comparison of the measurement results of dielectric properties of high loss liquids under test has been presented for the waveguide method and the resonator method. These were provided by a differential 8-mm range layered waveguide cell as a main part of the dielectrometer and a semi-disk resonator with the whispering gallery modes for the express analysis of the dielectric properties of high-loss liquids. We have obtained the measurement data of water and water-ethanol solutions that are the main component of a number of liquid substances used, for instance, in food industry, microbiological research, biochemical and biophysical laboratories, and so on. These data can be in the development of dielectrometry usage techniques, namely the CP determination of any liquid substances.
The present work demonstrates the opportunity to detect the distinctive features of water-ethanol solutions with different ethanol content in water solutions using both the waveguide layered measurement cell and the semi-disk DR with the EH-polarized whispering gallery modes. The operating whispering gallery modes are characterized by the highest sensitivity especially at big concentrations of ethanol in water-ethanol solutions (from 50 to 96%). Still the waveguide method demonstrates an unambiguous dependence on large range concentrations of ethanol in water-ethanol solutions (from 0 to 90%).
We have found that these two methods are almost the same in regards to the sensitivity in the water-ethanol solution measurements of the amplitude change (the waveguide method) and to the sensitivity to the resonant frequency change (the resonator method). The waveguide method and the resonator method can be used together to check the properties of the liquid under test.
 Zoya E. Eremenko (IEEE Senior Member’05) received the M.Sc. degree in radio technology from Kharkiv Aviation Institute with honor, Kharkiv, Ukraine, 1984. She received the Ph.D. and Dr. Sc. Degrees in Physics and Mathematics at The A. Ya. Usykov Institute for Radiophysics and Electronics, The National Academy of Sciences of Ukraine, Kharkiv, in 1996 and 2011, respectively. She is the head of the department of acoustic and electromagnetic spectroscopy at The A. Ya. Usykov Institute for Radiophysics and Electronics, The National Academy of Sciences of Ukraine. Her current research interests include wave propagation in the resonator layered structures with high loss liquids and microwave resonator modeling of chaos phenomena. She has authored more than 170 research articles.
 Oleksandr I. Shubnyi received the M.Sc. degree in electronic devices from Kharkiv Institute of Radioelectronics with honor, Kharkiv, Ukraine, in 1980, the Ph.D. degrees in Phys. and Math. Sciences at Kharkiv National University of Radio Electronics in 2017. He is the deputy head of the department of solid-state electronics at The A. Ya. Usykov Institute for Radiophysics and Electronics, The National Academy of Sciences of Ukraine. His current research interests include wave propagation in different resonator structures with high loss liquids and design and investigation of millimeter wave oscillators and quasi-optical resonators. He has authored more than 80 research articles.
 Aleksandr E. Kogut (IEEE Member’18, EuMA, SPIE) received the M.Sc. degree in radiophysics and electronics from Kharkiv State University with honor, Kharkiv, Ukraine, in 1992, the Ph.D. and Dr. Sc. Degrees in Phys. and Math. at The O. Ya. Usykov Institute for Radiophysics and Electronics, The National Academy of Sciences of Ukraine, Kharkiv, in 1998 and 2011, respectively. Since 2011 he has been an academician of the Academy of Applied Radioelectronics. He is the author of more than 100 scientific papers in the fields of experimental electromagnetism, millimeter wave active devices and resonant techniques.
 Roman S. Dolia (IEEE Member’16, member of EuMA) received the B.S. degree in applied physics and M.S. degree in radiophysics and electronics from V. N. Karazin Kharkiv National University, Kharkiv, Ukraine, in 2013 and 2014, respectively. He is currently pursuing his Ph.D. in physics and astronomy at The O. Ya. Usikov Institute for Radiophysics and Electronics of NAS of Ukraine, Kharkiv, Ukraine. From 2013 to 2014, he was an engineer in the department of solid state radiophysics (IRE NASU). Since 2014, he has been an assistant of leading researcher with the department of solid state radio physics. His current research interests include the development of L, X – bands microwave resonators system, development of small-sized Ka-band active and passive microwave devices, dielectrometry of solids.