





1. Introduction
The rapid expansion of low Earth orbit (LEO) satellite constellations is changing the radio sky at frequencies that are central to ground-based low-frequency radio astronomy. As of early 2026, the McDowell General Catalogue of Artificial Space Objects records more than
 $8\,000$
operational Starlink satellites in low Earth orbit, with several other large constellations also entering deployment (McDowell Reference McDowell2020; Lawler et al. Reference Lawler, Boley and Rein2022; Grigg et al. Reference Grigg, Tingay and Sokolowski2025). The impact of these megaconstellations on optical and radio astronomy has been the subject of sustained community concern (Walker et al. Reference Walker2020a,b
; Barentine et al. Reference Barentine, Venkatesan, Heim, Lowenthal, Kocifaj and Bará2023). Even when a satellite does not intentionally transmit in a protected radio astronomy band, its on-board electronics, high-speed digital interfaces, and power-conditioning systems can produce wideband unintended electromagnetic radiation (UEMR) that propagates into the receiver (Di Vruno et al. Reference Di Vruno, Winkel, Bassa, Józsa, Brentjens, Jessner and Garrington2023). For the Square Kilometre Array low-frequency telescope (SKA-Low; Dewdney et al. Reference Dewdney, Hall, Schilizzi and Lazio2009), whose core stations operate between 50 and 350 MHz and target key cosmological signals from the Cosmic Dawn and Epoch of Reionisation (Furlanetto et al. Reference Furlanetto, Oh and Briggs2006; Koopmans et al. Reference Koopmans2015), UEMR has emerged as a limiting contribution to the effective noise floor at the array site (Grigg et al. Reference Grigg, Tingay and Sokolowski2025; Bassa et al. Reference Bassa, Di Vruno, Winkel, Jozsa, Brentjens and Zhang2024), and even comparatively faint interference is known to inject excess power into 21 cm power spectrum measurements (Wilensky et al. Reference Wilensky, Barry, Morales, Hazelton and Byrne2020).
Following Di Vruno et al. (Reference Di Vruno, Winkel, Bassa, Józsa, Brentjens, Jessner and Garrington2023), we distinguish UEMR from intended emission and from regulated unwanted emissions. UEMR is neither governed by radio regulations such as the International Telecommunication Union Radiocommunication Sector (ITU-R) Recommendation RA.769 (ITU-R 2003) nor by the framework for unwanted emissions from non-geostationary fixed-satellite systems (ITU-R 2007), nor designed into the system by the operator; it is an unavoidable side product of on-board hardware. In contrast to intended transmissions, the UEMR spectrum is typically broadband, its time and frequency structure reflects internal digital clock harmonics and switched-mode power-supply fundamentals, and its amplitude can depend on the operational state of the satellite, which is not directly observable from the ground.
Systematic detection of UEMR from modern LEO constellations dates from Di Vruno et al. (Reference Di Vruno, Winkel, Bassa, Józsa, Brentjens, Jessner and Garrington2023), who used the Low-Frequency Array (LOFAR; van Haarlem et al. Reference van Haarlem2013) to identify narrow spectral features from 47 Starlink satellites in the 110–188 MHz range. Grigg et al. (Reference Grigg, Tingay, Sokolowski, Wayth, Indermuehle and Prabu2023), building on the passive-radar satellite detection technique developed for the Murchison Widefield Array (MWA) by Prabu et al. (Reference Prabu, Hancock, Zhang and Tingay2020), independently detected broadband Starlink UEMR with the EDA2 in Western Australia, in a location that is representative of the SKA-Low site. Bassa et al. (Reference Bassa, Di Vruno, Winkel, Jozsa, Brentjens and Zhang2024) subsequently reported that the second-generation v2-Mini satellites emit UEMR up to a factor of 32 stronger than their v1.0 and v1.5 predecessors, marking a regression of the on-board UEMR environment across a single vendor’s product cycle. Zhang et al. (Reference Zhang2025) used the New Extension in Nançay Upgrading LOFAR (NenuFAR; Zarka et al. Reference Zarka, Girard, Tagger, Denis, Boissier, de Laverny, Nardetto, Samadi, Valls-Gabaud and Wozniak2012, Reference Zarka2018) to add polarimetric constraints on the Stokes parameters of the v2-Mini broadband signal. Most recently, Grigg et al. (Reference Grigg, Tingay and Sokolowski2025) released a survey of
 $112\,534$
stacked EDA2 detections across
 $1\,806$
satellites and 21 frequency channels, together with the underlying event catalogue, providing the first statistically large sample in which individual satellites can be tracked across orbits.
Starlink populations analysed in this work.

Table 1. Long description
A table comparing Starlink populations analyzed in this work. The table has four rows and four columns. The columns are labeled Population, GCAT bus, N sat, and N det. The rows are labeled v2-Mini DTC, v2-Mini Ku (pre-optical), v1.x, and Total (analysed). Row 1: v2-Mini DTC, V2MD, 175, 10 180. Row 2: v2-Mini Ku (pre-optical), V2M, 1 623, 102 197. Row 3: v1.x, V1.0/V1.5, 8, 157. Row 4: Total (analysed), , 1 806, 112 534.
Notes:
 $N_\mathrm{sat}$
is the number of distinct catalogue identifiers;
 $N_\mathrm{det}$
is the number of stacked detections at fine_channel_index = 31 in the Grigg et al. (Reference Grigg, Tingay and Sokolowski2025) catalogue. The v2-Mini Optical variant (V2MO) is absent from the catalogue.
During the period covered by the Grigg et al. (Reference Grigg, Tingay and Sokolowski2025) observations, SpaceX began deploying a distinct subclass of v2-Mini satellites carrying the Direct-to-Cell (DTC) payload, identified in the McDowell General Catalogue of Artificial Space Objects (GCAT; McDowell Reference McDowell2020) by the satellite bus label V2MD. These satellites differ from the Ku-only v2-Mini (V2M) primarily in that they carry additional L-band and S-band equipment for direct cellular phone connectivity under the Supplemental Coverage from Space authorisation granted to the operator by the Federal Communications Commission (FCC) (Federal Communications Commission 2024). Although DTC satellites are included in the aggregate statistics of Grigg et al. (Reference Grigg, Tingay and Sokolowski2025), to our knowledge no published study has yet isolated their UEMR contribution, tested whether the DTC payload changes the low-frequency UEMR spectrum, or examined whether their emission properties depend on the spacecraft’s illumination state. These questions have immediate practical relevance, because the DTC fleet is growing rapidly and will form a substantial fraction of the operational constellation within the next two years.
In this paper we present a reanalysis of the Grigg et al. (Reference Grigg, Tingay and Sokolowski2025) event catalogue in which DTC satellites are separated from Ku-only v2-Mini comparison satellites using the GCAT bus classification. We examine three questions: whether the DTC population shows a per-satellite excess in range-corrected flux density relative to the Ku-only comparison; whether any coarse frequency channel exhibits a polarisation asymmetry beyond the pooled v2-Mini baseline; and whether the flux density depends on the solar illumination state of the spacecraft. We find that the detected DTC event population is, on average, brighter when the spacecraft is eclipsed than when it is illuminated, whereas the Ku-only comparison population shows the opposite sense, and that this reversal persists under stratification by altitude, sub-satellite latitude, and frequency. We then discuss the implications for the physical origin of the UEMR and for future SKA-Low operations.
2. Observations and analysis
2.1. Data source
We use the event catalogue released by Grigg et al. (Reference Grigg, Tingay and Sokolowski2025), which reports
 $112\,534$
stacked detectionsFootnote
a
of Starlink satellites across 21 discrete EDA2 frequency channels covering
 $72.685$
–
 $234.375$
MHz. The observations were carried out with the Engineering Development Array version 2 (Wayth et al. Reference Wayth2021), located at the Murchison Radio-astronomy Observatory (MRO) in Western Australia, between Coordinated Universal Time (UTC) 2024 June and 2024 October. The catalogue is retrieved from Zenodo (10.5281/zenodo.15089853) and its tabulated positions, fluxes, and ephemerides are used as provided.
2.2. Satellite classification
Individual satellites are classified using the McDowell General Catalogue of Artificial Space Objects (GCAT; McDowell Reference McDowell2020), retrieved on 2026 April 8. The North American Aerospace Defense Command (NORAD) identifiers reported by Grigg et al. (Reference Grigg, Tingay and Sokolowski2025) are cross-matched against the GCAT Bus field, and three populations are retained: (i) v2-Mini DTC satellites carrying the Direct-to-Cell payload (bus label V2MD), comprising 175 objects with
 $10\,180$
stacked detections; (ii) v2-Mini Ku pre-Optical satellites (V2M), comprising
 $1\,623$
objects with
 $102\,197$
detections; and (iii) v1.x satellites (V1.0 and V1.5), of which 8 objects with 157 detections are present. The v2-Mini Optical variant (V2MO) is absent from the catalogue, consistent with its deployment timing. The GCAT bus classification is derived from FCC filings and launch manifests published by the operator and has been cross-checked against independent launch-tracking resources; its labels are adopted without further modification. The 175 Direct-to-Cell satellites in the sample span multiple launch batches, orbital planes, and vehicle serial numbers, which together provide sufficient independence to support the per-population statistics reported in Section 3. Satellite-to-detection association inherits the cross-matching pipeline of Grigg et al. (Reference Grigg, Tingay and Sokolowski2025), in which detections are linked to NORAD catalogue entries via the Simplified General Perturbations 4 (SGP4) propagation model and publicly available two-line element (TLE) sets. The association quality therefore inherits the matching criteria and limitations of Grigg et al. (Reference Grigg, Tingay and Sokolowski2025). The same association and calibration pipeline is applied to both payload classes, so residual misidentifications are unlikely to explain the observed population-level differences; their exact rate cannot be estimated independently from the public catalogue used here. Table 1 summarises the three populations and Figure 1 shows their distribution-level properties.
Overview of the
 $1\,798$
v2-Mini Starlink satellites in the Grigg et al. (Reference Grigg, Tingay and Sokolowski2025) EDA2 catalogue after the GCAT classification and quality cuts of Section 2. Left: number of stacked detections per satellite as a function of NORAD catalogue identifier, for the two populations compared in this work. Right: per-satellite median range-corrected flux density (in Jy at
 $1\,000$
km), shown as a violin plot with interquartile range. The ratio of medians is quoted at the top of the panel.

2.3. Range-corrected flux density
To remove the geometric distance dependence that dominates the raw flux densities, the range-corrected flux density is defined as
 \begin{equation} S_\mathrm{norm} \equiv S_\mathrm{obs}\,(r_\mathrm{sat}/r_\mathrm{ref})^{2}, \qquad r_\mathrm{ref} = 1\,000\,\mathrm{km}, \end{equation}
where
 $S_\mathrm{obs}$
is the measured flux density in Jy and
 $r_\mathrm{sat}$
is the instantaneous satellite range from EDA2 taken from the TLE propagation in Grigg et al. (Reference Grigg, Tingay and Sokolowski2025). This normalisation follows Bassa et al. (Reference Bassa, Di Vruno, Winkel, Jozsa, Brentjens and Zhang2024) and permits the direct comparison of satellites observed at different geometries. Except where noted, distribution-wise statistics are reported on the per-satellite median of
 $S_\mathrm{norm}$
, so that satellites with highly unequal numbers of detections do not bias the comparison.
2.4. Illumination geometry
For each detection the sub-satellite latitude, longitude, and altitude are derived by projecting the topocentric azimuth and elevation reported by Grigg et al. (Reference Grigg, Tingay and Sokolowski2025) to an Earth-centred Earth-fixed (ECEF) frame at the EDA2 location and then converting to geodetic coordinates. To determine whether the satellite was in sunlight or in the Earth’s shadow at the time of the detection, the apparent solar position in ECEF is computed from the low-precision International Astronomical Union (IAU) solar model (Seidelmann Reference Seidelmann1992), and a cylindrical Earth-shadow approximation is then applied. A satellite is considered illuminated if its position vector has a positive component along the Sun direction, or if its perpendicular distance to the Sun–Earth axis exceeds the mean Earth radius
 $R_\oplus = 6\,378.137$
km. This geometric test neglects atmospheric refraction and umbra/penumbra effects and is therefore appropriate for the 300–412 km altitude range with non-trivial detection counts in which the v2-Mini population orbits. The full set of coordinate transformations and the cylindrical shadow test are given in Appendix B.
2.5. Statistical comparisons
We perform three comparisons. First, the per-satellite median range-corrected flux density of the DTC population is compared with that of the Ku-only comparison population using the Mann–Whitney U test, Cliff’s
 $\delta$
, and the ratio of medians with 95% bootstrap confidence intervals. The non-parametric Mann–Whitney U test is adopted because the per-satellite flux density distributions are strongly non-Gaussian and heavy-tailed (see Feigelson & Babu Reference Feigelson and Babu2012, Chapter 5) and exhibit the long tails visible in Figure 5(d). Cliff’s
 $\delta$
is reported alongside the p-value because the large sample sizes render any small shift formally significant, so an explicit effect size is required to judge practical relevance. Second, the fraction of events detected in the XX polarisation feed is examined across the 21 coarse channels for deviations from an instrumental baseline estimated from the pooled sample; a two-sided event-level binomial test is applied per channel, and the false discovery rate (FDR) across the 21 channels is controlled using the Benjamini–Hochberg procedure (Benjamini & Hochberg Reference Benjamini and Hochberg1995) at
 $q = 0.05$
. Here, XX and YY denote the two orthogonal linear-feed products. Third, the range-corrected flux density is compared between illuminated and eclipsed passes, first on the pooled v2-Mini sample and then separately on the DTC and Ku-only sub-samples. The mathematical definitions of the test statistics are given in Appendix A.
3. Results
After applying the classification and quality cuts described in Section 2, the working sample contains
 $1\,798$
v2-Mini Starlink satellites with a total of
 $112\,377$
range-corrected detections. The v2-Mini DTC subsample accounts for 175 satellites and
 $10\,180$
detections, while the Ku-only pre-Optical v2-Mini comparison accounts for
 $1\,623$
satellites and
 $102\,197$
detections. The eight v1.x satellites present in the catalogue contribute only 157 detections and are shown for reference in Figure 4(c) but are not used in the statistical comparisons below. Figure 1(a) shows that the per-satellite detection count follows a broad distribution for both populations; Figure 1(b) shows that their per-satellite range-corrected flux density distributions overlap substantially, with the DTC population shifted towards higher values.
Pass geometry of the analysed v2-Mini detections. Left: sub-satellite longitude and latitude for all v2-Mini Ku-only (purple) and DTC (orange) detections; the star marks the EDA2 location at the Murchison Radio-astronomy Observatory. Right: azimuth and zenith-angle polar projection of all detections, colour-coded by
 $\log_{10}$
range-corrected flux density.

Dynamic spectra of the brightest pass at the
 $230.469$
MHz coarse channel for (a) a representative v2-Mini DTC satellite (NORAD 60041, pass duration 128 s) and (b) a representative Ku-only v2-Mini satellite (NORAD 60347, pass duration 48 s), constructed from the 31 fine channels within the coarse band. In each panel the brightest pass is the pass with the highest integrated
 $S_\mathrm{norm}$
at this coarse channel for that satellite. Top marginal panels show the flux density integrated across fine channels; left marginal panels show the time-integrated spectrum. The green curve overlays the satellite elevation during the pass. The two populations show qualitatively different time/frequency structure at this coarse channel, which is analysed statistically in Figures 7 and 8.

Observed flux density as a function of satellite range, colour-coded by elevation, for (a) v2-Mini Ku-only, (b) v2-Mini DTC, and (c) v1.x Starlink satellites. The dashed line in each panel shows the inverse-square scaling
 $\propto r^{-2}$
anchored at the median range-corrected flux density of the Ku-only comparison population, drawn as a guide to the eye; the dotted line shows ten times this baseline. Points offset above the dashed line correspond to UEMR in excess of the comparison median. For visual clarity, the Ku-only panel is randomly downsampled to
 $15\,000$
detections (random seed 42); all statistical tests use the full
 $102\,197$
-detection sample.

Figure 2 shows that the two populations have essentially overlapping sky coverage. Most detections occur in passes over the Murchison Radio-astronomy Observatory at sub-satellite latitudes between
 $-30^{\circ}$
and
 $-24^{\circ}$
and at satellite altitudes between 350 and 570 km. The azimuth/zenith-angle polar projection (Figure 2(b)) is dominated by detections at elevations above
 $45^{\circ}$
, consistent with the sensitivity pattern of the EDA2 station. The similarity of the two populations’ sky coverage is important for the statistical comparisons in Sections 3.1–3.6, because it ensures that any differences in their flux density distributions cannot be attributed to differences in pass geometry alone.
Figure 3 shows the dynamic spectrum of the brightest pass at the
 $230.469$
MHz coarse channel for one representative DTC satellite (NORAD 60041) and one representative Ku-only comparison satellite (NORAD 60347), constructed from the 31 fine channels within the coarse band. The time–frequency structure differs qualitatively between the two passes: the DTC pass shows a concentrated flux density burst during the first 40 s, coincident with the elevation rise from
 $40^{\circ}$
to
 $85^{\circ}$
, while the Ku-only pass shows its maximum flux density in the second half of the pass as the elevation descends from
 $65^{\circ}$
. Both show emission that is broadband across all 31 fine channels of the coarse band. These dynamic spectra serve as motivation for the statistical analysis of the
 $230.469$
MHz channel in Section 3.2; an individual pair of passes cannot, on its own, support a mechanism-level conclusion.
Figure 4 shows the observed flux density as a function of satellite range for the three populations, colour-coded by instantaneous elevation. The dashed line in each panel is a reference inverse-square envelope
 $\propto r^{-2}$
anchored at the median range-corrected flux density of the Ku-only comparison population. Panel (a), which shows the Ku-only comparison, is aligned with the dashed line by construction. Panel (b), which shows the DTC population, lies systematically above the dashed line at all ranges, consistent with the per-satellite excess quantified in Section 3.1. Panel (c), which shows the 157 v1.x detections, is sparse and is consistent with the baseline in the range for which points exist, as expected if the range-corrected statistics approximately align the v1.x and Ku-only v2-Mini populations.
3.1. DTC per-satellite excess
Figure 5 shows the cumulative distribution function of the flux density for the DTC and Ku-only comparison populations under four equivalent reductions. The raw per-detection comparison (panel a) is dominated by the range distribution of each population and is therefore not a measurement of intrinsic brightness. The range-corrected per-detection comparison (panel b) removes the geometric factor and yields a DTC/Ku median ratio that is quoted in the panel title. The per-satellite statistics in panels (c) and (d) give equal weight to each satellite, and avoid biasing the comparison in favour of satellites with unusually high detection counts. The range-corrected per-satellite median (panel d) is adopted as the main summary statistic for the per-satellite excess.
The main summary statistic yields a DTC/Ku median ratio of
 $1.449$
with a 95% bootstrap confidence interval of
 $[1.27, 1.67]$
drawn from
 $2\,000$
resamplings. A two-sided Mann–Whitney U test rejects the null hypothesis of identical distributions at
 $p = 4.1\times10^{-11}$
. The effect size quantified by Cliff’s
 $\delta$
is
 $+0.303$
. The direction of the effect is consistent across the four reductions shown in Figure 5(a)–(d), and the ratio is largest for the per-satellite range-corrected reduction, which is the reduction least affected by the geometry of the observations. Cross-checking against the LOFAR sample of Bassa et al. (Reference Bassa, Di Vruno, Winkel, Jozsa, Brentjens and Zhang2024), the six DTC satellites observed there all appear in our 175-satellite DTC sample with the EDA2 detection counts listed in Table 2, showing sample overlap across the two instruments rather than independently confirming the EDA2 per-satellite excess.
The two datasets sample the same UEMR phenomenon at different points in the time–frequency plane. The LOFAR observations of Bassa et al. (Reference Bassa, Di Vruno, Winkel, Jozsa, Brentjens and Zhang2024) consist of two 1-h coherent COBALT tied-array-beam acquisitions on 2024 July 19, with a native resolution of
 $12.2$
kHz
 $\times$
 $41.94$
ms across the low-band antenna (LBA) (10–88 MHz) and high-band antenna (HBA) (110–188 MHz) bands. The present EDA2 reanalysis instead draws on the multi-night Grigg et al. (Reference Grigg, Tingay and Sokolowski2025) catalogue across 21 discrete coarse channels spanning
 $72.685$
–
 $234.375$
MHz, so the two observations overlap only in the 110–188 MHz window.
Within that window, all six v2-Mini DTC satellites in the HBA sample of Bassa et al. (Reference Bassa, Di Vruno, Winkel, Jozsa, Brentjens and Zhang2024) (NORAD 60039–60048) appear in our 175-satellite DTC selection, with per-satellite EDA2 detection counts ranging from 16 to 103. The dispersion arises from a combination of pass geometry, the number of EDA2 transits per satellite, and intrinsic UEMR variability, whose relative contributions are not separable in the present sample. These counts establish EDA2 coverage of the six objects. We do not compare the EDA2 detection counts with the LOFAR flux densities reported for those satellites because they are different observables measured under different selection functions.
The two methodologies are complementary. The
 $12.2$
kHz LOFAR resolution is fine enough to resolve the comb spacings of 50 and 150 kHz reported by Bassa et al. (Reference Bassa, Di Vruno, Winkel, Jozsa, Brentjens and Zhang2024) in the 116–124 MHz band for v2-Mini DTC satellites; the EDA2 coarse channelisation cannot. Conversely, the LOFAR HBA upper edge of 188 MHz lies below the
 $230.469$
MHz channel at which we report the largest polarisation anomaly (Section 3.2), and the spectral structure at that frequency awaits confirmation from independent broadband observations. The cross-check in Table 2 is therefore best read as a sample-membership consistency test; the per-satellite excess and the Bassa et al. (Reference Bassa, Di Vruno, Winkel, Jozsa, Brentjens and Zhang2024) generation-over-generation factor of 32 are related in Section 4.
Figure 6 decomposes this comparison into each of the 21 coarse frequency channels. The majority of channels show a DTC/Ku ratio above unity, consistent with the per-satellite excess being broadband rather than concentrated in any single frequency band. A single channel at
 $130.469$
MHz shows the opposite sense with a particularly extreme separation from unity, where the DTC population is fainter than the Ku-only comparison by a factor of approximately six (median ratio
 $0.16$
). Several other channels (e.g. 170, 180, 200, 225, 234 MHz; see Table 3) show DTC median ratios modestly below unity, but the magnitude of the
 $130.469$
MHz separation exceeds that of every other below-unity channel by an order of magnitude. No physical interpretation of the
 $130.469$
MHz exception is attempted here. The shaded band in Figure 6 marks the protected Radio Astronomy Service band between
 $150.05$
and 153 MHz; the one coarse channel that falls within this band is consistent with the broadband trend and is not anomalous.
3.2. Coarse-channel polarisation anomalies
Figure 7 shows the deviation of the XX polarisation fraction from the pooled v2-Mini baseline
 $f_\mathrm{XX,inst} = 0.4809$
in each of the 21 coarse channels. The baseline is the pooled-sample XX fraction across the
 $112\,377$
v2-Mini detections analysed here, and represents the XX fraction expected under the null hypothesis that the EDA2 orthogonal polarisation feeds have equal sensitivity and the sources emit unpolarised radiation; it is a pooled-data estimate rather than an independent instrumental calibration, and the leave-one-channel-out robustness check reported below confirms that the largest deviation is preserved under a null baseline that explicitly excludes the test channel. Positive bars indicate channels in which the XX polarisation is observed more frequently than the baseline, and negative bars indicate the opposite. A two-sided event-level binomial test is applied in each channel independently, and the Benjamini–Hochberg FDR procedure at
 $q = 0.05$
is used to control the false discovery rate across the 21 tests. After this correction, 11 of the 21 channels retain significance (coloured bars in Figure 7), and the remaining 10 are consistent with the null baseline at the
 $q = 0.05$
level.
Cumulative distribution functions of the flux density for the DTC (orange) and Ku-only (purple) populations under four equivalent reductions: (a) raw per-detection; (b) range-corrected per-detection; (c) raw per-satellite median; (d) range-corrected per-satellite median. The ratio of medians is quoted in each panel title; the 95% bootstrap confidence interval is shown for panel (d).

The largest deviation, by a wide margin, occurs at
 $230.469$
MHz, where the XX fraction reaches
 $f_\mathrm{XX} = 0.811$
with a 95% Wilson score interval of
 $[0.795, 0.825]$
. A two-sided binomial test at this channel returns an event-level
 $p \sim 10^{-274}$
, well beyond the significance of any other channel in the dataset. The channel lies 80 MHz above the protected Radio Astronomy Service band at
 $150.05$
–153 MHz, and has no assigned Starlink service. The binomial test used here addresses only the population-level event-counting statistic; repeated detections within satellites mean that this is not a cluster-robust significance measure. As a sensitivity check, we compare the
 $230.469$
MHz XX fraction with a leave-one-channel-out pooled v2-Mini baseline using a satellite-cluster sandwich variance, allowing arbitrary dependence within each satellite. The deviation remains
 $+0.338$
(cluster standard error
 $0.025$
,
 $p=2.3\times10^{-40}$
; 84 satellites contribute detections in the test channel). It does not address whether the emission itself is linearly polarised in a physical sense, but only whether EDA2 is more likely to detect the source in the X polarisation feed than in the Y feed.
Figure 8 characterises this channel in more detail. Panel (a) shows the distribution of per-satellite XX fractions for satellites with at least five detections at
 $230.469$
MHz; the distribution is asymmetric and centred well above the baseline, with most satellites showing
 $f_\mathrm{XX}$
between
 $0.7$
and
 $1.0$
. Panel (b) sorts the same satellites by their XX fraction and colour-codes each point by the mean observing elevation; no elevation dependence is apparent, which argues against a dominant beam-shape systematic. Panel (c) shows that both the DTC and Ku-only comparison populations contribute to the excess, with the DTC population exhibiting the larger deviation, consistent with the per-satellite excess reported in Section 3.1. Panel (d) compares the log-flux distributions in the two polarisations directly: the XX distribution contains substantially more events than the YY distribution, but the two distributions have similar shape and median, suggesting that the anomaly is in the number of detections rather than in the per-detection amplitude.
Cross-instrument check against the LOFAR sample of Bassa et al. (Reference Bassa, Di Vruno, Winkel, Jozsa, Brentjens and Zhang2024). All six DTC satellites observed there, identified by their North American Aerospace Defense Command (NORAD) catalogue numbers, appear in our EDA2 sample with detection counts ranging from 16 to 103.

Table 2. Long description
A table with six rows and three columns. The columns are labeled NORAD identifier, Starlink name, and EDA2 detections. The rows list the following data: Row 1: NORAD identifier, 60039; Starlink name, STARLINK-11140; EDA2 detections, 54. Row 2: NORAD identifier, 60040; Starlink name, STARLINK-11122; EDA2 detections, 66. Row 3: NORAD identifier, 60041; Starlink name, STARLINK-11149; EDA2 detections, 103. Row 4: NORAD identifier, 60042; Starlink name, STARLINK-11120; EDA2 detections, 16. Row 5: NORAD identifier, 60043; Starlink name, STARLINK-11086; EDA2 detections, 18. Row 6: NORAD identifier, 60048; Starlink name, STARLINK-11135; EDA2 detections, 37.
Notes: Starlink names from the McDowell GCAT (McDowell Reference McDowell2020); detection counts from this work’s reanalysis of the Grigg et al. (Reference Grigg, Tingay and Sokolowski2025) catalogue.
Table 4 summarises the per-channel binomial test against the instrumental baseline and the Benjamini–Hochberg significance status for all 21 coarse channels in the dataset.
As a robustness check against the circularity of estimating the pooled-sample baseline from data that include the test channel, a leave-one-channel-out baseline is reported. For each channel c, a null XX fraction is computed from the other twenty channels combined, and the binomial test of channel c is repeated against this channel-specific null. Under the leave-one-channel-out baseline, 12 of the 21 channels survive Benjamini–Hochberg control at
 $q=0.05$
(versus 11 under the pooled-sample baseline), and the
 $230.469$
MHz channel returns a deviation of
 $+0.338$
against a leave-one-out baseline of
 $0.473$
with a binomial
 $p \sim 10^{-287}$
. The qualitative pattern of which channels deviate, and in particular the headline status of the
 $230.469$
MHz anomaly, is therefore preserved when the test channel is explicitly excluded from the null baseline calibration.
Per-frequency ratio of DTC to Ku-only range-corrected median flux density, with 95% bootstrap confidence intervals. Squares filled in dark orange lie above unity (DTC-brighter channels); squares filled in lighter salmon lie below unity. The most extreme below-unity channel is at
 $130.469$
MHz, where the DTC/Ku ratio falls to
 $\approx$
 $0.16$
. The shaded band indicates the Radio Astronomy Service band protected by the ITU between
 $150.05$
and 153 MHz.

3.3. Spectral structure of detections
Per-coarse-channel DTC/Ku range-corrected median flux ratio, complementing Figure 6. Channels with fewer than 20 DTC detections (four channels with
 $N_\mathrm{DTC}\in\{0,0,0,16\}$
) are omitted because the per-channel median ratio is not reliably estimated; the
 $10\,164$
DTC detections tabulated here account for
 $10\,180-16=10\,164$
of the
 $10\,180$
DTC detections in the sample.

Table 3. Long description
A table with 11 rows and 6 columns comparing DTC/Ku flux ratios across different frequency channels. The columns are labeled as follows: Frequency (MHz), N DTC, N Ku, DTC/Ku, KS p, and Cliff δ. The table presents data for various frequency channels, with each row providing specific values for the listed parameters. Notable trends include variations in the DTC/Ku ratio and KS p values across different frequency channels.
Notes: KS denotes the Kolmogorov–Smirnov test.
 $N_\mathrm{DTC}$
and
 $N_\mathrm{Ku}$
are the detection counts contributing to the per-channel median ratio. Cliff’s
 $\delta$
is signed such that positive values indicate the DTC population is brighter; the only channel at which DTC is fainter at
 $|\delta|\gt0.5$
is
 $130.469$
MHz (bold).
Deviation of the XX polarisation fraction from the pooled v2-Mini baseline
 $f_\mathrm{XX,inst}$
in each coarse channel. Bars coloured in dark red survive the Benjamini–Hochberg false discovery rate (BH-FDR) control at
 $q = 0.05$
; grey bars do not. The annotation at
 $230.469$
MHz marks the channel with the largest deviation.

Two complementary spectral statistics summarise the per-channel distribution of v2-Mini UEMR in the dataset. The first is the detection-count column N in Table 4, which quantifies where the catalogue threshold is exceeded most often. Detections cluster strongly at
 $150.78$
,
 $153.12$
,
 $161.72$
, and
 $170.31$
MHz, which together account for
 $\sim$
 $75\,000$
of the
 $\sim$
 $112\,500$
stacked detections in the analysed sample (about two-thirds of the total). A secondary peak lies near 200 MHz, and the 73–110 MHz lower band is sparsely populated. The second statistic is the per-channel DTC/Ku ratio plotted in Figure 6: most channels show a ratio above unity, with the largest single-channel exception at
 $130.469$
MHz, where the ratio falls to
 $\approx 0.16$
and the DTC population is fainter than the Ku-only comparison.
The dataset can be sub-divided into three frequency regions for discussion. The low-band region between 73 and 110 MHz contains only three coarse channels in the analysed sample, each with
 $N \lt 350$
detections, and none of the three survives BH-FDR correction; this region therefore contributes weakly to the catalogue-level statistics and is consistent with sparse, near-threshold emission. The mid-band region between 110 and 190 MHz contains eleven coarse channels and most of the catalogue detections; it overlaps the LOFAR HBA window of Di Vruno et al. (Reference Di Vruno, Winkel, Bassa, Józsa, Brentjens, Jessner and Garrington2023) and Bassa et al. (Reference Bassa, Di Vruno, Winkel, Jozsa, Brentjens and Zhang2024), in which v2-Mini DTC satellites were observed to emit broadband UEMR plus narrow comb structure at the 50 and 150 kHz scales. The high-band region between 200 and
 $234.4$
MHz contains four coarse channels absent from the LOFAR HBA coverage; three of these four channels (
 $225.781$
,
 $230.469$
, and
 $234.375$
MHz) survive BH-FDR correction and together contain the largest XX-fraction excursions in the dataset. The
 $230.469$
MHz channel in particular sets the most extreme polarisation anomaly observed in any v2-Mini sub-population reported to date.
The per-channel asymmetry distribution above 200 MHz is therefore not a simple continuation of the lower-frequency pattern. At
 $225.781$
and
 $230.469$
MHz the XX-fraction deviations have the same positive sign (
 $+0.091$
and
 $+0.330$
respectively) but differ by a factor of
 $\sim$
4 in amplitude; at
 $234.375$
MHz the deviation reverses sign and is the largest negative deviation in the sample (
 $\Delta=-0.109$
). No published Starlink Direct-to-Cell band allocation overlaps the EDA2 frequency range, and the per-channel structure cannot be attributed to direct in-band emission from the cellular payload. Plausible origins include harmonic and intermodulation products of on-board oscillators and direct-current to direct-current (DC–DC) converters, conducted emission from power-conditioning subsystems, and out-of-band spectral leakage from communications hardware. These mechanisms are not distinguishable from the EDA2 catalogue alone, because the EDA2 coarse-channel width does not resolve the comb spacings of tens to hundreds of kHz reported by Bassa et al. (Reference Bassa, Di Vruno, Winkel, Jozsa, Brentjens and Zhang2024) at LOFAR resolution. The mechanism discussion is deferred to Section 4.
3.4. Sub-MHz fine-channel structure of the
 $230.469$
MHz anomaly

The
 $230.469$
MHz coarse-channel anomaly reported in Section 3.2 is integrated over the full
 $\sim$
 $0.78$
MHz coarse channel and is therefore agnostic to any sub-MHz spectral structure. Because Bassa et al. (Reference Bassa, Di Vruno, Winkel, Jozsa, Brentjens and Zhang2024) resolved 50 and 150 kHz comb spacings within the 116–124 MHz band at LOFAR’s
 $12.2$
kHz resolution, and because the
 $230.469$
MHz channel lies outside their HBA coverage, the natural follow-up is to inspect the
 $\sim$
24 kHz fine-channel data within the EDA2 coarse band.
Characterisation of the
 $230.469$
MHz XX fraction anomaly. (a) Per-satellite XX fraction distribution for satellites with at least five detections in this channel. (b) The same, sorted by XX fraction and colour-coded by mean elevation. (c) XX fraction by population, with the number of detections quoted. (d) Range-corrected flux density distributions in XX and YY, showing that the XX excess is not accompanied by a commensurate increase in the per-detection amplitude.

We isolate the
 $80\,894$
v2-Mini fine-bin observations (fine-channel index 0–30 in the Grigg et al. (Reference Grigg, Tingay and Sokolowski2025) catalogue,
 $\sim$
 $24.4$
kHz per bin) at the
 $230.469$
MHz coarse channel and recompute per-fine-bin statistics independently of the stacked detection summary already used in Section 3.2. As shown in Figure 9, fine channel 22 (corresponding to
 $\approx$
 $230.627$
MHz, an offset of
 $+159$
kHz from the coarse-channel centre) carries an empirical inter-bin standardised contrast
 $z_\mathrm{inter}=11.0$
in the mean flux relative to the other 30 fine bins (top panel:
 $72.86$
Jy in fine channel 22 versus
 $61.92 \pm 0.99$
Jy elsewhere; per-bin sample sizes range from
 $N=2\,525$
in fine channel 22 to
 $N=2\,641$
elsewhere, with the
 $\sim$
 $80\,894$
total v2-Mini fine rows reflecting the per-bin post-filter rather than
 $2\,704 \times 31$
raw) and a corresponding
 $+55\%$
excess in the 95th-percentile flux (middle panel). Because the same detections contribute to every fine-bin mean,
 $z_\mathrm{inter}$
is a descriptive inter-bin contrast rather than a standard-normal test statistic. We therefore do not attach a normal-theory or Bonferroni p-value to it; inference rests on the magnitude of the contrast and the cross-channel controls. The median flux in fine channel 22 is not elevated, which identifies the feature as a tail-driven phenomenon contributed by a sub-population of bright detections rather than a uniform shift in the bulk of the distribution.
The cross-coarse-channel control shown in Figure 10 addresses a known concern: EDA2 fine channels can in principle carry a fixed bandpass artefact that would inflate flux at the same index across every coarse channel. We re-run the per-fine-bin mean-flux estimator at the five highest-occupancy control channels in the catalogue (
 $150.78$
,
 $153.12$
,
 $161.72$
,
 $170.31$
, and
 $200.00$
MHz) and recover z-scores between
 $-0.4$
and
 $+0.9$
, all within the
 $\pm 3\sigma$
band. The control therefore does not reproduce a fixed fine-channel-index enhancement in the tested control channels, which argues against such an artefact and supports, but does not prove, a narrowband emission process specific to the
 $230.469$
MHz coarse channel rather than to a per-fine-index instrumental response; adjacent high-band coarse channels (
 $225.781$
and
 $234.375$
MHz) are not used as controls because they themselves carry the largest XX-fraction excursions in the catalogue (Table 4) and cannot be assumed feature-free.
Expressed as a ratio rather than absolute mean, the DTC subset shows an excess in fine channel 22 of
 $83.93 / 70.1 = 1.197\times$
over its non-target bins, compared with the Ku-only ratio of
 $\approx$
 $50.2/46.8 = 1.073\times$
, that is, the DTC fine-channel narrowband excess is approximately
 $0.12$
in fractional units larger than the Ku-only excess at the same fine bin. The XX-feed fraction in fine channel 22 (
 $0.834$
) is nominally elevated above the pooled per-bin value of
 $0.810$
, but this comparison is not independent: the Grigg et al. (Reference Grigg, Tingay and Sokolowski2025) catalogue records a single per-detection polarisation index that is propagated across all 31 fine-channel rows of the same detection, so per-fine-bin XX/YY values are not separate measurements and the nominal significance is not interpretable in the usual binomial sense. The narrow flux excess therefore implies a narrowband emission process at
 $\approx$
 $230.627$
MHz that contributes preferentially to detections recorded in the XX feed; a definitive mechanism-level interpretation is deferred to Section 4.1, where this fine-channel constraint is combined with the eclipse-state result. Before that, the next subsection (Section 3.5) presents three mechanism-oriented observational checks that further constrain the physical origin of the
 $230.627$
MHz feature without invoking a phenomenological model.
Per-channel event-level binomial test of the XX detection fraction against the pooled v2-Mini baseline
 $f_\mathrm{XX,inst}=0.4809$
. Eleven of the 21 coarse channels survive Benjamini–Hochberg false discovery rate control at
 $q=0.05$
. The
 $230.469$
MHz channel is the largest deviation in the dataset.

Table 4. Long description
A table with 11 rows and 5 columns. The columns are labeled as follows: f (MHz), N, fxx, Δ, p-value, and BH. The table presents the results of a binomial test for different frequency channels, including the frequency in MHz, the number of events (N), the detection fraction (fxx), the difference (Δ), the p-value, and the Benjamini-Hochberg (BH) significance status. Each row provides the specific values for these parameters across different channels. Notable values include the highest deviation in the dataset at 150.78 MHz with a p-value of 6 x 10^-61 and the largest detection fraction at 225.78 MHz with a value of 0.572.
Notes: N: total detections in the channel;
 $f_\mathrm{XX}$
: XX-feed detection fraction;
 $\Delta$
: deviation from the pooled baseline; BH column marks channels surviving false discovery rate control at
 $q=0.05$
(
 $11/21$
).
3.5. Mechanism-oriented checks of the fine-channel feature
The fine-channel narrowband excess of Section 3.4 admits several physical interpretations – harmonic emission from on-board clock fundamentals, a switch-mode payload mode, an intermodulation product between oscillators, uniform thermal scaling across the population, or a hardware fault localised to a small sub-population. We use three numerical checks to assess which simple interpretations are consistent with the observed patterns. The checks address: (T1) whether the
 $230.627$
MHz feature is consistent with an integer harmonic of any clock fundamental resolved by Bassa et al. (Reference Bassa, Di Vruno, Winkel, Jozsa, Brentjens and Zhang2024) at LOFAR’s
 $12.2$
kHz resolution; (T2) whether the fine-channel excess is confined to a single
 $\sim$
 $24.4$
kHz bin or smears into adjacent fine bins; and (T3) whether the per-satellite distribution of fine-channel excess is dominated by a few permanently-bright satellites or expressed uniformly across the fleet. These alternatives are descriptive; the catalogue does not identify an operational duty cycle. The combined panel results are shown in Figure 11.
T1 – Harmonic-coincidence test
We evaluated the integer-harmonic predictions
 $N \times f_0$
of each of the 14 Bassa+2024 clock fundamentals (
 $27.5$
,
 $36.66$
, 55, 110, and 220 kHz for v2-Mini DTC LBA;
 $37.5$
, 50, 75 and 150 kHz for v2-Mini LBA; 50, 150 kHz for v2-Mini DTC HBA at 116–124 MHz;
 $48.8$
, 65 and
 $97.5$
kHz for v2-Mini HBA at 157–165 MHz) and selected, for each fundamental, the integer N that minimises the residual relative to the centroid of EDA2 fine channel 22
 $230.627441$
MHz. A match was declared when
 $|N f_0 - 230.627441\,\mathrm{MHz}| \le 12.207$
kHz, that is, within one half of the EDA2 fine bin (Figure 11(a)). Five of the 14 fundamentals produce a match within tolerance. The expected number of chance coincidences under the null hypothesis of uniformly-distributed harmonics on the EDA2 fine grid is
 $\sum_i \min(1, 2 \Delta f / f_{0,i}) = 5.73$
with
 $\Delta f = 12.207$
kHz, so the observed count is at the chance level (observed/expected
 $= 0.87$
) and the matching set is scattered across fundamentals rather than concentrated on a single one. The 50 and 150 kHz fundamentals each appear twice in the 14-entry list (once for the LBA non-DTC v2-Mini context and once for the HBA DTC v2-Mini context, in which Bassa et al. Reference Bassa, Di Vruno, Winkel, Jozsa, Brentjens and Zhang2024 report the same numerical comb in distinct band/population settings); treating these as a single oscillator each reduces the expected count to
 $\approx$
 $5.08$
and leaves the observed/expected ratio at
 $0.98$
– still at the chance level. Because harmonically related fundamentals are not statistically independent, the observed/expected ratio is reported as a rule-out criterion rather than as a formal p-value. A superset of 9 additional crystal-oscillator candidates (10, 13, 16, 20, 25, 27, 100 MHz and the
 $12.288$
MHz audio codec, plus a
 $32.768$
kHz real-time clock) yields one match (the
 $32.768$
kHz real-time clock (RTC) at harmonic
 $N = 7038$
), also at chance (
 $0.76$
expected). We conclude that the
 $230.627$
MHz feature is not uniquely tied to any LOFAR-resolved Starlink clock fundamental, disfavouring a common oscillator with the 116–165 MHz combs while not excluding clock-spurious emission in general from other internal references not characterised by the lower-band study.
T2 – Adjacent-bin coherence
The single-bin nature of the excess in fine channel 22 identified in Section 3.4 can be tested directly. Pivoting the v2-Mini detections at the
 $230.469$
MHz coarse channel into a wide table indexed by fine-channel (31 fine bins per detection,
 $N=2\,525$
detections with valid flux in fine channel 22 after the geometry filter), we restrict to detections in which the flux in fine channel 22 exceeds its sample 95th percentile (
 $p_{95} = 241$
Jy,
 $N = 127$
detections in the bright subset) and compute the mean flux at each of the other 30 fine bins within this subset (Figure 11(b)). The mean of the 28 bins excluding fine channels 21, 22, and 23 defines the inter-bin baseline (
 $\mu = 143.5$
Jy beam
 $^{-1}$
,
 $\sigma = 8.4$
Jy beam
 $^{-1}$
across the 28 bin means). The z-scores relative to this baseline are
 $z_{22} = +25.4$
(a sanity check confirming the bright cut),
 $z_{21} = -1.26$
, and
 $z_{23} = -0.96$
; both adjacent bins therefore lie at or below baseline rather than above. Neither adjacent bin is elevated in this subset. The
 $230.627$
MHz feature is therefore unresolved beyond a single
 $24.4$
kHz bin at the EDA2 resolution; this check does not by itself establish the intrinsic line profile, and a sharper measurement requires higher-resolution follow-up. The negative adjacent-bin z-scores are descriptive and are not interpreted as evidence for suppressed neighbouring-bin power.
Per-fine-channel statistics within the
 $230.469$
MHz coarse band (
 $N=80\,894$
v2-Mini fine-bin observations from the Grigg et al. (Reference Grigg, Tingay and Sokolowski2025) catalogue, geometry-filtered). Top: mean flux, split DTC vs Ku-only. Middle: median and 95th-percentile flux, pooled. Bottom: XX-feed fraction with binomial error bars; the pooled-sample value
 $\hat p=0.810$
is marked. Fine channel 22 (catalogue index 22;
 $\approx$
 $230.627$
MHz) is highlighted as the only bin with markedly elevated mean and upper-percentile flux; the XX-fraction variation across bins is constrained by the per-detection polarisation assignment in the catalogue and is informative only insofar as the mean shift reflects the larger-flux fraction in fine channel 22.

T3 – Per-satellite ratio distribution
For each of the 82 v2-Mini satellites with
 $\ge$
5 detections at the
 $230.469$
MHz coarse channel, we computed the per-satellite ratio
 $R_i = \overline{F_{22,i}}\, /\, \overline{F_{\mathrm{other},i}}$
in which the numerator is the satellite’s mean flux in fine channel 22 and the denominator is its mean over the 28 non-adjacent fine bins. The distribution (Figure 11(c)) has median
 $R = 1.07$
, mean
 $R = 1.18$
,
 $p_{95} = 1.79$
, and maximum
 $R = 3.75$
. We use the distribution for two descriptive robustness checks. Three of the 82 satellites (
 $3.7\%$
) have
 $R_i \gt 2$
. Re-running the same inter-bin z-score machinery applied in Section 3.4 on the 79 remaining satellites (i.e. removing all detections from the three
 $R_i \gt 2$
satellites and recomputing the per-fine-bin means and inter-bin baseline) yields
 $z_{22} = +12.95$
– the excess remains after the brightest three are removed, so those three satellites alone do not account for the signal. The mean of the top decile of
 $R_i$
is
 $2.13$
, whereas the mean of the bottom half is
 $0.94$
(Figure 11(d)); the
 $2.26\times$
ratio shows substantial rank-defined dispersion, and the
 $45/82$
(
 $54.9\%$
) satellites with
 $R_i \gt 1.05$
show that the excess is not limited to a few units. This spread could reflect intrinsic satellite-to-satellite heterogeneity, intermittent emission, sampling variation, or measurement noise; the catalogue alone does not distinguish among them.
Combined interpretation
The three checks narrow the observational description without identifying the mechanism. The
 $230.627$
MHz feature (T1) is not coincident with any uniquely-identified LOFAR-resolved clock fundamental, (T2) is not resolved beyond one
 $24.4$
kHz fine bin at the EDA2 resolution, and (T3) is not solely driven by the three largest per-satellite ratios. These observations are compatible with, but do not select, several electronic-emission scenarios, including a payload-active, communications-active, or power-management regime, a switch-mode power-supply harmonic that activates with service pattern, or an intermodulation product between on-board oscillators not catalogued by Bassa et al. (Reference Bassa, Di Vruno, Winkel, Jozsa, Brentjens and Zhang2024) – and these constraints apply to the v2-Mini population as a whole rather than only to the DTC subset, since the
 $230.627$
MHz fine-channel feature is present in both the DTC and Ku-only subpopulations (Section 3.4). However, the present data cannot uniquely identify the emitting subsystem. A mechanism-level confirmation would require telemetry-correlated observation cadence or direct payload characterisation, neither of which is available in the public domain at present. The orthogonal eclipse-state evidence considered next (Section 3.6) provides an independent handle on the same question.
Cross-coarse-channel control for the feature in fine channel 22. The z-score is the deviation of the mean flux in fine channel 22 from the mean over the other 30 fine bins, in units of the inter-bin standard deviation. The
 $230.469$
MHz channel (red star) shows
 $z = +11.0$
, whereas five high-occupancy control channels (
 $150.78$
,
 $153.12$
,
 $161.72$
,
 $170.31$
, and
 $200.00$
MHz; blue circles) all lie within
 $\pm 1\sigma$
, arguing against a fixed same-index response across the tested controls.

3.6. Eclipse-state dependence
The pooled-population form of the eclipse-state comparison is tested first, in which the range-corrected flux density of all v2-Mini satellites is compared between illuminated and eclipsed states without regard to the payload variant. The pooled test returns an illuminated/eclipsed ratio of medians of
 $1.164\,[1.151,1.177]$
, formally rejecting the null of no dependence but by a small margin. Taken on its own, this result would suggest a weak positive correlation between illumination and UEMR, consistent with a solar-array-driven power-conditioning mechanism. As shown below, however, this pooled result is a pooling artefact of the unequal sub-population sizes combined with opposite-signed within-population trends, and its physical interpretation after sub-population separation is misleading.
When the same test is applied separately to the DTC and Ku-only comparison populations, the picture changes qualitatively. The Ku-only comparison population yields an illuminated/eclipsed ratio of
 $1.184\,[1.172, 1.197]$
(95% bootstrap confidence interval), consistent in direction with the pooled result and in the expected sense: illuminated Ku-only satellites emit more UEMR than eclipsed ones. The DTC population, by contrast, yields an illuminated/eclipsed ratio of
 $0.465\,[0.439, 0.492]$
(95% bootstrap confidence interval), corresponding to DTC the pooled detected-event sample being roughly
 $2.1\times$
brighter when eclipsed than when illuminated. The two population ratios have opposite signs, and their 95% satellite-cluster bootstrap intervals reported below are disjoint for this pooled estimator. Because the Ku-only comparison contributes an order of magnitude more detections than the DTC population, the Ku-only sign dominates the pooled median and masks the DTC reversal.
Figure 12 examines the robustness of the DTC eclipse-state reversal against the most obvious systematics. Panel (a) shows the distribution of per-satellite illuminated/eclipsed ratios for DTC satellites with at least five detections in each state. The distribution extends predominantly below unity; the solid vertical line in the panel marks the population ratio of medians,
 $0.47$
, which is the same summary statistic adopted in the primary test above and is not the same quantity as the median of the per-satellite ratios, which is closer to unity because individual satellites with modest detection counts scatter around the population trend. Panel (b) shows the ratio as a function of satellite altitude in bins of 56 km; the DTC reversal is preserved across the 300–412 km altitude range with non-trivial detection counts, while the Ku-only comparison ratio remains above unity in every altitude bin. The numerical content of the populated DTC altitude bins is summarised in Table 5.
Three mechanism-oriented observational checks for the
 $230.627$
MHz fine-channel feature reported in Section 3.4. (a) T1, harmonic-coincidence test: predicted frequencies
 $N \times f_0$
of all 14 fundamentals reported by Bassa et al. (Reference Bassa, Di Vruno, Winkel, Jozsa, Brentjens and Zhang2024) for v2-Mini Starlink satellites (top row) and a superset of 9 plausible crystal-oscillator candidates (bottom row), evaluated at the integer N minimising the residual relative to the target centroid
 $230.627441$
MHz; the shaded band is the
 $\pm 12.207$
kHz EDA2 half-fine-bin tolerance. Filled circles denote matches within tolerance and crosses denote non-matches. Five of the 14 Bassa fundamentals produce a match within tolerance, compared with
 $5.73$
expected by chance under the null hypothesis
 $\sum_i \min(1, 2\Delta f/f_{0,i})$
over the tested fundamentals. (b) T2, adjacent-bin coherence within the bright subset (top 5% by flux in fine channel 22,
 $N=127$
detections): the mean flux per fine bin is shown against the inter-bin baseline (shaded band,
 $\mu = 143.5$
Jy beam
 $^{-1}$
,
 $\sigma = 8.4$
Jy beam
 $^{-1}$
over the 28 bins excluding fine channels 21, 22, and 23). The point for fine channel 22 at
 $z=+25.4$
is off-scale relative to the inter-bin spread; fine channel 21 (
 $z=-1.26$
) and fine channel 23 (
 $z=-0.96$
) lie at or below baseline rather than above, showing no adjacent-bin elevation in this subset. (c) T3, distribution of per-satellite ratios
 $R_i = \overline{F_{22}} / \overline{F_\mathrm{other}}$
across the 82 v2-Mini satellites with
 $\ge 5$
detections at the
 $230.469$
MHz coarse channel. (d) Rank-ordered
 $R_i$
on a logarithmic axis; horizontal references mark the top-decile mean
 $R = 2.13$
and the bottom-half mean
 $R = 0.94$
.

Robustness of the DTC eclipse-state reversal. (a) Distribution of per-satellite illuminated/eclipsed ratios for DTC satellites with at least five detections in each state; the solid vertical line marks the population ratio of medians (the same statistic adopted in the primary test in the text), and the dashed line marks unity. (b) Illuminated/eclipsed ratio as a function of satellite altitude, for DTC (orange squares) and Ku-only (purple circles) populations. (c) Ratio as a function of sub-satellite latitude. (d) Ratio as a function of frequency, for DTC only. Channels with fewer than 30 illuminated or 30 eclipsed detections are omitted; in particular,
 $230.469$
MHz is absent because no eclipsed detections were recorded in this channel during the observing campaign. Error bars show 95% bootstrap confidence intervals; the horizontal line at unity marks the null hypothesis.

Panel (c) shows the same comparison as a function of sub-satellite latitude. The analysed sample is concentrated in a narrow latitude strip, but the DTC ratio remains below unity in every latitude bin, which argues against a geographic selection effect coupled to the day/night cycle through the local solar time. The bin centred at
 $-24.3^\circ$
contains the smallest number of eclipsed DTC detections (
 $N_\mathrm{ecl}=286$
, against 414–583 in the other bins) and is correspondingly the noisiest, with a ratio of approximately
 $0.85$
; the four other bins lie between
 $0.45$
and
 $0.55$
. Panel (d) shows the DTC ratio as a function of the coarse frequency channel; the reversal is preserved in the majority of channels where the sample size permits a measurement, although a small number of channels show ratios consistent with unity.
A complementary robustness check resamples at the satellite level rather than at the detection level: bootstrapping over the 175 DTC satellites with replacement and re-evaluating the population ratio of medians on each resample yields a 95% confidence interval of
 $[0.338, 0.627]$
, wider than the detection-level interval
 $[0.439, 0.492]$
as expected from the smaller effective sample size, but still entirely below unity. Table 6 summarises the eclipse-state ratios across all populations and sample variants considered in this section.
The stratified comparisons in Figure 12(b)–(d) are reported as descriptive robustness checks rather than independent hypothesis tests, and we do not apply additional multiple-comparisons control to them; the primary uncertainty summary is the 95% satellite-cluster bootstrap interval for each pooled eclipse ratio and their ratio of ratios.
A potential confound is that the DTC and Ku-only populations were deployed in different launch epochs, so the reversal could in principle reflect satellite age or commissioning state rather than the DTC payload. To test this, we restrict the Ku-only comparison to the 998 satellites whose launch dates fall within the 2024 January–October window spanned by the 175 DTC satellites, discarding the 625 earlier-launched Ku-only satellites that have no DTC counterpart. The eclipse-state ratio of the matched Ku-only sub-sample is
 $1.188\,[1.169, 1.209]$
, statistically indistinguishable from the full Ku-only ratio of
 $1.184\,[1.172, 1.197]$
, while the DTC ratio is unchanged at
 $0.465\,[0.438, 0.494]$
by construction. The two matched-sample confidence intervals remain disjoint. The unchanged matched Ku-only result argues against launch epoch as the sole explanation, although matching cannot remove every residual population-composition difference.
The reversal also survives a shared-systematics argument. The DTC and Ku-only populations are processed through identical EDA2 calibration, ephemeris, and flux-density pipelines. The opposite pooled trends are therefore difficult to attribute to a simple pipeline artefact common to both classes, but this argument does not remove differences in population composition, observing schedule, or detection selection.
The detection-level confidence intervals reported above treat individual detections as approximately independent, which is violated by the satellite/pass/frequency clustering of the EDA2 catalogue. A cluster-robust restatement resamples at the satellite level (
 $N_\mathrm{sat,\,DTC} = 175$
,
 $N_\mathrm{sat,\,Ku} = 1\,623$
), pools detections within each resample, and recomputes the illuminated/eclipsed median ratio. The cluster bootstrap yields a DTC ratio of
 $0.465\,[0.338, 0.627]$
and a Ku-only ratio of
 $1.184\,[1.115, 1.257]$
, both consistent in direction and central value with the detection-level estimates but with intervals widened to reflect the within-satellite correlation. A joint cluster bootstrap of the difference, drawing the DTC and Ku-only satellite samples independently, gives
 $(\mathrm{ratio}_\mathrm{DTC} - \mathrm{ratio}_\mathrm{Ku}) = -0.72\,[-0.87, -0.54]$
and a ratio of ratios of
 $0.39\,[0.28, 0.53]$
. These percentile intervals quantify uncertainty in the pooled detection-level estimator under satellite resampling; they are not a direct estimate of a universal within-satellite response. We use the cluster intervals as the primary uncertainty summary.
As a simple arithmetic illustration, combining the catalogue’s
 $75.5\%/24.5\%$
detected-event split with the pooled flux ratio gives a factor of approximately
 $1.28$
relative to an illuminated-only value. The catalogue does not contain the nondetection exposure needed to verify proportional sampling of the two states, so this number is neither a calibrated correction nor an operational prediction for SKA-Low.
The frequency-dependent decomposition in Figure 12(d) shows that the DTC reversal is not concentrated in any single channel. The reversal direction is preserved at the four highest-N channels in the sample (
 $150.78$
,
 $153.12$
,
 $161.72$
, and
 $170.31$
MHz), all of which lie within the LOFAR HBA window where Bassa et al. (Reference Bassa, Di Vruno, Winkel, Jozsa, Brentjens and Zhang2024) reported strong broadband v2-Mini UEMR. The reversal is therefore a population-level property of the DTC payload class across the dominant emission band of the catalogue, rather than a feature of a single anomalous channel; in particular, it is not driven by the
 $230.469$
MHz polarisation excess discussed in Section 3.2.
Per-altitude-bin DTC illuminated/eclipsed range-corrected median flux ratio, complementing Figure 12(b). Bins above 412 km contain fewer than five detections in each state and are omitted.

Table 5. Long description
A table comparing illuminated and eclipsed flux ratios across two altitude bins. The table has two rows and four columns. The columns are labeled Altitude bin (km), N illum, N eclips, and Illum/eclips ratio. The row labels are 300-356 and 356-412. Row 1: 300-356, 4998, 2076, 0.542. Row 2: 356-412, 2545, 117, 0.173.
Notes: Both populated bins yield a ratio well below unity, consistent with the population-level DTC reversal reported in Section 3.6. Bins above 412 km are sparsely populated in the present sample.
Illuminated/eclipsed range-corrected flux density ratios for the four populations and sample variants considered in Section 3.6. Confidence intervals are detection-level bootstrap with
 $B=2\,000$
resamplings unless otherwise noted.

Table 6. Long description
A table with six rows and five columns comparing illuminated and eclipsed range-corrected flux density ratios. The columns are labeled Population, N sat, illum / N sat, ecl, N det, illum / N det, ecl, and Illum/ecl ratio. The rows are labeled Pooled V2-Mini, Full DTC, Full Ku-only, Matched Ku-only, DTC, satellite-bootstrap, and Ku-only, satellite-bootstrap. Each row provides specific values for the different populations and sample variants. The table includes confidence intervals and notes on resampling methods.
Notes. Matched Ku-only restricts the comparison to the 998 Ku-only satellites launched within the 2024-01-03–2024-10-18 window spanned by the DTC sample; discarding the 625 earlier-launched Ku-only satellites. The satellite-bootstrap row resamples DTC satellites with replacement rather than detections, yielding a wider but still entirely sub-unity interval.
Summary of the ratio estimates reported in Section 3. The DTC/Ku point is the ratio of per-satellite median range-corrected flux densities, with a 95% bootstrap interval. The DTC and Ku-only illuminated/eclipsed ratios and their ratio of ratios use 95% satellite-cluster bootstrap intervals. The vertical line at unity denotes equal ratios.

A further internal consistency check examines the per-satellite distribution rather than the population aggregate. Among the 24 DTC satellites with at least five detections in each illumination state, the median per-satellite illuminated/eclipsed ratio is
 $0.886\,[0.441, 1.598]$
(95% cluster bootstrap,
 $N=24$
); the interquartile range (IQR)
 $[0.42, 1.62]$
is asymmetric about unity, with the lower quartile below unity by a larger margin than the upper quartile is above. Fourteen of the 24 satellites (58%) lie below unity and ten (42%) below
 $0.75$
. The per-satellite distribution is directionally similar to the detection-level reversal but the per-satellite cluster bootstrap interval crosses unity, reflecting the modest sample size of DTC satellites with reliable two-state coverage; the central value is several times closer to unity than the detection-level
 $0.465\,[0.439,0.492]$
estimate. The paired subset therefore does not independently establish a within-satellite illumination effect, and the pooled ratio should not be read as a universal per-satellite response.
Taken together, Figure 12(a)–(d) and the matched-launch test above show that the population-level DTC eclipse-state contrast persists descriptively under stratification by altitude, latitude, frequency, and launch epoch. The paired per-satellite subset is directionally similar but inconclusive, and its ratios show substantial scatter (
 $\mathrm{IQR}=[0.42, 1.62]$
for the 24 satellites with at least five detections in each illumination state). Figure 13 summarises the effect sizes and 95% confidence intervals for the comparisons reported in this section. The eclipse-state reversal is the only effect in which the DTC and Ku-only comparison populations depend on an external parameter with opposite signs.
4. Discussion and conclusions
We have reanalysed the Grigg et al. (Reference Grigg, Tingay and Sokolowski2025) Engineering Development Array version 2 event catalogue with the Direct-to-Cell payload variant separated from the Ku-only pre-Optical v2-Mini comparison, and we report three results. First, among catalogued detections, the DTC population has a per-satellite median range-corrected flux density that is
 $1.45\times$
that of the comparison, at a Mann–Whitney significance of
 $p = 4.1\times10^{-11}$
and a Cliff’s
 $\delta$
effect size of
 $+0.30$
. Second, the largest polarisation anomaly in the dataset occurs at
 $230.469$
MHz, where the XX fraction reaches
 $f_\mathrm{XX} = 0.81$
against a pooled v2-Mini baseline of
 $0.48$
. Third, the detected DTC event population is brighter in the Earth’s shadow than in sunlight, with an illuminated/eclipsed range-corrected flux density ratio of
 $0.47$
, whereas the Ku-only comparison population shows the opposite sense with a ratio of
 $1.18$
. The remainder of this section examines candidate physical explanations for the eclipse-state dependence and compares the DTC per-satellite excess with the earlier generation-over-generation regression reported by Bassa et al. (Reference Bassa, Di Vruno, Winkel, Jozsa, Brentjens and Zhang2024).
4.1. Mechanism candidates for the eclipse-state reversal
At the population level, the opposite illumination trends disfavour a simple mechanism in which the dominant UEMR amplitude is a common bus-level component that increases monotonically with the instantaneous solar photocurrent delivered by the photovoltaic array. In such a picture the emission should be largest when the array is in direct sunlight, and two populations sharing the same bus-level photovoltaic and maximum-power-point tracking hardware should exhibit illumination dependence with the same sign. The observed illumination dependence has opposite signs, with the DTC ratio (
 $0.47$
) well below unity and the Ku-only comparison ratio (
 $1.18$
) above unity. A model in which a state-independent DTC-specific contribution is simply added on top of a common photocurrent-driven term can attenuate the illuminated/eclipsed ratio but, by linearity, cannot reverse its sign, and is therefore disfavoured as a description of the DTC population at the level of state-independent additive components. This argument constrains only the bus-level photocurrent drive; it does not exclude more elaborate pictures in which a DTC-specific power-conditioning stage responds differently to an array-sourced versus a battery-sourced input, provided that the net response still produces a colder-is-louder signature in the DTC population.
Passive thermal re-radiation from a satellite body at a temperature modulated by direct solar heating can be excluded on two independent grounds. First, the Rayleigh–Jeans flux density of a warm body at metre wavelengths is many orders of magnitude below the observed levels. Adopting generous values
 $A\sim10^{2}$
m
 $^{2}$
(bus plus deployed solar array),
 $\epsilon\sim0.3$
at metre wavelengths, and equilibrium temperature
 $T\sim300$
K at a range of
 $1\,000$
km,
 \[ S_\mathrm{thermal} \;\sim\; \frac{2\,\epsilon\,k_\mathrm{B}\,T\,A}{\lambda^{2}\,r^{2}} \;\sim\; 10^{-5}\,\mathrm{Jy},\]
where the estimate is evaluated at the upper end of the EDA2 band (
 $230.469$
MHz,
 $\lambda\approx1.3$
m), at which
 $S_\mathrm{thermal}$
is largest. This lies roughly six orders of magnitude below the
 $\sim$
10 Jy lower envelope of v2-Mini detections in this band, and roughly seven orders below the
 $\sim$
100 Jy upper envelope; at the lower end of the band (
 $72.685$
MHz) the corresponding gaps are larger by an additional order of magnitude because
 $S_\mathrm{thermal}\propto \lambda^{-2}$
. More conservative emissivity, area, or temperature assumptions widen these gaps by a further factor of a few. Passive thermal emission is therefore negligible as an absolute contribution at all frequencies in the EDA2 band. Second, the spacecraft’s equilibrium temperature is lower when eclipsed than when illuminated, and a Planck continuum scales monotonically with temperature, so a thermally driven continuum would be brighter in the illuminated state in both populations. Since v2-Mini and DTC satellites share the same bus structure and thermal surface treatment, a population-dependent sign of the illumination correlation also disfavours passive thermal re-radiation as the mechanism for the DTC excess.
A model consistent with the observed reversal is one in which the UEMR amplitude is set by an active on-board electronic source whose effective duty cycle is larger in the eclipsed state than in the illuminated state. Three illustrative classes of such a source are listed below, not as an adjudicated shortlist but as parameterisations of a ‘colder-is-louder’ constraint against which future mechanism proposals can be tested. A first illustrative class is the payload thermal-control loop. LEO spacecraft typically maintain their internal electronics within tight operating temperature ranges by active heating during eclipse (Gilmore Reference Gilmore2002), and the associated heater elements draw additional current precisely when solar heating ceases. The DTC payload, with its extra radio-frequency front-end hardware, would qualitatively be expected to have a larger internal thermal mass to maintain than the Ku-only v2-Mini comparison, and a correspondingly larger heater duty cycle in eclipse, although neither expectation is verified here without spacecraft telemetry. A second class is the battery discharge cycle, which is active only during eclipse. While the spacecraft is illuminated, the power-management unit draws directly from the photovoltaic array, but in eclipse the same unit draws from the battery pack through a DC–DC converter whose switching-mode noise spectrum and conducted-emission profile can differ substantially from the sunlit case. A third class is the operational duty cycle of the DTC payload itself. Cellular payloads may be preferentially exercised during eclipse for reasons of thermal budget, handover testing, or battery-charge management, any of which would increase the payload’s time-averaged power draw and the associated switching-noise emission during the eclipsed fraction of the orbit. The present dataset does not discriminate among these illustrative classes, and a specific engineering identification is beyond the scope of a catalogue-level reanalysis. Any model of the pooled catalogue must reproduce an eclipsed-to-illuminated contrast of approximately
 $2.15$
for the DTC detections, whereas the opposite trend is required for the Ku-only comparison population. The narrowband fine-channel excess at
 $\approx$
 $230.627$
MHz reported in Section 3.4 additionally favours an intermittent electronic source (clock, switch-mode product, or intermodulation) over a smooth photocurrent-scaling continuum, but cannot be linked directly to the eclipse reversal because the
 $230.469$
MHz coarse channel was not observed in eclipse in the Grigg et al. (Reference Grigg, Tingay and Sokolowski2025) campaign. The three mechanism-oriented checks in Section 3.5 provide narrower observational statements: T1 finds no unique association with the LOFAR-resolved Bassa et al. (Reference Bassa, Di Vruno, Winkel, Jozsa, Brentjens and Zhang2024) clock fundamentals; T2 finds no adjacent-bin elevation at EDA2 resolution; and T3 shows that the feature is not solely produced by the three largest per-satellite ratios. These checks do not identify an operational state or emitting subsystem.
4.2 The
$230.469$
MHz polarisation anomaly

The
 $230.469$
MHz coarse channel warrants separate consideration. It shows the largest polarisation anomaly in the dataset, with an XX fraction of
 $0.81$
against a
 $0.48$
baseline and an event-level binomial significance of
 $p \sim 10^{-274}$
, and it lies neither inside a protected Radio Astronomy Service band nor within any published Starlink service band. The polarisation excess persists in per-satellite sub-sampling (Figure 8), shows no dependence on observing elevation, and is present in both the DTC and Ku-only populations, with the DTC population showing the larger deviation. These properties are consistent with a localised on-board emitter, such as a digital clock harmonic or a narrow-band switching product of an on-board converter (Paul Reference Paul1992), whose radiation couples preferentially into one polarisation of the EDA2 dipole through the spacecraft geometry. SpaceX has not published a detailed frequency-assignment plan for the v2-Mini or DTC subsystems, and a specific identification of the responsible source is beyond the scope of this dataset. The present count-level XX asymmetry is consistent with, and complementary to, the per-pass XX/YY flux anti-correlation already reported for the same dataset (Grigg et al. Reference Grigg, Tingay and Sokolowski2025). The latter operates at the per-pass, per-epoch level and characterises the oscillation between the two feeds within a single transit; the present statistic operates at the catalogue-aggregated, per-satellite level and characterises the integrated asymmetry in which feed is more likely to cross the detection threshold after stacking. A modulated source whose instantaneous power oscillates between two orthogonal feeds can leave a residual count-level asymmetry of the kind reported here if the oscillation is not perfectly balanced or if the stacking window couples unevenly to the modulation phase. The two observations therefore probe the same underlying physical emission along different statistical axes. Taken together, they are consistent with a geometry-coupled contribution at
 $230.469$
MHz, but do not locate the emitting subsystem. Independent of the mechanism, the
 $230.469$
MHz polarisation excess provides a narrow-band observational target for future UEMR mitigation and for correlated measurements from other SKA-Low and LOFAR stations. The sub-MHz inspection in Section 3.4 further localises this narrow-band target to a single fine-channel index near
 $230.627$
MHz, with a tail-driven flux excess that survives a cross-coarse-channel control and is not resolved beyond one fine bin at the EDA2
 $\sim 24$
kHz resolution. The checks in Section 3.5 find no adjacent-bin elevation and show that the three largest per-satellite ratios are not the sole source of the feature. Independent confirmation in higher-resolution observations (such as LOFAR HBA channelised at
 $\sim$
kHz resolution, or NenuFAR with its higher spectral resolution at the same band) is required to resolve the feature further and to test candidate interpretations against spacecraft operational telemetry.
4.3. Comparison with other UEMR detection efforts
This work joins a growing observational programme to characterise satellite UEMR at low frequencies. The first systematic detection of broadband Starlink emission was reported by Di Vruno et al. (Reference Di Vruno, Winkel, Bassa, Józsa, Brentjens, Jessner and Garrington2023) using LOFAR in the 110–188 MHz HBA band, where narrowband emission at 125, 135,
 $143.05$
, 150, and 175 MHz and underlying broadband structure was identified across the v1.0 and v1.5 populations. Grigg et al. (Reference Grigg, Tingay, Sokolowski, Wayth, Indermuehle and Prabu2023) independently confirmed satellite UEMR at EDA2 with an at-source methodology. Zhang et al. (Reference Zhang2025) extended the LOFAR programme downward to 50–80 MHz with NenuFAR and reported broadband polarised emission, with generation-over-generation behaviour consistent with the Bassa et al. (Reference Bassa, Di Vruno, Winkel, Jozsa, Brentjens and Zhang2024) report. The Grigg et al. (Reference Grigg, Tingay and Sokolowski2025) catalogue from which the present dataset is drawn provides the widest single-station frequency coverage to date (
 $72.685$
–
 $234.375$
MHz) and a continuous monitoring window of several months. The present reanalysis differs from all prior work in separating the v2-Mini DTC payload variant from the Ku-only v2-Mini comparison and in analysing illumination-state behaviour and per-channel polarisation simultaneously, on a sample of 175 DTC and
 $1\,623$
Ku-only satellites.
The per-satellite excess we report (
 $1.45\times$
) complements the factor of 32 excess reported by Bassa et al. (Reference Bassa, Di Vruno, Winkel, Jozsa, Brentjens and Zhang2024) between the v2-Mini population as a whole and the earlier v1.0 and v1.5 satellites. A direct multiplicative composition of the two factors is not straightforward. Bassa et al. (Reference Bassa, Di Vruno, Winkel, Jozsa, Brentjens and Zhang2024) used LOFAR LBA and HBA observations with a different frequency coverage and adopted a different statistical reduction from ours, in particular relying on a small DTC-containing subset within a v1.0/v1.5-dominated sample rather than a comparably sized Ku-only v2-Mini comparator, so the two ratios are not measured on the same estimand. A fully consistent re-measurement of the generation regression using the Grigg et al. (Reference Grigg, Tingay and Sokolowski2025) release and the per-satellite reduction of Section 3.1 is left to future work. The two factors should therefore not be multiplied. The
 $1.45$
ratio is a within-v2-Mini EDA2 estimand, and its relation to the factor reported by Bassa et al. (Reference Bassa, Di Vruno, Winkel, Jozsa, Brentjens and Zhang2024) is not determined by the available data. The associated illumination contrast motivates treating the DTC subclass separately in future measurements, but does not by itself identify a distinct physical component. The Bassa et al. (Reference Bassa, Di Vruno, Winkel, Jozsa, Brentjens and Zhang2024) sample did not contain sufficient DTC satellites to perform the per-bus separation enabled by the present reanalysis.
4.4. Operational implications for SKA-Low
At the time of writing, DTC satellites constitute a rapidly growing fraction of the operational v2-Mini fleet, with additional launches continuing into 2026. If the population-level contrasts reported here persist in exposure-controlled follow-up, UEMR forecasts may benefit from treating payload class and illumination state explicitly. The present event catalogue does not provide the nondetection exposure required to quantify a sky-averaged contribution or prescribe a mitigation correction.
The findings reported in this paper are observational constraints on a complex engineering system. The Centre for the Protection of the Dark and Quiet Sky from Satellite Constellation Interference, established by the International Astronomical Union, supports ongoing dialogue between astronomers and satellite operators. SpaceX has previously collaborated with the astronomy community to reduce the optical impact of Starlink satellites through design and operational modifications (Tregloan-Reed et al. Reference Tregloan-Reed, Otarola, Ortiz, Molina, Anais, González, Colque and Unda-Sanzana2020; Tyson et al. Reference Tyson2020), and has stated its intention to apply similar mitigation to UEMR. Our results identify the Direct-to-Cell subclass, illumination state, and the
 $230.469$
MHz coarse channel as separate targets for follow-up characterisation. The catalogue does not establish which target would yield the largest operational benefit.
The per-payload-variant characterisation reported here provides a quantitative basis for the recommendations summarised in the IAU Dark and Quiet Skies reports (Reference WalkerWalker et al. 2020b ;Reference Walker a ), and aligns with the call in Barentine et al. (Reference Barentine, Venkatesan, Heim, Lowenthal, Kocifaj and Bará2023) for engagement between radio observatories and operators of large constellations. The illumination-state contrast motivates future measurements with explicit exposure in both illuminated and eclipsed states.
4.5. Limitations and future work
Several limitations should be noted. The event catalogue contains detections but not the corresponding nondetection exposure. The illumination ratios are therefore population-level, detection- conditioned summaries. Only 24 DTC satellites meet the paired two-state threshold, and their per-satellite interval crosses unity; the data do not establish a universal within-satellite illumination response. The fine-channel feature isolated in Section 3.4 is a single-bin (
 $\sim$
24 kHz wide) phenomenon observed at a single station and under one calibration pipeline, and an independent confirmation in higher spectral resolution and at a second station is required. The mechanism-discrimination tests in Section 3.5 share this limitation and add two specific ones of their own: the per-satellite ratio analysis in T3 is restricted to the 82 v2-Mini satellites with
 $\ge$
5 detections at the
 $230.469$
MHz coarse channel, so its discrimination power against narrowly bimodal alternatives is bounded by the modest per-satellite sample, and the harmonic-coincidence test T1 treats clock fundamentals as discrete candidates rather than exhaustively scanning the parameter space of plausible on-board references; a population of internal references not characterised by Bassa et al. (Reference Bassa, Di Vruno, Winkel, Jozsa, Brentjens and Zhang2024) could still produce coincidences inside the EDA2 fine bin without being detected here. The cylindrical shadow classifier does not exclude detections near the terminator, where ingress/egress mislabelling is most likely; a terminator-buffer sensitivity test would further strengthen the eclipse-state result. The
 $230.469$
MHz coarse channel was observed only during local daylight windows during the Grigg et al. (Reference Grigg, Tingay and Sokolowski2025) campaign, so the illumination dependence cannot be tested at this specific frequency. As a consequence, the polarisation anomaly at
 $230.469$
MHz and the eclipse-state reversal are independent diagnostics in the present dataset; a future EDA2 or SKA-Low campaign with night-time
 $230.469$
MHz coverage is required to test whether the two effects co-vary, which would more sharply constrain the underlying mechanism.
Beyond the channel-coverage caveat above, four additional limitations frame the scope of the reported findings. First, the temporal coverage of the Grigg et al. (Reference Grigg, Tingay and Sokolowski2025) campaign (UTC 2024 June–October) does not permit annual or solar-cycle variability in the eclipse-state effect to be tested. Second, the EDA2 is a single station; without an independent interferometric or imaging telescope at the same epoch, the per-detection astrometric confidence cannot be cross-validated, and the exact residual association error cannot be estimated from the public catalogue. Third, the EDA2 frequency window (
 $72.685$
–
 $234.375$
MHz) does not cover the ultra-high-frequency (UHF) and L-band service channels where the DTC payload’s intended emission is concentrated, so this work constrains only the low-frequency UEMR contribution within the EDA2 observing band. Fourth, all mechanism interpretations in Section 4.1 are based on morphological reasoning about timescales and signed correlations, and cannot be confirmed without spacecraft telemetry from the operator.
Closing each of these limitations requires a specific follow-up programme. The temporal-coverage limitation would be addressed by extending EDA2 or SKA-Low monitoring to a multi-year cadence, in particular spanning a solar minimum. The single-station limitation would be addressed by an interferometric confirmation campaign at MWA, LOFAR, or SKA-Low itself, coordinated with EDA2 so that the same satellite passes are observed simultaneously. The frequency-coverage limitation would be addressed by a coordinated multi-band programme combining the EDA2 catalogue with UHF and L-band measurements of the same satellites during the same epochs. The mechanism limitation can only be addressed through cooperation with the operator on telemetry sharing during dedicated monitoring intervals.
In summary, our reanalysis of the Grigg et al. (Reference Grigg, Tingay and Sokolowski2025) EDA2 event catalogue with the Direct-to-Cell payload variant separated from the Ku-only pre-Optical v2-Mini comparison yields the following findings:
-
1. Among catalogued detections, the Direct-to-Cell population has a range-corrected flux density that is, on the per-satellite median,
$1.45\times$
$[1.27, 1.67]$
that of the Ku-only comparison (
$p = 4.1\times10^{-11}$
; Cliff’s
$\delta = +0.30$
). -
2. The largest polarisation anomaly in the 72–234 MHz EDA2 sample occurs at
$230.469$
MHz, where the XX detection fraction reaches
$0.81$
against a pooled v2-Mini baseline of
$0.48$
(event-level
$p \sim 10^{-274}$
). A satellite-cluster-robust sensitivity check retains this
$+0.338$
deviation (cluster standard error
$0.025$
;
$p=2.3\times10^{-40}$
;
$N=84$
satellites). A sub-MHz fine-channel inspection further localises the
$230.469$
MHz excess to a single
$\sim$
24 kHz bin near
$230.627$
MHz, driven by the bright tail of the flux distribution and absent at five control coarse channels. -
3. Three mechanism-oriented checks (Section 3.5) on the
$230.627$
MHz feature show: (T1) no unique coincidence with any of the 14 clock fundamentals resolved by Bassa et al. (Reference Bassa, Di Vruno, Winkel, Jozsa, Brentjens and Zhang2024) (5 matches in
$\pm 12.2$
kHz tolerance vs
$5.73$
expected by chance), so the feature is not tied to a LOFAR-resolved clock harmonic; (T2) no leakage into adjacent fine bins (
$z_{21} = -1.26$
,
$z_{23} = -0.96$
vs
$+25.4$
in fine channel 22), with the feature not resolved beyond one
$24.4$
kHz EDA2 fine bin; and (T3) the per-satellite ratio
$R_i = \overline{F_{22}} / \overline{F_\mathrm{other}}$
distribution (median
$1.07$
,
$p_{95} = 1.79$
, max
$3.75$
) shows that the feature remains after excluding the three satellites with
$R_i\gt2$
; the observed spread does not identify its cause. -
4. The detected Direct-to-Cell event population is brighter in eclipse than in sunlight (illuminated/eclipsed ratio of
$0.47$
), whereas the Ku-only comparison population shows the opposite sense (ratio
$1.18$
). The reversal is preserved across satellite altitude, sub-satellite latitude, and frequency. The paired 24-satellite subset is directionally similar but inconclusive. -
5. At the population level, the opposite trends disfavour a simple mechanism in which the dominant UEMR amplitude is a common bus-level component that increases monotonically with the instantaneous solar photocurrent, and are compatible with an active on-board contribution whose detected flux changes between illumination states. Identifying the subsystem, separating operational duty cycle from population composition, and relating the present ratio to generation-scale estimates require exposure-controlled observations and spacecraft telemetry.








Acknowledgements
We pay our respects to the traditional custodians of Inyarrimanha Ilgari Bundara, the Wajarri Yamatji people, on whose Country the EDA2 observations reanalysed in this work were conducted. We thank D. Grigg and collaborators for the public release of the EDA2 event catalogue on Zenodo, which made this reanalysis possible, and J. McDowell for maintaining the General Catalogue of Artificial Space Objects. We acknowledge the ongoing work of the International Astronomical Union’s Centre for the Protection of the Dark and Quiet Sky from Satellite Constellation Interference, and the constructive engagement of SpaceX with the radio astronomy community on UEMR characterisation. This research made use of numpy (Harris et al. Reference Harris2020), scipy (Virtanen et al. Reference Virtanen2020), pandas (McKinney Reference McKinney, van der Walt and Millman2010), matplotlib (Hunter Reference Hunter2007), and astropy (Collaboration et al. Reference Collaboration2022).
Data availability statement
This work is based on the public EDA2 detection catalogue released with Grigg et al. (Reference Grigg, Tingay and Sokolowski2025), archived at Zenodo under 10.5281/zenodo.15089853. The McDowell General Catalogue of Artificial Space Objects (McDowell Reference McDowell2020) used for the Direct-to-Cell/Ku classification is maintained at https://planet4589.org/space/gcat/. The derived per-satellite, per-population, and per-channel summary tables underlying Figures 1–13, together with the reduction scripts, are available at Zenodo under 10.5281/zenodo.21902380.
Author contributions
Haofan Dong (HD) conceived the study, performed the data reanalysis, designed the three mechanism-discrimination tests, and drafted the manuscript. Houtianfu Wang (HTW) contributed to the statistical methodology and to the fine-channel analysis. Hanlin Cai (HLC) contributed to the mechanism-discrimination test design and to the figure preparation. Ozgur B. Akan (OBA) supervised the project and revised the manuscript. All authors approved the final version.
Funding statement
This research received no specific grant from any funding agency, commercial, or not-for-profit sectors. HD acknowledges PhD studentship support from the United Kingdom (UK) Engineering and Physical Sciences Research Council Centre for Doctoral Training in Connected Electronic and Photonic Systems and from Wolfson College, University of Cambridge.
Competing interests
The authors declare none.
Appendix A. Statistical test definitions
This appendix gathers the definitions of the statistical tests referenced in Sections 2.5 and 3.
Mann–Whitney U and Cliff’s
 $\delta$
Let
 $\{x_i\}_{i=1}^{n_x}$
and
 $\{y_j\}_{j=1}^{n_y}$
denote the per-satellite median range-corrected flux densities of the DTC and Ku-only comparison populations. The Mann–Whitney U statistic (Mann & Whitney Reference Mann and Whitney1947) is A
 \begin{equation} U = \sum_{i=1}^{n_x} \sum_{j=1}^{n_y} \mathbf{1}[x_i \gt y_j] + \tfrac{1}{2}\,\mathbf{1}[x_i = y_j], \end{equation}
and the two-sided p-value is computed under the null hypothesis using the exact distribution of U for
 $n_x,n_y\leq 20$
and the asymptotic normal approximation otherwise. Cliff’s
 $\delta$
(Cliff Reference Cliff1993),
 \begin{equation} \delta = \bigl[\,\#\{(i,j)\,:\,x_i \gt y_j\} - \#\{(i,j)\,:\,x_i \lt y_j\}\,\bigr] \,/\,(n_x n_y), \end{equation}
is a scale- and rank-invariant effect size in
 $[-1,+1]$
with
 $\delta=0$
under the null.
Bootstrap confidence interval for the median ratio
For the ratio of medians
 $r=\mathrm{median}(\{x_i\})/\mathrm{median}(\{y_j\})$
,
 $B=2\,000$
independent bootstrap samples
 $\{x_i^{(b)}\}$
and
 $\{y_j^{(b)}\}$
of sizes
 $n_x$
and
 $n_y$
are drawn with replacement, and
 $r^{(b)}$
is computed for each. The two-sided 95% interval is taken as the
 $2.5$
and
 $97.5$
percentiles of the bootstrap distribution of
 $r^{(b)}$
(Efron & Tibshirani Reference Efron and Tibshirani1993).
Cluster bootstrap for pooled eclipse-state ratios
For the eclipse-state analysis of Section 3.6, detections are not independent because the catalogue contains many detections per satellite. To produce cluster-robust confidence intervals, the resampling unit is changed from the individual detection to the satellite. For each population (DTC or Ku-only) and each of
 $B=2\,000$
bootstrap replicates, the observed number of satellite identifiers is drawn with replacement. All detections from every selected satellite are concatenated with the corresponding sampling multiplicity, and the pooled illuminated/eclipsed median ratio is recomputed; the
 $2.5$
and
 $97.5$
percentiles of the resulting bootstrap distribution define the 95% cluster interval. DTC and Ku-only satellite samples are also drawn independently on each iteration; percentile intervals are reported for the difference and ratio of the two pooled ratios. We do not interpret the un-centred bootstrap distribution as a null distribution for a hypothesis-test p-value.
Binomial test per coarse channel with BH-FDR control
Let
 $n_c$
and
 $k_c$
be the total number of detections and the number of XX detections in coarse channel c. Under the null that
 $k_c\sim\mathrm{Binomial}(n_c,p_0)$
with
 $p_0=0.4809$
taken as the pooled-sample XX fraction across the v2-Mini detections, a two-sided binomial test yields per-channel p-values
 $\{p_c\}_{c=1}^{21}$
. These are controlled for multiple comparisons by the Benjamini–Hochberg procedure (Benjamini & Hochberg Reference Benjamini and Hochberg1995) at
 $q=0.05$
: after sorting as
 $p_{(1)}\leq\cdots\leq p_{(21)}$
, channels with rank k satisfying
 $p_{(k)}\leq k q/21$
are declared significant.
Wilson score interval
For the per-channel XX fraction
 $\hat p = k_c/n_c$
, the Wilson score interval (Wilson Reference Wilson1927), which provides better coverage than the normal approximation for
 $\hat p$
far from
 $0.5$
, is
 \begin{equation} \mathrm{CI}_\mathrm{Wilson}(\hat p) = \frac{\hat p + z^{2}/(2n)}{1 + z^{2}/n} \;\pm\; \frac{z}{1 + z^{2}/n} \sqrt{\frac{\hat p(1-\hat p)}{n} + \frac{z^{2}}{4 n^{2}}}, \end{equation}
with
 $z=1.96$
and
 $n=n_c$
.
Appendix B. Illumination geometry
This appendix gathers the coordinate transformations and the cylindrical shadow test used in Section 2.4 to label each detection as illuminated or eclipsed. The implementation follows Seidelmann (Reference Seidelmann1992) for the solar ephemeris and standard geodetic conventions for the Earth-centred Earth-fixed (ECEF) frame.
Topocentric-to-ECEF transformation
The east–north–up (ENU) components of the line of sight at EDA2 are B
 \begin{equation} (e,n,u)_\mathrm{ENU} = r_\mathrm{sat}\, (\cos E\sin A,\;\cos E\cos A,\;\sin E), \end{equation}
where A and E are the topocentric azimuth and elevation reported by Grigg et al. (Reference Grigg, Tingay and Sokolowski2025) and
 $r_\mathrm{sat}$
is the line-of-sight range. The rotation from the local ENU frame at
 $(\varphi_\mathrm{obs},\lambda_\mathrm{obs})=$
 $(\!-26.7039^\circ,116.6707^\circ)$
to ECEF is
 \begin{align} &R_\mathrm{ENU\to ECEF} = \begin{pmatrix} -\sin\lambda_\mathrm{obs} & -\sin\varphi_\mathrm{obs}\cos\lambda_\mathrm{obs} & \cos\varphi_\mathrm{obs}\cos\lambda_\mathrm{obs} \\[0.5pt] \cos\lambda_\mathrm{obs} & -\sin\varphi_\mathrm{obs}\sin\lambda_\mathrm{obs} & \cos\varphi_\mathrm{obs}\sin\lambda_\mathrm{obs} \\[0.5pt] 0 & \cos\varphi_\mathrm{obs} & \sin\varphi_\mathrm{obs} \end{pmatrix},\nonumber \\[5pt]& \end{align}
and the station ECEF position
 $\mathbf{r}_\mathrm{obs}$
is obtained from the geodetic coordinates under the World Geodetic System 1984 (WGS-84) (
 $a=6378137$
m,
 $f=1/298.257223563$
). The satellite ECEF position is then
 $\mathbf{r}_\mathrm{sat,ECEF}=R_\mathrm{ENU\to ECEF}(e,n,u)^\mathrm{T}+\mathbf{r}_\mathrm{obs}$
, from which the sub-satellite latitude, longitude, and altitude are obtained by the standard geodetic inverse transformation.
Solar position and cylindrical shadow test
The apparent solar position in the Earth-centred inertial (ECI) frame is computed from the low-precision IAU formulas of Seidelmann (Reference Seidelmann1992, Section 3.4.2), and rotated to ECEF by a single rotation about the Earth spin axis through the Greenwich Mean Sidereal Time at the detection epoch (Seidelmann Reference Seidelmann1992, Section 2.24). Let
 $\hat{\mathbf{s}}=\mathbf{r}_{\odot,\rm ECEF}/\|\mathbf{r}_{\odot,\rm ECEF}\|$
be the Sun unit vector, and define
 $p_\parallel=\mathbf{r}_\mathrm{sat,ECEF}\cdot\hat{\mathbf{s}}$
and
 $p_\perp=\|\mathbf{r}_\mathrm{sat,ECEF}-p_\parallel\hat{\mathbf{s}}\|$
. The satellite is declared illuminated if
 \begin{equation} p_\parallel\gt0 \quad\text{or}\quad p_\perp\gt R_\oplus, \end{equation}
with
 $R_\oplus=6\,378.137$
km. This standard cylindrical shadow approximation is appropriate for the 300–580 km altitude range of the v2-Mini population and neglects atmospheric refraction and the width of the penumbra. A terminator-buffer sensitivity analysis would be needed to quantify the resulting classification uncertainty in this catalogue.
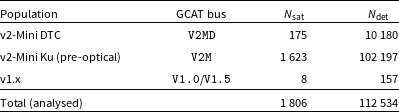

 1798
 1000

 log10

 230.469
 Snorm

 ∝r−2
 15000
 102197

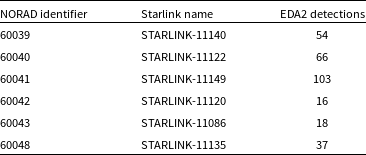
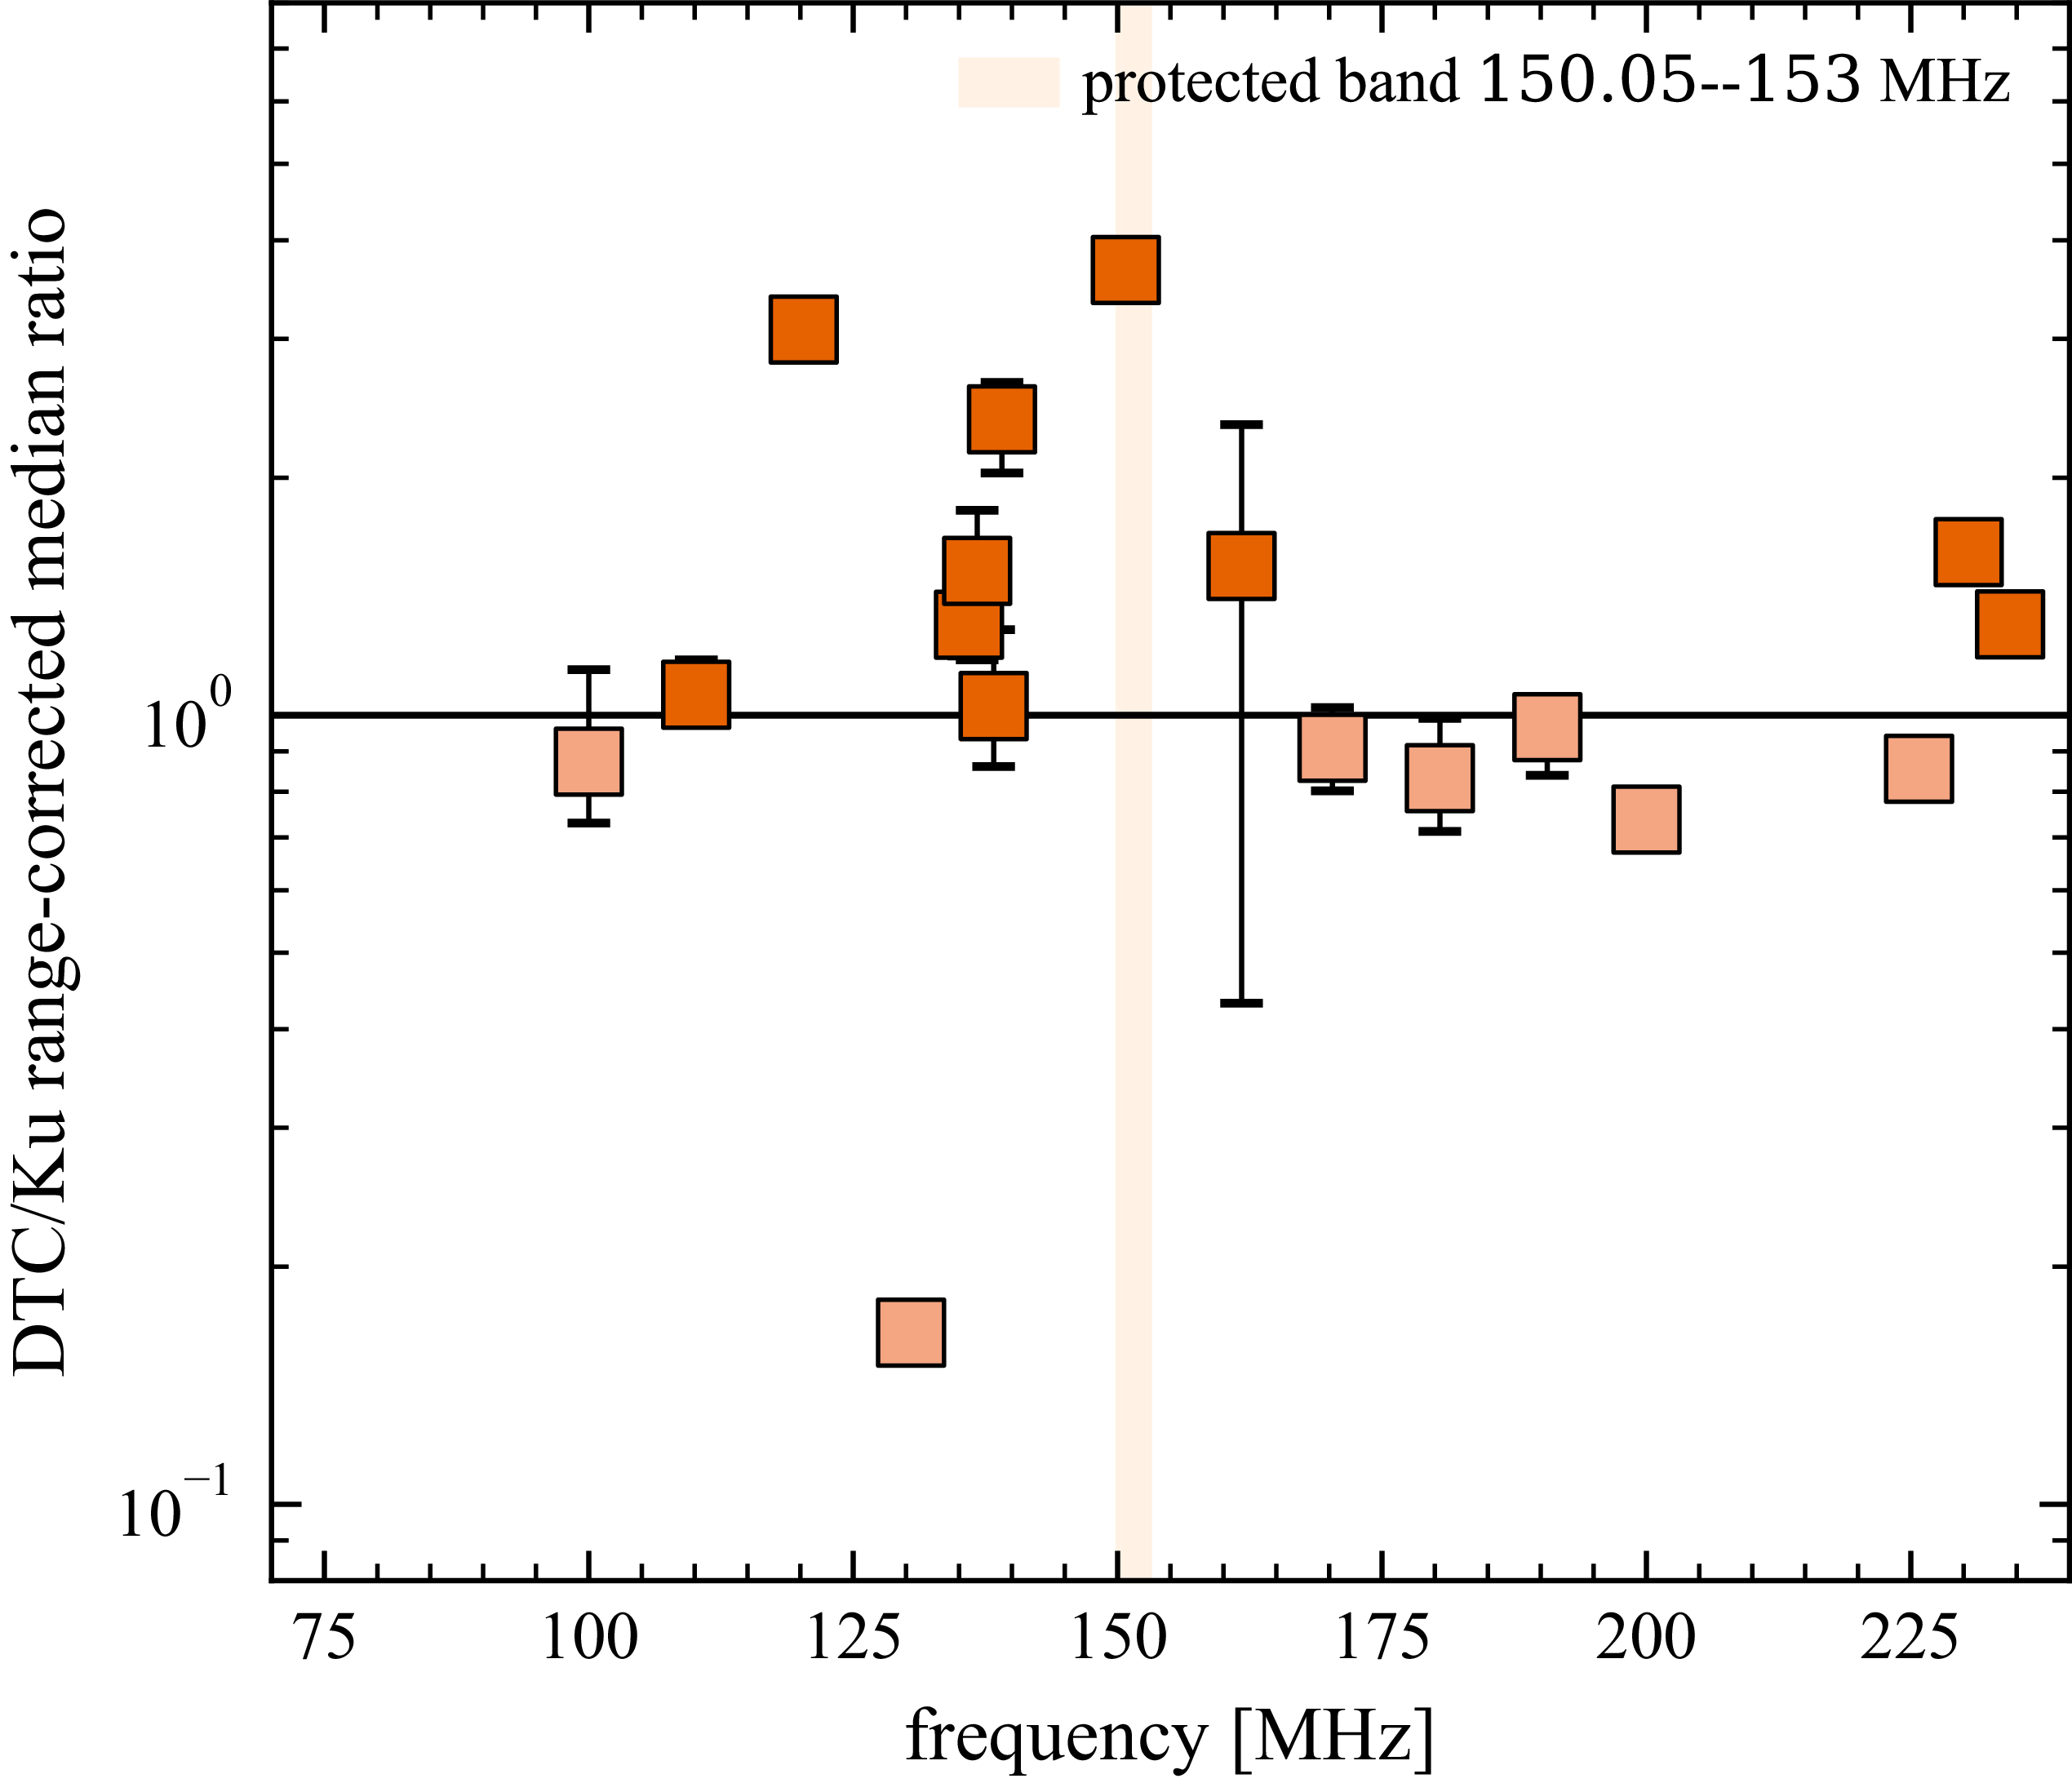
 130.469
 ≈
 0.16
 150.05
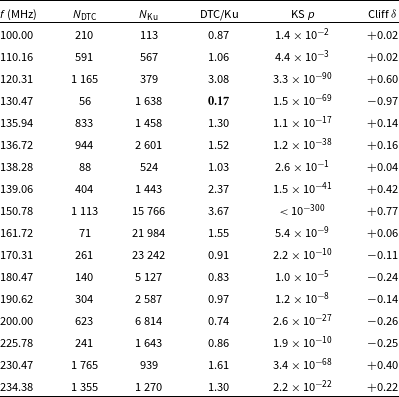
 NDTC∈{0,0,0,16}
 10164
 10180−16=10164
 10180
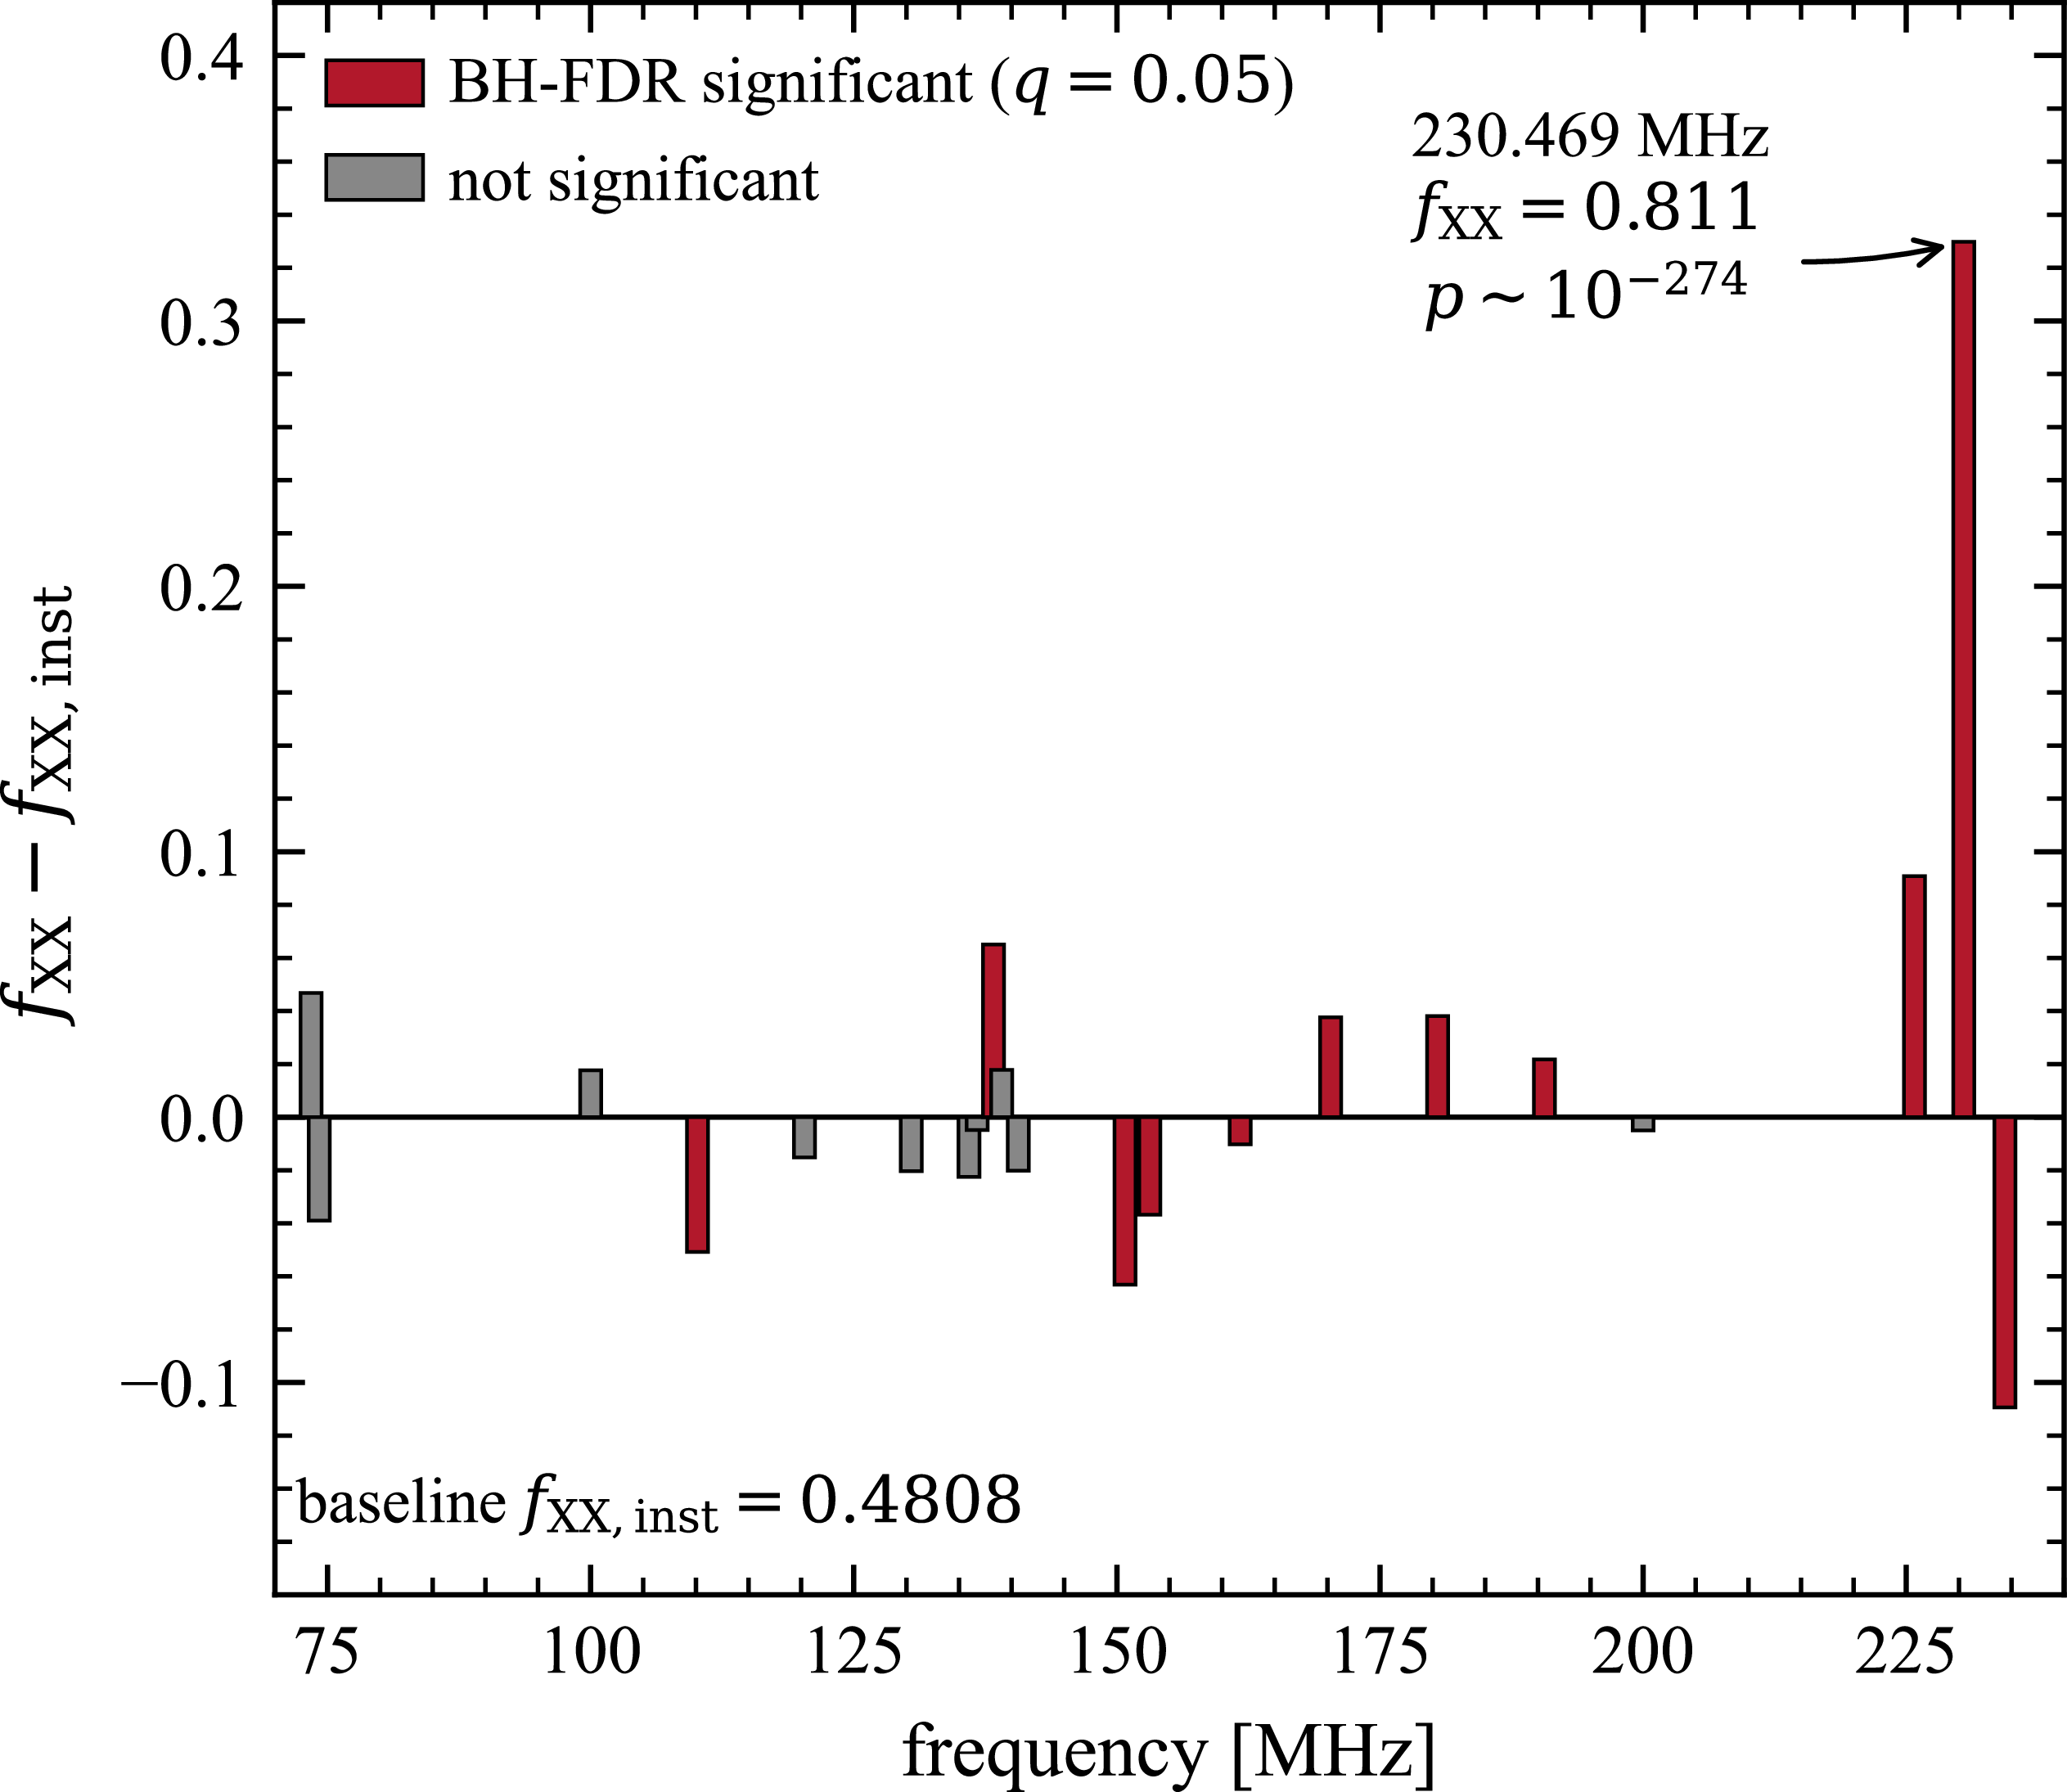
 fXX,inst
 q=0.05
 230.469

 230.469
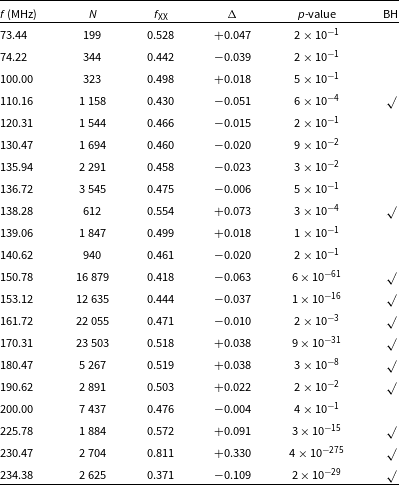
 fXX,inst=0.4809
 q=0.05
 230.469

 230.469
 N=80894
 p^=0.810
 ≈
 230.627
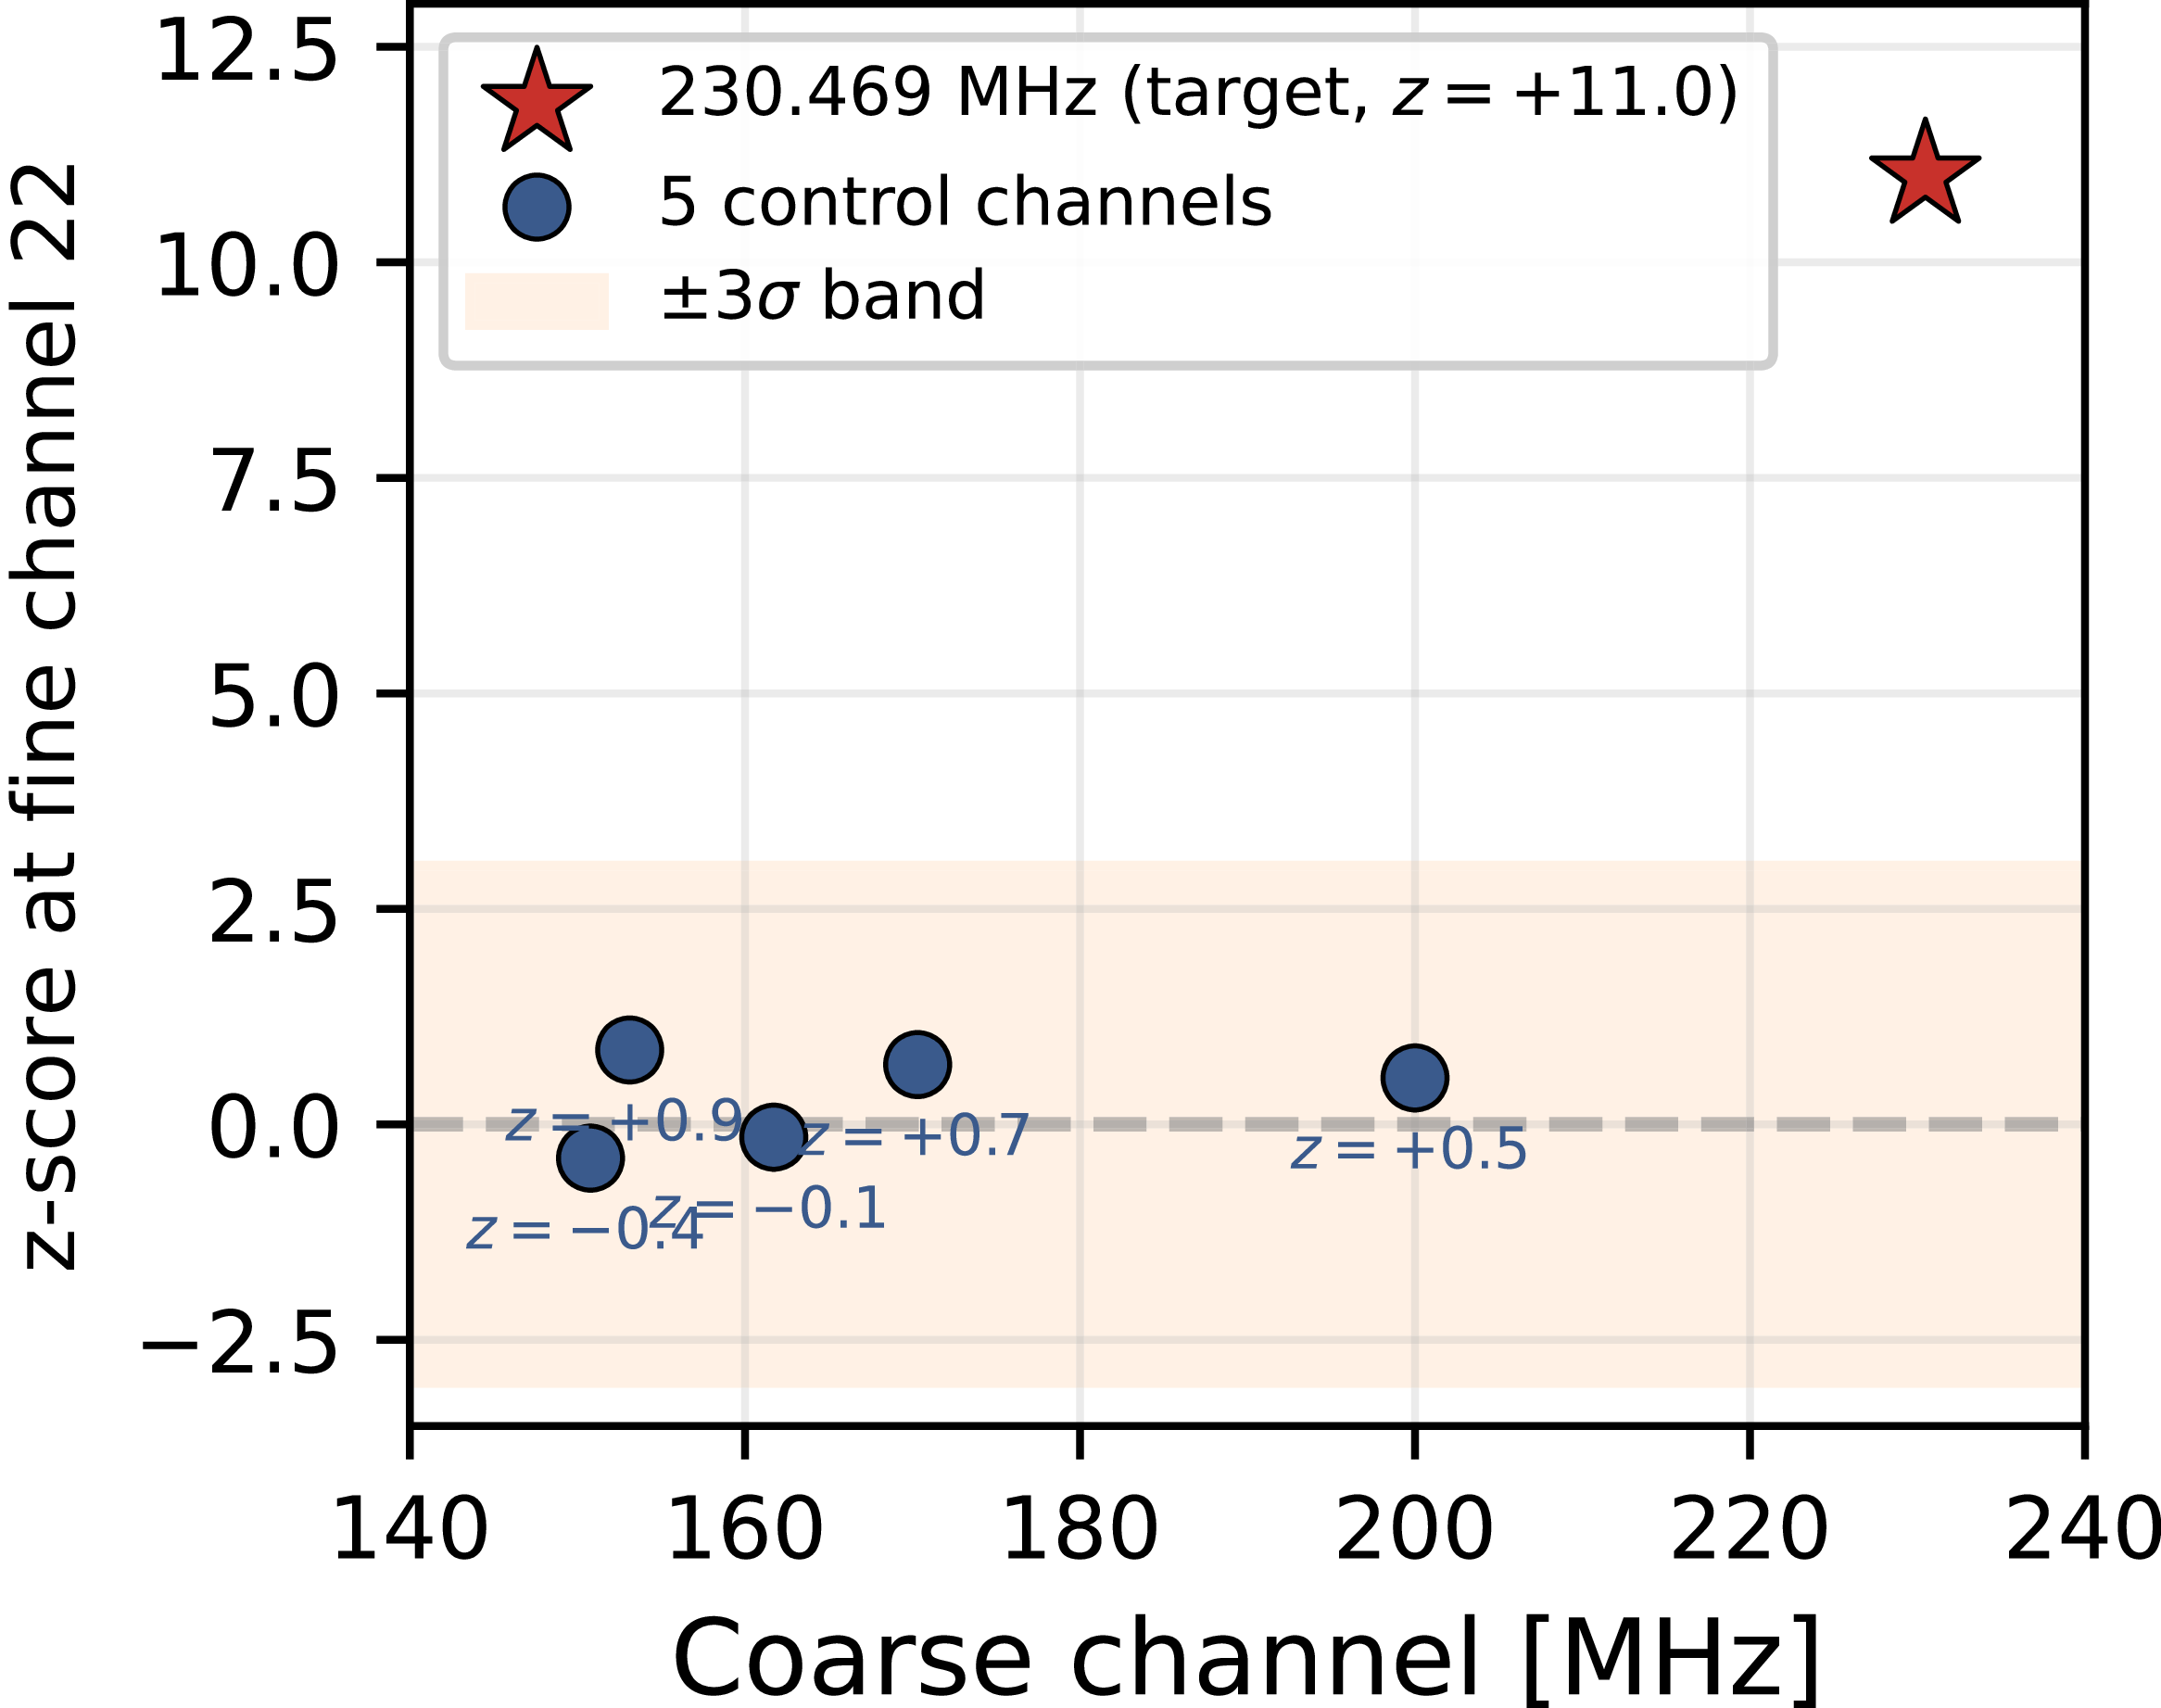
 230.469
 z=+11.0
 150.78
 153.12
 161.72
 170.31
 200.00
 ±1σ

 230.627
 N×f0
 230.627441
 ±12.207
 5.73
 ∑imin(1,2Δf/f0,i)
 N=127
 μ=143.5
 −1
 σ=8.4
 −1
 z=+25.4
 z=−1.26
 z=−0.96
 Ri=F22¯/Fother¯
 ≥5
 230.469
 Ri
 R=2.13
 R=0.94

 230.469

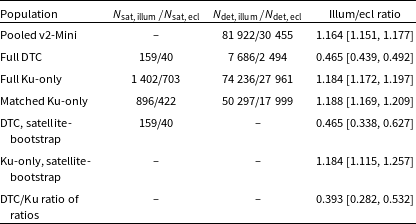
 B=2000
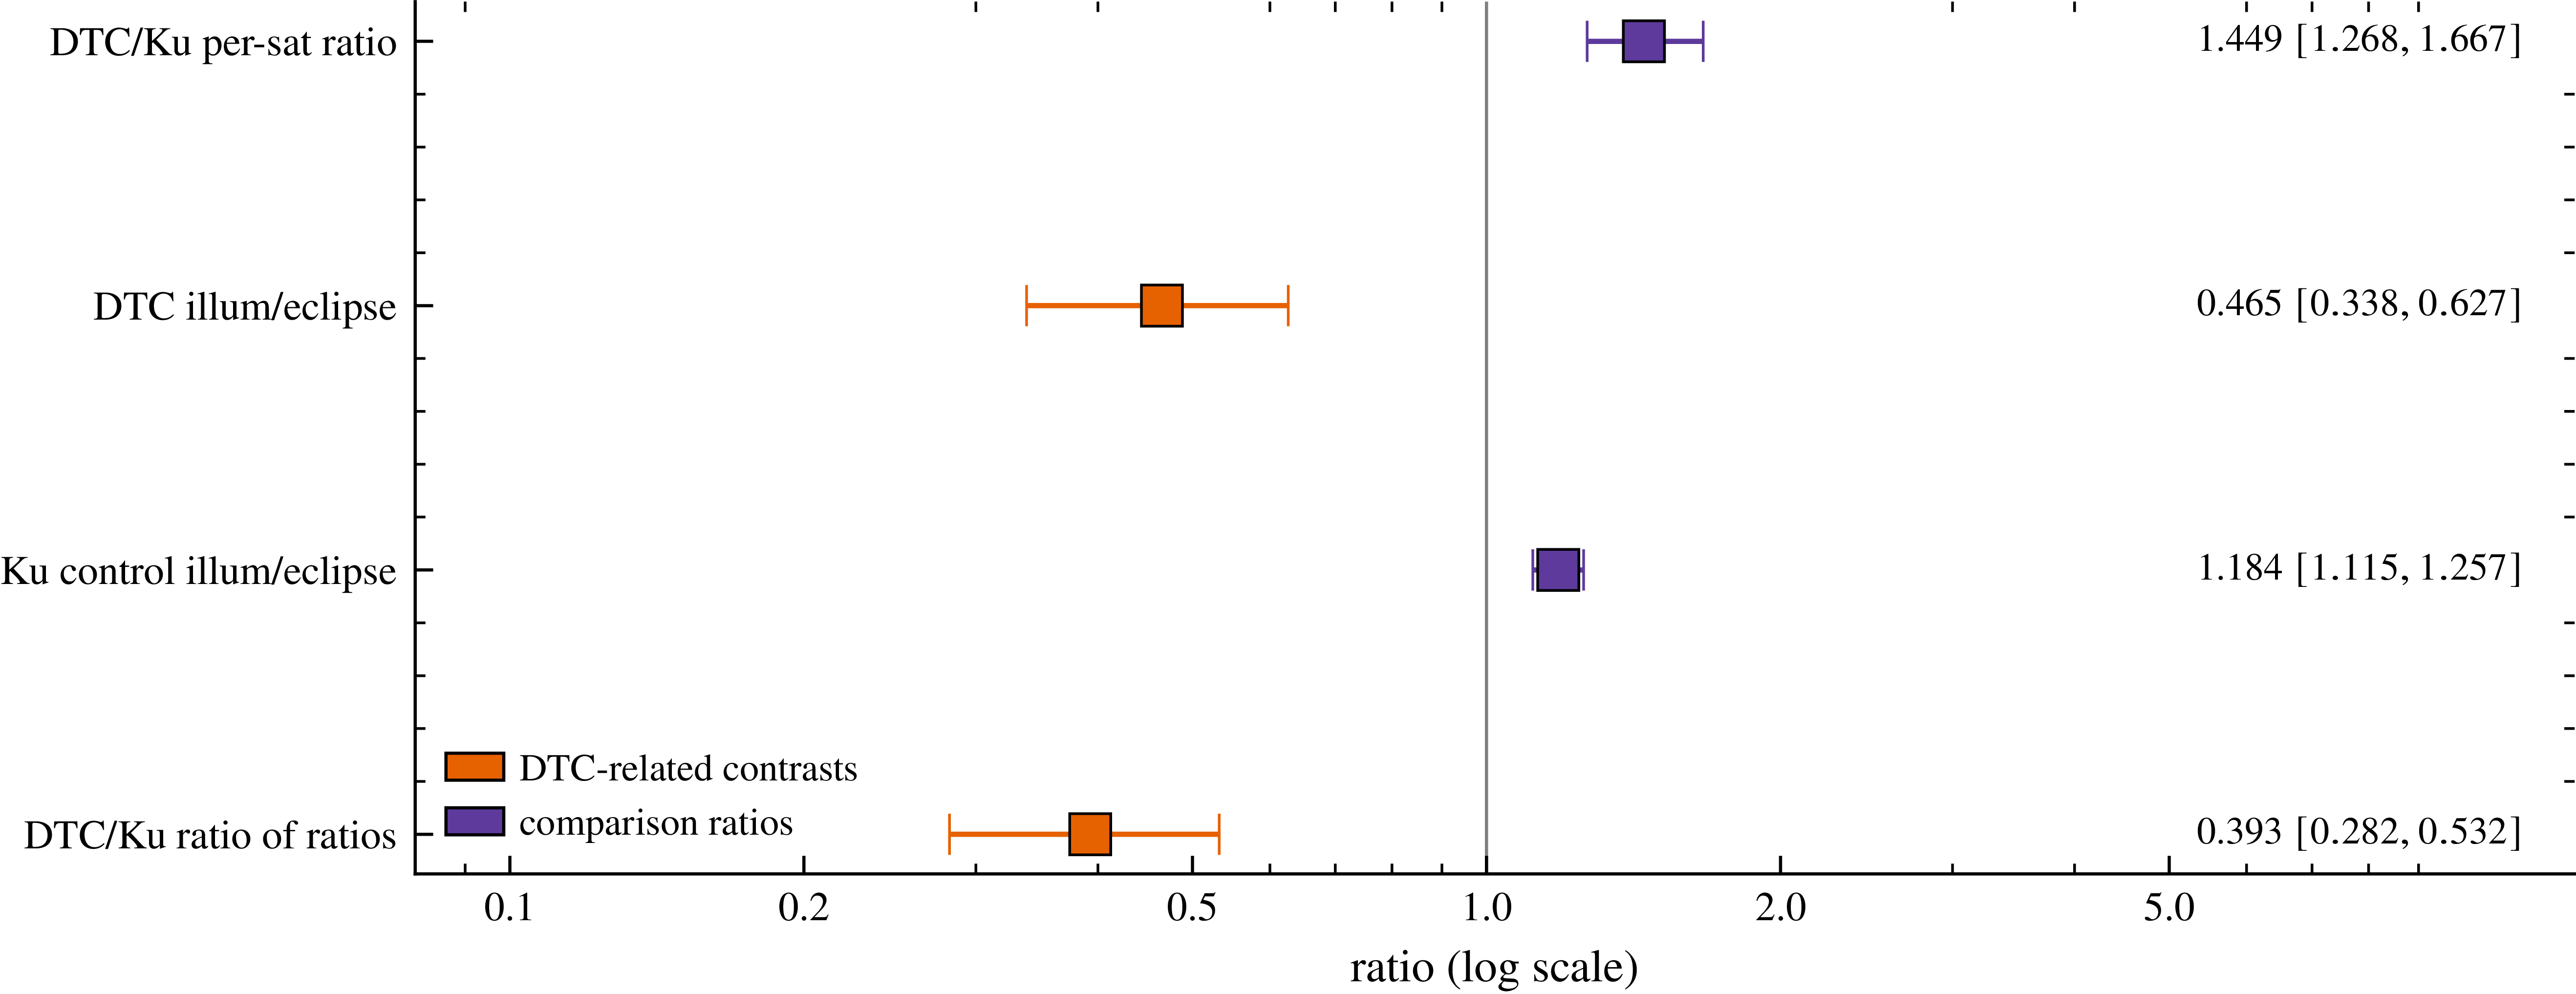

 Open access

