


1. Introduction
Ice Stream C presents a striking example of variability in Antarctic glacial flow. Whillans Ice Stream and Ice Stream D, immediately adjacent to Ice Stream C, move at speeds up to 1000ma–1 near their grounding lines, but the corresponding part of Ice Stream C, though similar in width and surface slope, moves at <10ma–1. Evidence suggests that the trunk of Ice Stream C (hereafter called C-trunk) stagnated around 140 years ago (Reference Retzlaff, Lord and BentleyRetzlaff and Bentley, 1993; hereafter R&B93), yet recent interferometric radar observations show that the upstream parts of the ice stream, including tributary C2 (hereafter simply C2) (Fig. 1) continue to move at speeds of 40–80ma–1 (Reference JoughinJoughin and others, 1999).
Location map of the Siple Coast region, showing the location of the ice streams. Gray bands show the ice-stream shear margins plotted by S&B87. The heavy outline is our field area.

R&B93 interpreted ground-penetrating radar records from five crossings of the southern shear margin of the ice stream. They found that the ages of the marginal crevasses (in1988/89) at 150–130° W were close to 130+30 years. However, a transect at 124° W foundmuch younger crevasses, with ages of 40 (+20) years.
R&B93 proposed that the stagnation of Ice Stream C was the result of a change in the basal water system of the ice stream from a distributed, sheet-like flow to a system of channels. Since a system of channels transports water more efficiently than a sheet-flow, the water pressure at the bed dropped and basal drag increased. Stagnation would have started at the downstream end of the ice stream, where water fluxes are largest, and propagated upstream.
Reference Alley, Anandakrishnan, Bentley and LordAlley and others (1994) presented a competing model: the water-piracy hypothesis. They pointed out that the basal hydraulic potential at the ice-stream bed near the junction of C-trunk and C2 diverts water into Whillans Ice Stream. In their model this region became flatter during the evolution of the ice stream, as the head of the ice stream propagated inland. The bed slope began to divert water to the south, and the trunk began to lose water. Sticky spots on its bed exerted greater drag as lubrication decreased, bringing the trunk of the ice stream to a standstill. That part of the ice stream upstream of the diversion point continues to show rapid motion.
Both of these models of ice-stream stagnation are consistent with R&B93’s data, but predict different distributions of crevasse ages along the shear margins of C2. The channelized drainage model predicts that ages should become gradually younger upstream from the junction of C-trunk and C2, whereas the water-piracy model predicts a more sudden change in age at the point where water was diverted.
Our study was intended to extend R&B93’s work by collecting data on the northern shear margin, including many crossings along a continuous traverse. Our aim was to determine whether the water-piracy hypothesis, the channelized drainage model or some other model best matches the pattern of stagnation of the ice stream. The distribution of crevasse ages we found is too complex to accomplish that aim, but it does reveal interesting aspects of ice-stream stagnation. We also derive snow-accumulation rates from internal layering in our transects. The accumulation rates themselves aid in calculating crevasse ages; their spatial variability is also glaciologically interesting, although space limits preclude discussion in this paper.
A terminological note: Shear margin usually means the zone, a few kilometers wide, of chaotic open crevasses bordering an ice stream. Because they maymigrate through time and because chaotic crevassing is common also elsewhere within an ice stream, former marginal shear zones, as distinct from the boundary chaotic crevassing, cannot easily be identified from the radar data. Consequently, we will use the term shear margin (or margin) more vaguely to mean either the marginal shear zone or the outer edge of chaotic crevassing. For determining stagnation ages the distinction is not important.
2. Techniques
The experimental set-up for our field profiles consisted of a Bombardier Alpine I snowmobile pulling two Nansen sleds. Navigational data were collected with a Magellan C-code globalpositioning system (GPS) receiver. Position estimates for this study are accurate to 100m rms.
The radar system was an 80 MHz Geophysical Survey Systems Inc. monopulse system. Transmitted and received signals were digitized as part of a single trace at a nominal sampling rate of 500 MHz. The digitizer was set to record one 500-sample trace every 170ms.
During fieldwork, the sampling frequency of the digitizer was measured for time calibration every 3–4 hours. This calibration is accurate to within 0.07 %.With a few exceptions, sampling rates were within 1% of 493 MHz.
All data were processed using UNIX-based processing programs and the MATLAB data-processing language. A bandpass filter with cut-off frequencies at 50 and 200 MHz was applied to each trace to remove the d.c. shift and some of the high-frequency noise. For each transect, an average of all of the traces in the transect was subtracted from each trace. This served to remove some instrumental artifacts.
Selected internal layers were digitized (or picked) every 10–100 traces, depending on the variability in layer depths. By comparing the picked depths of the same layer at crossovers between different survey lines, the picks were found to be consistent to within 1.8 samples (rms). The picks themselves follow a consistent phase for a given layer to within 1.5 samples.
Every hundredth trace, the shallowest crevasse visible for 50 traces in either direction was picked. Normal profiling speeds were on the order of 4ms–1, so crevasse picks are typically around 60 m apart.
3. Survey
We collected over 250 km of radar profiles at 124–144°W, mostly in large zigzags across the northern edge of the shear margin. Four transects extend 40–50km south, two into C-trunk and two entirely across C2. Our field survey was laid on the basis of the airborne shear-margin mapping by Reference Shabtaie and BentleyShabtaie and Bentley (1987) (hereafter S&B87), which proved mostly accurate despite the wide spacings of their flight-lines. In Figure 8 (shown later) we show our more detailed mapping based on our new data.
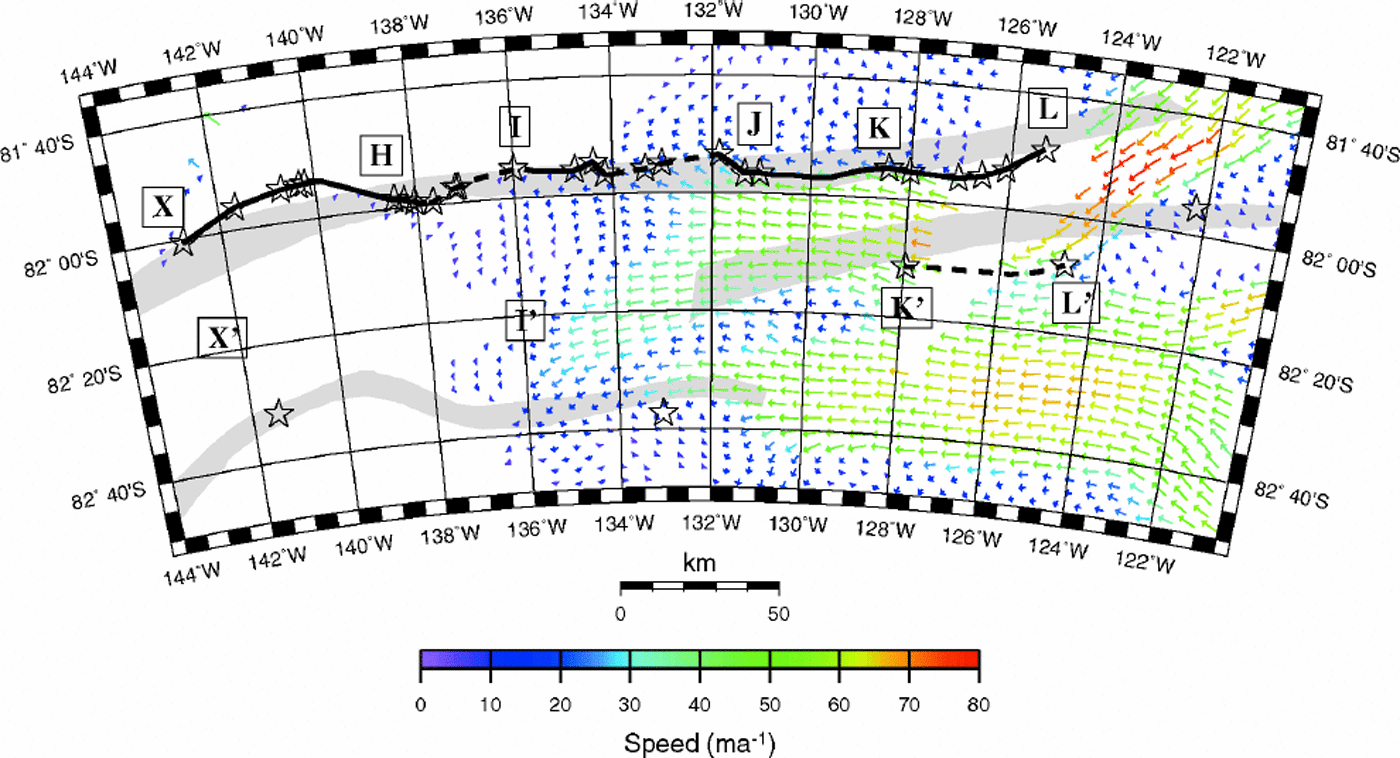
Margin of Ice Stream C as determined from our data. Arrows give velocity measurements as found by Reference JoughinJoughin and others (1999). Stars show the outer edge of jumbled hyperbolas in our radar data. The black line shows our interpretation of the margin location. The margin line is dotted where the ice appears to move across the margin.
During our field survey a group from the University of Washington derived accumulation rates at points X and L (see Fig. 3, shown later) by the standard β -core technique of Reference Whillans and BindschadlerWhillans and Bindschadler (1988) (personal communication from H. Conway, 1998). Therates found were 73±6 kgm–2 a–1 at X (82°S, 142.83°W) and 68±8 kgm–2 a–1 at L (81.78°S, 125.43°W). Each of these cores yielded a density–depth profile.
We interpolated density profiles between the cores using the empirical model of Reference Herron and LangwayHerron and Langway (1980). Model parameters depend on the depositional environment at the surface, and the temperature of the firn at depth. We selected a set of parameters for each core site that fit the density–depth data in a least-squares sense. Between the core sites, the parameters were spatially interpolated. The Herron–Langway model uses knowledge of the accumulation rate, which we determined from the internal layering in our transects (as discussed below). This procedure required iteration between the accumulation rate and the density profile; we found two iterations to be sufficient.
The density–depth function was converted to dielectric constant using Reference LooyengaLooyenga’s (1965) formula:
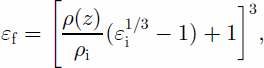
where εi = 3.17 is the dielectric constant of ice, ρ(z) is the density–depth relation, and ρi is the density of solid ice. The velocity of electromagnetic waves in a medium with a dielectric constant εf is  where c is the speed of light in a vacuum. Combining and integrating these equations gives an expression for the travel time as a function of depth:

This equation was numerically inverted to give the depth as a function of travel time.
The accumulation rate was obtained by tracing an internal layer (assumed to be an isochrone) to one of the core sites. Its age there was determined by dividing the overburden (the overlaying mass of snow per unit area) by the accumulation rate. The accumulation rate could then be determined anywhere that this particular layer is seen. This technique is similar to that described by Reference Richardson and HolmlundRichardson and Holmlund (1998) and Reference Richardson-NäslundRichardson-Naslund (2001).
The age of buried crevasses was found by dividing the overburden above the crevasses by the accumulation rate derived from the internal layering.
3.1. Error estimates
We arrived at estimates of the error in crevasse ages using variational principles. The equations we use to derive the layer and crevasse ages are:
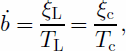
so

where ḃ is the accumulation rate, and Tc and TL and ξc and ξL are the ages and overburdens of the crevasse and the layer, respectively. Taking the first-order variation of Equation (4), we find

The firn above the internal layer makes up part of the overburden above the buried crevasse, so overburden errors due to any mis-estimate in the density profile for the crevasse and the layer are correlated. We can take this into account by saying

whence we can write Equation (5) as

This shows that a substantial part of the overburden error in the crevasse age cancels out, particularly because much of the variation between different overburden models occurs near the surface. If we use a 50 year-old layer to date a 120 year-old crevasse, a conservative estimate of the errors in the density parameters yields an error in the crevasse age due to density effects of roughly 4%.
There are four additional error sources for the age of buried crevasses: (1) the uncertainty in the accumulation rate, (2) the uncertainty in the depth of crevasses, (3) straining within the ice, and (4) the spatial variability of the accumulation rate.
(1) The accumulation uncertainty comes from a small error in picking the depth of the marker horizon (0.4 mor less) and the error in the accumulation rate at the core sites (8% and 11% from sites X and L, respectively). Using a weighted average of the accumulation rates at the cores to date a single layer leads to an error in the age of 6%.
(2) We estimate the standard error in the travel time to a buried crevasse to be 18–20 ns, or 8–11%.
(3) If the horizontal divergence in ice flow is non-zero, the ice column will correspondingly strain vertically. From a simple calculation of the effect of this strain on the depths of crevasses and internal layers, we estimate this error at around 1% for strain rates found by Reference JoughinJoughin and others (1999) in the Upstream C region.
(4) Ice velocities in the upstream portion of C2 may be as large as 75 ma–1, and the accumulation rate varies on a scale of a few kilometers or less (section 4.3). In the approximately 100 years between the burial of the crevasses and the deposition of our marker horizon, the crevasses may have moved as much as 7.5 km. The rms variation in the accumulation rate is around 6–10% of the mean, which we take also as the relative error in age.
Taken together, the errors amount to 12–15% of the age of a given crevasse, depending on the accumulation rate.
4. Results
4.1. Radar profiles
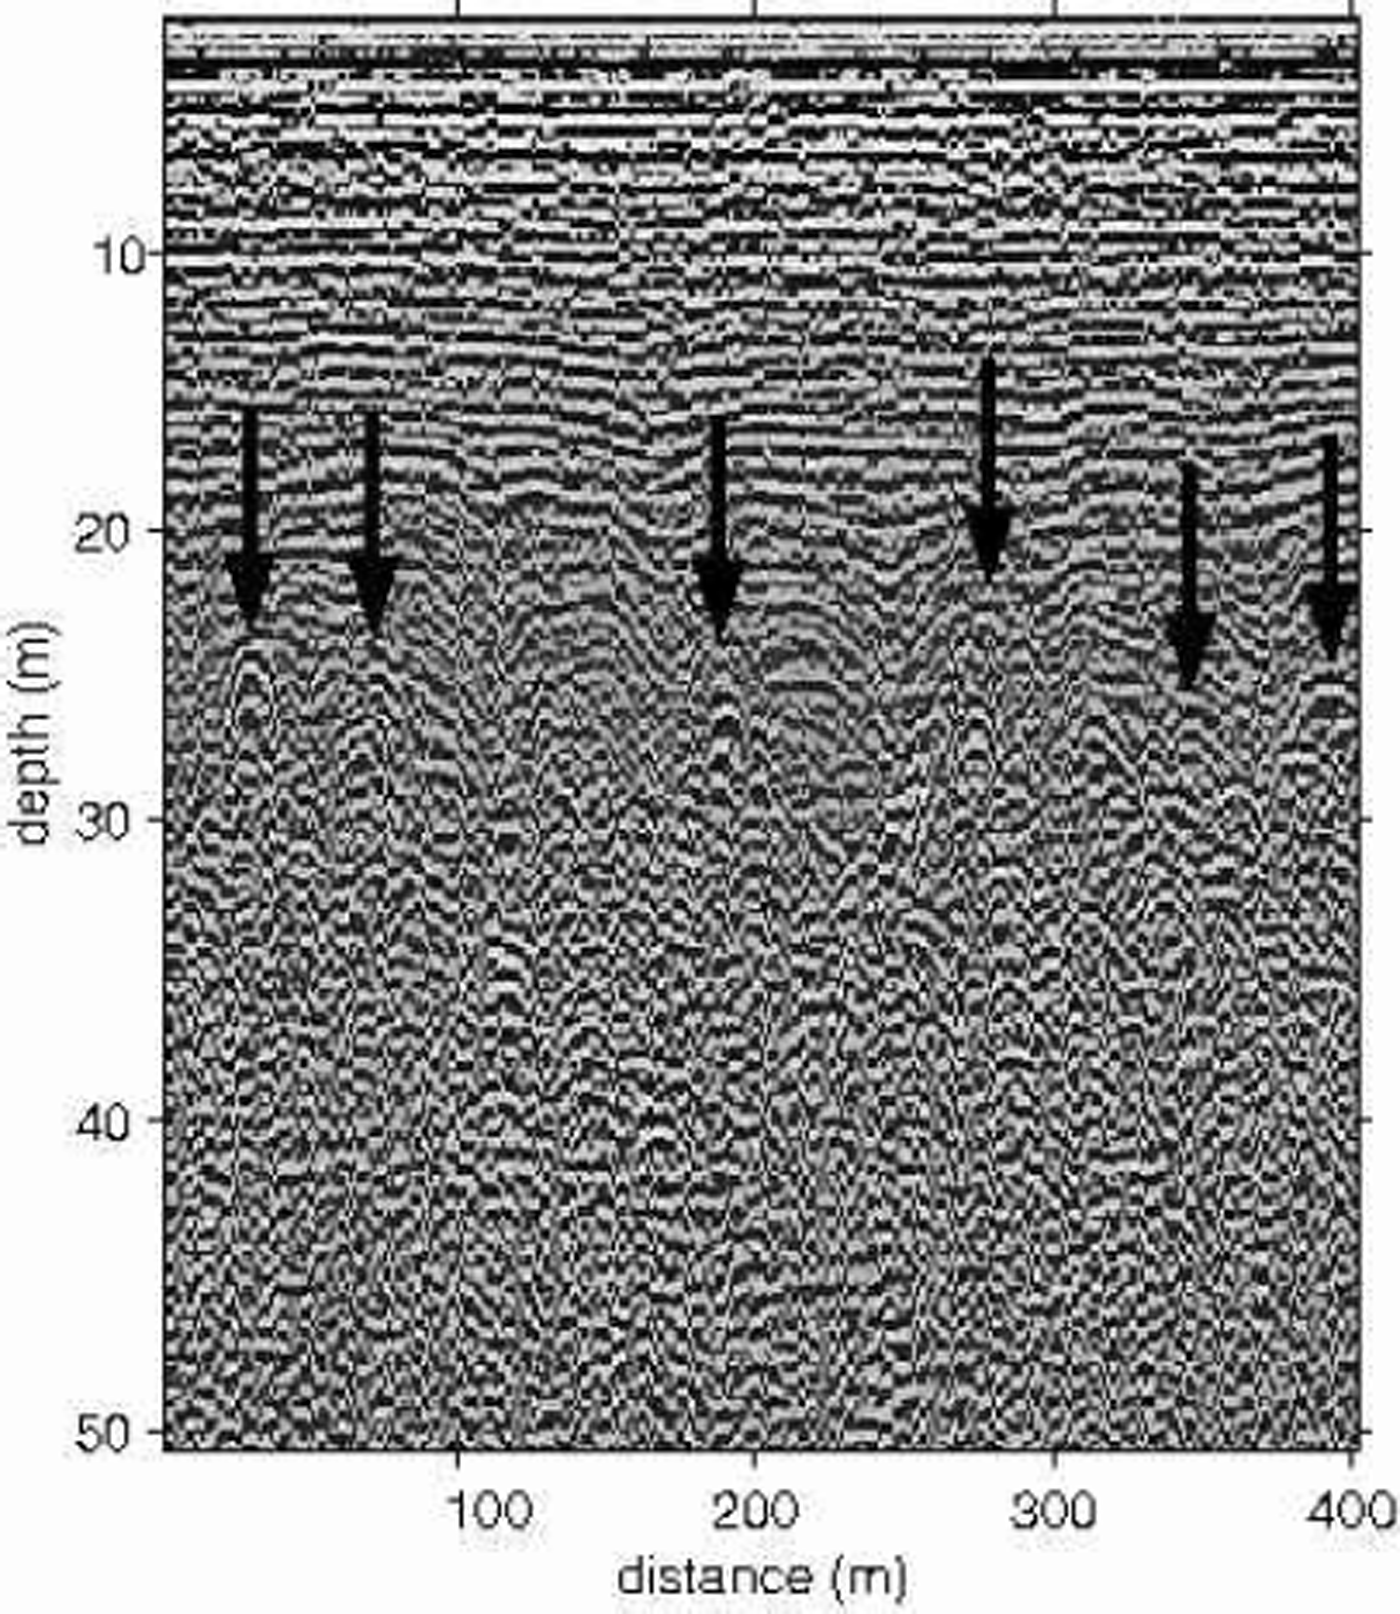
Internal reflectors on Ice Stream C show a characteristic sequence of changes with depth from smooth layers to distorted and discontinuous layers to jumbled diffraction hyperbolas (Fig. 2). Following Reference Clarke and BentleyClarke and Bentley (1994), we interpret the distortions in internal layers as sagging snow bridges. The remanent crevasse voids produce the hyperbolic returns.
Chaotic crevasses. Arrows indicate the tops of some shallow-crevasse hyperbolas.
Reference Nath and VaughanNath and Vaughan (2000) propose that crevasses can grow from defects in the firn either at the surface or at 10–30m depth. However, they do not describe the relation between crevasses that start at depth and crevasses that reach the surface. In particular, they do not describe the conditions under which crevasses can exist at depth without ever reaching the surface. It is possible that the crevasses which we interpret as buried crevasses are in fact active at depth or that they have been in the past. Either case would lead us to overestimate their age. However, until we have a better understanding of the processes that lead to open or closed crevasses, we will assume that the marginal crevasses on Ice Stream C were open when the ice stream was active, as they are now on neighboring Whillans Ice Stream and Ice Stream D.
4.2. Crevasse morphology
Based on the distribution of buried crevasses, the radargrams crossing the edge of the ice stream can be divided generally into three sequential categories: ridge ice (no crevasses visible, internal layers identifiable at all depths); scattered crevasses (crevasses are visible but internal layers are visible between the crevasses); and chaotic crevasses (crevasses are dense; tails of the diffraction hyperbolas overlap; internal layers visible only above the crevassed layer). Because our aim was to find the ages of buried shear margins, we have calculated ages only for the chaotic region of the ice stream.
4.3. Layer picks
We found that one particular internal layer could be traced through all of our transects and to both core sites (points X and L in Fig. 3). This layer appears 40–50 samples deep in the radar records, too shallow to be greatly disrupted by crevassing, yet deep enough that the layer returns always followed the end of the transmission of outgoing radar pulse. This layer is used in the accumulation estimate throughout the survey. The weighted average of the ages calculated at the core sites, 46+4 years, is taken as the age for the entire survey.
Map of the accumulation rate on Ice Stream C. Each colored point on the margin represents the median accumulation rate over 250 m along track (color key at bottom). The gray bands are the ice-stream shear margins plotted by S&B87.

The accumulation rate (Fig. 3) shows wide variations throughout the study area. Changes in the accumulation rate of 20–25% within 3–5 km are common. These variations presumably relate to variations in deposition created by surface undulations.
Accumulation rates along Ice Stream C are generally higher than those at our core sites; they average around 80 kgm–2 a–1, with a maximum of 130 kgm–2 a–1 and a minimum of 60 kgm–2 a–1.
4.4. Crevasse depths and ages
The crevasse-age data show large scatter between adjacent picks, principally due to the difficulty in correctly identifying the crevasse hyperbolas in the radar records. To smooth the transect data we plot the median age for each kilometer along the track, calculated from the 100-trace minima. These data fall into two categories: data from long transects into the ice stream and zigzag data. We discuss each in turn. We include R&B93 transects 2–5 (R2–R5 in Fig. 6, shown below) in our discussion of the long transects. Those four transects are geographically associated with the new ones; R&B93 profile 1 is far downstream and is not shown in Figure 6.
Map of crevasse ages on Ice Stream C. Each colored point represents the median age of crevasses along 1km of track. The color key gives the age in years for each color. Crevasses older than 300 years are plotted in blue; those younger than 100 years are plotted in red. Sections of track where no crevasses were encountered are plotted in white; sections where only scattered crevasses were found are plotted in gray; and sections where chaotic crevasses were found but no age could be determined are plotted in black. The gray bands are the ice-stream margins plotted by S&B87. Thin lines (labeled R2–R5) indicate the position of transects described by R&B93. Arrows give surface velocities determined by Reference JoughinJoughin and others (1999).

4.4.1. Long transects (Fig. 4)
Transect X–X crosses from ridge CD through the northern shear margin into C-trunk, ending within the formerly active ice stream. The youngest crevasses are right at the northern edge of the crevassed zone. R2 lies 30 km south of X across C-trunk. Both margins of C-trunk are sharply defined.
Crevasse ages for long transects into the ice-stream vs distance along track. Ages in years are given along the lefthand edge of the plots; an approximate depth scale (in meters) appropriate for the average accumulation rate is given at right. Heavy black data points give the median age calculated for each kilometer along the track. Bars show the calculated standard error.

Transect I–I is situated at the downstream end of the deceleration zone between C2 and C-trunk. Continued southward it passes through camp Upstream C and connects to R3. Along transect I–I’ the youngest crevasses lie about 10 km south of the northern edge of chaotic crevassing. In that 10 km stretch, burial ages increase monotonically northward by some 80 years. The implication is that here the northern shear margin migrated southward at an average rate of 125ma–1 before the ice stream stagnated. The crevasse ages near I are about the same as those around Upstream C and along most of R3. Like I–I, however, R3 also shows a pronounced outward increase in burial ages leading to the edge of chaotic crevassing. In this case, the increase in age is about 150 years over about 7 km, which suggests a migration rate of about 50 kma–1. Taken together, the data suggest that the trunk of Ice Stream C around 136°W underwent a narrowing of about 20% over more than a century before it stagnated to the point that crevasses no longer formed.
R4 runs from the southern shear margin of C2 (per S&B87) southward across the southern margin of C-trunk between profiles I–I’ and K–K’. The occurrence of crevasses along most of the profile shows that this sector was active when C-trunk was active.
Transect K–K’ completely crosses C2. The northern edge of the ice stream lies about 10 km south of the position indicated by S&B87. The youngest crevasses lie just a kilometer or two south of the crevassing boundary––if the ice-stream margin here migrated in ward before stagnation, it did so only slightly. More likely, the crevasse ages are not significantly different across a 5 km wide marginal zone. The ages increase rapidly southward towards a maximum of some 300 years in the middle of C2. Still farther south they decrease just as rapidly again to minimum ages right at their southern termination. (This gives the appearance of an outward migration of the margin, but we think it unlikely that crevassing would cease in ward of an outwardly migrating margin, so we believe that appearance is illusory.) The southern margin lies within a region of relatively fast present- day flow.
As on K–K’, crevasses on transect L–L’ begin about 10 km south of the S&B87 shear margin. Crevasse ages increase slightly for the next 20 km southward. Then, south of a 5 km zone with no crevasses, the ages suddenly decrease by 100 years, then increase again by 75 years in the last 3 km before the end of the chaotic-crevasse zone (apparent migration rate 40 ma–1). The southern boundary of crevasses lies right at the tip of a zone of present-day slow flow past which C1 and C2 converge.
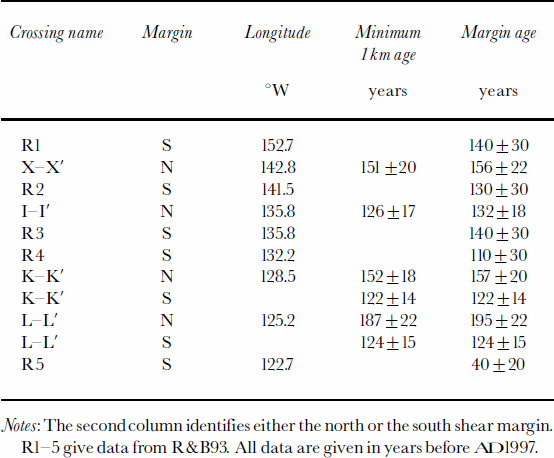
Notes: The second column identifies either the north or the south shear margin. R1–5 give data from R&B93. All data are given in years before AD1997.
R5, which crosses the southern margin of C2 as mapped by S&B87, is mostly crevassed, with crevasse ages of 50–110 years. The zones of crevassed and crevasse-free ice are discordant with the present-day flow
From the transect data we determine two measures of the age for each section of the shear margin: the youngest 1km median age and the mean age of the three to five youngest 1 km ages (Table1). The latter probably more reliably estimate when the ice stream as a whole slowed down, because they show when crevassing stopped over a larger lateral extent of the shear margin. Table 1 gives both measures of age for each of the crossings. When the shear margin is very narrow the two measures are the same. For clarity we have plotted only the 3–5km mean ages in Figure 4.
Crevasse ages on long transects into the margin
4.4.2. Zigzag transects
The other component of our survey consists of a nearly continuous traverse of short zigzag transects between Ice Stream C and ridge C/D. We present these data both as plots of crevasse age vs longitude (Fig. 5) and as a map of the margin with the crevasse age color-coded along the track (Fig. 6).
Crevasse ages on zigzag transects vs longitude. Age in years is given on the left side of the plot, and an approximate depth scale (appropriate for the average accumulation rate for the transect) is given at right. These plots include all data for a given longitude. Where there is information from more than one transect at a given longitude, the youngest measurement gives the best estimate of the margin age.

Figures 5 and 6 show that the pattern of crevasse ages along the northern boundary zone of Ice Stream C is neither simple nor orderly. As already discussed, the youngest crevasses may or may not be directly at the northern edge of the ice stream. Because of this, a short transect that does not cross a minimum in crevasse ages can only yield an upper bound on the age of stagnation.
Figures 5 and 6 may be summarized as follows: From 143˚ to 135°W, crevassing stopped on the north margin 148+15 years ago. Between 134˚ and 131°W, crevassing stopped more recently, only 120+20 years ago. Between 128˚ and 125°W, crevasse ages increase gradually, with a maximum age of 195+20 years at 125.5°W. East of 125°W, crevasses become much younger, with a minimum age of 78 ±21years at 124.1°W. Stagnation ages are summarized in Figure 7.
Age of the north margin vs longitude. Thick hatched bars indicate areas where crevasses of a consistent age were found over an extended length of the margin. Diamonds with error bars indicate crevasses of a consistent age found on a long transect into the margin. Diamonds with black bars denote the long transects across the north margin; squares with gray bars indicate transects across the south margin, including data from R&B93.

5. Discussion
The stagnation characteristics of the C-trunk and C2 are different (Fig. 7). The northern and southern margins of C-trunk both show a stagnation age (defined as the age when all active crevasse formation at a particular longitude ceased) of around 140+20 years ago. In contrast, in the junction zone between C-trunk and C2 (131–134˚ W), stagnation ages are only around 122+12 years. Then eastward along C2, crevasses ceased to form increasingly long ago, despite the eastward increase in present-day speeds. On the northern side, that decrease is from around 120 years ago at 134°W to 200 years ago at 125°W. Over the same longitudinal stretch on the south side of C2, however, the buried crevasse ages increase only slightly. It follows that there is a surprising age difference between the northern and southern margins that grows from zero at 134°W to 35+24 years on K–K’ and to 71+26 years on L–L’.
In our view, the age difference between stagnation on the two margins could only occur if the ice stream slowed down gradually. The margins did not respond identically to this gradual deceleration: the northern margin stopped forming crevasses first, followed 30–50 years later by the southern margin.
While other explanations for this asymmetry may be possible, the one we favor is that the ice in the southern shear margin of C2 was softer to shear than that in the northern margin. A number of studies (e.g. Reference Echelmeyer, Harrison, Larsen and MitchellEchelmeyer and others, 1994; Reference Scambos, Echelmeyer, Fahnestock and BindschadlerScambos and others, 1994; Reference Hulbe and WhillansHulbe and Whillans,1997) have found evidence that the margins of ice streams can contain narrow bands of ice that are 3–10 times weaker to shear than isotropic ice at the same temperature, presumably as a result of strain-heating and aligned crystal fabric. Because strain weakening involves locally controlled feedback processes, weak bands could very well become better developed on one side of the ice stream than the other. During the stagnation of Ice Stream C, the weaker bands would have maintained high strain rates and continued crevassing even after strain rates on stronger sections had fallen below that necessary to open crevasses.
Along C-trunk (west of 134°W) the crevasse ages do not differ significantly, either along the shear margins or from one shear margin to the other. Perhaps C-trunk was more mature and hence more uniformly developed than C2.
Around 136°W the ice stream apparently narrowed by some 20% during the century before stagnation. Such a pronounced narrowing does not show up anywhere else on either C-trunk or C2 and we have no explanation to suggest for it.
The very shallow crevasses east of camp L appear to be related to local conditions: a sharp drop-off in bed elevation immediately beneath them (Reference Retzlaff and BentleyRetzlaff and others, 1993) and the moderately high flow velocities in the area (Reference JoughinJoughin and others, 1999) (Fig. 6). Open crevasses have been seen near this area (R&B93); during our survey it appeared that crevasses were open to the surface 2–3 km to the east of our profile line.
Otherwise there is no crevassing associated with the present-day flow. Our study of published (Reference Bindschadler, Vornberger, Blankenship, Scambos and JacobelBindschadler and others, 1996) and our own unpublished data on Ice Stream D indicates that crevassed marginal shear zones develop only where the center-line speed in the ice stream is at least 130ma–1. We infer that the flow of C2 is now a factor of two or more slower than it was 200 years ago; the data further indicate that the slow-down occurred at the upstream end of C2 first. This does not accord well with either the R&B93 or Reference Alley, Anandakrishnan, Bentley and LordAlley and others (1994) models for the stagnation.
The sampled boundaries of Ice Stream C can be redrawn from our data (Fig.8). The northern boundary is more sinuous than shown by S&B87, but agrees with their actual data points (flight crossings at 123°,132°, 133°,134.5˚ and 142°W). Similarly, the flight-line crossings from which S&B87 drew the southern boundary of C2 (near 124˚ and 132°W) do not constrain the boundary in between, where it can easily be drawn through the crevassing limits at the southern ends of transects K–K’ and L–L’.
The locations of the buried shear margins are mostly consistent with the boundaries between faster and slower present-day flow (Fig. 6), although data gaps preclude a precise comparison. However, there are mismatches at the southern end of K–K’, along R5 and between K and I.
6. Conclusions
Our data show a complex spatial variation in the age of crevasses on Ice Stream C. While both margins of C-trunk seem to have stagnated at approximately the same time over a long distance, the margins of C2 differ in ages both along and across the tributary: the age increases upstream, and the northern margin stagnated significantly earlier than the trunk did, while the southern margin stagnated significantly later.
Whatever its cause, the mysterious age difference between the northern and southern margins of C2 has important implications for the interpretation of crevasse ages from Ice Stream C. Previous interpretations of crevasse ages (Reference Retzlaff, Lord and BentleyRetzlaff and Bentley, 1993; Reference Alley, Anandakrishnan, Bentley and LordAlley and others, 1994) from only the southern margin of Ice Stream C could not have discovered this difference. Our data show that when crevasses disappeared from a section of the margin is a function not only of some single kinematic parameter common to both margins (e.g. the maximum velocity in the ice stream for a given longitude), but also of the properties of that section of margin.
If the age difference between the northern and southern margins of C2 represents the uncertainty in the time of stagnation (defined relative to some kinematic parameter), then the longitudinal differences also may not be significant for timing the stagnation of Ice Stream C. The most that can be said is that the process was essentially complete 120 years ago, and that it started earlier than 190 years ago.
Acknowledgements
Wewould like to thank H. Conway, T. Gades and M. Conway for their able assistance in and out of the field. Thanks also to I. Joughin for providing digital velocity data and to two anonymous reviewers. This work was supported by grant No. OPP96-15322 from the U.S.National Science Foundation. This is contribution No. 588 of the Geophysical and Polar Research Center, University ofWisconsin–Madison.



