The need for integration of cultural context in the understanding of child development has gained increased attention over the last decades (Causadias, Reference Causadias2013; García Coll, Akerman, & Cicchetti, Reference García Coll, Akerman and Cicchetti2000). Therefore, the study of the interplay of culture, psychology, and biology in less explored populations and cultural contexts remains highly needed to compensate for the traditionally heavy emphasis on WEIRD (Western, educated, industrialized, rich, and democratic) contexts in developmental psychology and psychopathology (Henrich, Heine, & Norenzayan, Reference Henrich, Heine and Norenzayan2010). Contextual factors, such as cultural background and family socioeconomic status, have been identified as important predictors of child development outcomes (Bornstein, Reference Bornstein1995; Grantham-McGregor et al., Reference Grantham-McGregor, Cheung, Cueto, Glewwe, Richter and Strupp2007).
It has been proposed that different (sub)cultures can act as organizing agents in child development. They may influence the developmental trajectories through both proximal and distal processes and gradually become embodied in the child's biological makeup and repertoire of behaviors. One approach to describe this process suggests to consider parents from specific cultures or ethnic groups as potentially creating a specific “developmental niche” with specific physical and social settings of daily life, specific customs of childcare, and a specific caretaker psychology (Harkness & Super, Reference Harkness and Super1994). This approach is valuable, although (sub)cultures are never monolithic and children actively mold the cultural affordances into different individual trajectories. Unfortunately, the intricate interplay between culture and child development (Bradley & Corwyn, Reference Bradley and Corwyn2005; Causadias, Reference Causadias2013) has been infrequently studied in Latin America.
Chile is a South American country with a mixed ethnic population. Nearly 11.7% of the population identify themselves as belonging to an indigenous group according to the CASEN survey of the Social Observatory of the Ministry of Social Development (CASEN, 2015). By far, Mapuche represents the largest indigenous group in Chile (80%), amounting to 9.4% of the total population (CASEN, 2015). Despite being the largest indigenous group, the Mapuche population still forms an ethnic minority in a nonindigenous society. The Mapuche population lives primarily in the Araucanía region, where it represents 32% of the inhabitants (CASEN, 2015). This region shows the lowest gross domestic product per capita in Chile (11,542 USD per capita), reaching less than half of the national mean gross domestic product per capita (24,270 USD per capita, Central Bank of Chile).
Little is known about the way present-day Mapuche canalize child development. There is, however, evidence supporting that the particular characteristics of this ethnic group may provide a distinctive developmental niche. The Mapuche have traditionally resisted the dominant culture (Dunbar, Saiz, Stela, & Saez, Reference Dunbar, Saiz, Stela and Saez2000) and only in recent years have they become somewhat more integrated (Alarcón & Nahuelcheo, Reference Alarcón and Nahuelcheo2008). The Mapuche originally practiced polygamy and lived in a patrilocal extended family. Traditionally, older children were raised by all members of the patrilineal group, with an authority role for the paternal grandfather. Children were highly valued, and the number of children per woman was high. Up to 4 years of age, children were in the constant company of their mother, positioned on a cradle-board or “kulpülwe,” and could observe all her activities in the traditional hut or “ruka” (Caniguan, Reference Caniguan2012). During childhood, they gradually begin to participate in gender-segregated work activities (e.g., taking care of the cattle and cleaning the ruka). The Mapuche worldview and significant legends were transmitted within the family through storytelling in Mapudungun, the Mapuche language. Regarding healthcare, the Mapuche consult a Machi (traditional healer and religious leader in the Mapuche culture), and mothers explain their children's diseases articulating religious, magic, and natural (hot, cold, and humidity) causes (Alarcón-Muñoz & Vidal-Herrera, Reference Alarcón-Muñoz and Vidal-Herrera2005). The latter imposes an important communicational barrier during the primary healthcare delivery process (Molineaux, Reference Molineaux2017).
Across the years, the Mapuche underwent a process of suppression and marginalization, and their traditional social structure has changed in various ways (Caniguan, Reference Caniguan2012). Some of these changes were the unfortunate result of economical suppression: the underpaid labor of Mapuche men outside their native villages, a form of labor migration, has resulted in an increasing number of single mothers, and both working and nonworking single mothers mostly live with their parents. As a result, the grandmother has become an important socializing agent, and the Mapuche culture is partly moving to a matrilocal and matrilinear system (Caniguan, Reference Caniguan2012). Other social changes formed an active adaptation to the majority culture: Mapuche in rural areas no longer live in rukas, no longer strive for large families, have accepted school as a socializing agent, and many have adopted the Roman Catholic or, more recently, the protestant Evangelical religion. Nevertheless, the Mapuche have developed resilience strategies rooted in many traditional and ancestral practice (Causadias, Reference Causadias2013). They hold on to certain cultural beliefs and practices that give meaning to their daily life and promote well-being. For instance, they celebrate traditional festivities and may still consult a Machi, the traditional healer. It can be argued that the Mapuche have gradually become a multicultural or mixed-cultural ethnic group that in some respects has become indistinguishable from the nonindigenous of the same social class (Caniguan, Reference Caniguan2012; Sadler & Obach, Reference Sadler and Obach2006), but this assimilation process is still rather recent. In Chile the identification as belonging to the Mapuche ethnic group still remains a very strong group affiliation, with particular cultural dynamics that account for intrinsic transmitted norms, values, beliefs, behavior, and worldview.
Recently it has been described how Mapuche women re-create cultural practices despite migration to urban areas, bringing meanings, customs, and practices encouraging younger generations to value and strengthen their cultural identity (Becerra, Merino, Webb, & Larrañaga, Reference Becerra, Merino, Webb and Larrañaga2017). These elements are especially noticeable within the current political turmoil (e.g., current discussions about territorial secession and a separate constitution; Carruthers & Rodriguez, Reference Carruthers and Rodriguez2009); therefore, the self-identification to the Mapuche ethnic group can be interpreted in many aspects as a culture-defining characteristic in the current Chilean context.
Ethnicity and Physical Development
Ethnic differences in anthropometric data have been observed for years both at the country level and between different ethnic groups within a country (Ball et al., Reference Ball, Shu, Xi, Rioux, Luximon and Molenbroek2010; Widyanti, Susanti, Sutalaksana, & Muslim, Reference Widyanti, Susanti, Sutalaksana and Muslim2015; Yap, Chan, Chan, & Wang, Reference Yap, Chan, Chan and Wang2001). These differences could be restricted to the level of proportions within different body segments or extend to overall body dimensions (Widyanti et al., Reference Widyanti, Susanti, Sutalaksana and Muslim2015). Several efforts are being made to establish anthropometric databases for different population and ethnic groups (de Onis et al., Reference de Onis, Garza, Victora, Onyango, Frongillo and Martines2004, Reference de Onis, Onyango, Borghi, Siyam, Blossner and Lutter2012; Fredriks et al., Reference Fredriks, van Buuren, van Heel, Dijkman-Neerincx, Verloove-Vanhorick and Wit2005; Ramirez-Velez et al., Reference Ramirez-Velez, Lopez-Cifuentes, Correa-Bautista, Gonzalez-Ruiz, Gonzalez-Jimenez, Cordoba-Rodriguez and Schmidt-RioValle2016; Zong & Li, Reference Zong and Li2013); however, complete and comprehensive information for many regions and ethnic groups is missing and insight into social and ethnic determinants of early physical development is still absent.
A recent study by Jones (Reference Jones2018), showed that mothers’ work condition is associated with obesity risk in their children. However, this association highly depends on ethnicity and socioeconomic status affecting both mothers’ work and children's physical parameters. For instance, mothers’ work outside home was detrimental to child weight for White children, whereas for Black children it decreased child obesity risk (Jones, Reference Jones2018). In addition, body mass index trajectories at early years are also reported to be associated with ethnic background (Guerrero et al., Reference Guerrero, Mao, Fuller, Bridges, Franke and Kuo2016).
In Chile, being Mapuche has clear connotations. Typically, they have a specific set of values and traditions, they have their own language, and they have been isolated from non-Mapuche Chileans. In general, a Mapuche Chilean has lower income in comparison to a non-Mapuche Chilean and a higher rate of indigence (Agostini, Brown, & Román, Reference Agostini, Brown and Román2010). Following Cohen's formulations (Reference Cohen2009) about the importance of socioeconomic status, region, and religion to account for the cultural variations of transmission of norms, beliefs, values, and behaviors, being characterized as a Mapuche is substantially different from being a non-Mapuche Chilean.
From a morphological perspective, there have been studies that found differences in the body mass index and somatotypes of Mapuche and non-Mapuche children (Bruneau-Chávez, España-Romero, Lang-Tapia, & Chillón, Reference Bruneau-Chávez, España-Romero, Lang-Tapia and Chillón2015). The development of body mass index has been related to socioeconomic status and ethnicity as independent factors (Sundquist & Johansson, Reference Sundquist and Johansson1998). Regarding ethnicity, there have been studies that shown different proportions of body mass index in the population depending if they have been immigrants or American-born immigrants and depending on the number of years living in America (e.g., Lauderdale & Rathouz, Reference Lauderdale and Rathouz2000).
One study has analyzed the influence of Mapuche origin and socioeconomic conditions on the height of 1,293 adults living in the Araucanía region (Erazo, Amigo, & Bustos, Reference Erazo, Amigo and Bustos2005). This study showed a lower height in Mapuche subjects. The differences decreased among subjects living in counties of more resources and less family poverty. Bustos, Muñoz, Vargas, and Amigo (Reference Bustos, Muñoz, Vargas and Amigo2009) analyzed the development of the nutritional situation of indigenous and nonindigenous Chilean schoolchildren, reporting that the stunted growth and lower weight of Mapuche children were not so much the result of hereditary differences but of the conditions of poverty under which they grow up. In addition, Amigo, Bustos, and Kaufman (Reference Amigo, Bustos and Kaufman2010) have shown the absence of large disparities in anthropometric measures among Chilean indigenous and nonindigenous newborns, with a birthweight that remained stable over the 5 years of observation. All together this evidence suggest that differences in anthropometric measures between Mapuche and the nonindigenous population are associated with the socioeconomic status rather than with intrinsic ethnic differences.
Besides socioeconomic status, physical growth could also be associated with access to healthcare services. In Chile, various (sub)cultures developed different strategies for healthcare access. Ancestral medicinal practices are often recognized as a part of the primary healthcare system, and that is particularly true for the Mapuche medical care (Torri & Laplante, Reference Torri and Laplante2013). Whether the differences in primary medical care received by Mapuche and nonindigenous individuals influenced the clinical outcome and growth remains unexplored.
The Development of Behavior Problems Among Mapuche and Non-Mapuche
The development of socioemotional competence during early childhood is an important foundation for children's later social adaptation and success (Raver, Reference Raver2002). The emerging ability of young children to form close and secure adult and peer relationships in socially and culturally appropriate ways is strongly associated with the rearing environment. Several variables including, socioeconomic status, child care quality, ethnic background, and gender can influence the development of problematic socioemotional behavior (Miner & Clarke-Stewart, Reference Miner and Clarke-Stewart2008). Children from more vulnerable socioeconomic environments consistently show more problem behaviors, compared to their wealthier peers (Berger, Paxson, & Waldfogel, Reference Berger, Paxson and Waldfogel2009).
Behavior problems are a wide set of conducts related to two broad-band dimensions of psychopathology in children: internalized and externalized problems (Achenbach, Reference Achenbach1966). Internalizing problems are related to inhibited overcontrolling problems that are inner directed (e.g., depression, anxiety, somatization, etc.), and externalizing problems are related to aggressive, antisocial undercontrolling behaviors that are manifested externally (e.g., aggression, defiance, or hyperactivity) and are outer directed (Holland, Malmberg, & Peacock Reference Holland, Malmberg and Peacock2017).
Given the rapid changes in different domains (cognitive, linguistic, emotional, etc.) in toddlerhood and the preschool years, these behaviors have potential to become an indicator of long-term difficulties (Briggs-Gowan & Carter, Reference Briggs-Gowan and Carter2008), and have been related to a series of antecedents such as poverty (Costello, Compton, Keeler, & Angold, Reference Costello, Compton, Keeler and Angold2003), psychological and behavioral parental control (Barber, Olsen, & Shagle, Reference Barber, Olsen and Shagle1994), parental stress (Neece, Green, & Baker, Reference Neece, Green and Baker2012), harsh discipline (McKee et al., Reference McKee, Roland, Coffelt, Olson, Forehand, Massari and Zens2007), and maternal mental health (Shaw, Connell, Dishion, Wilson, & Gardner, Reference Shaw, Connell, Dishion, Wilson and Gardner2009).
At this moment, very few studies on this topic have been conducted in Latin America. One study in Brazil found that behavioral and emotional problems in the preschool years persisted over preadolescence, especially for externalizing problems (Anselmi et al., Reference Anselmi, Barros, Teodoro, Piccinini, Menezes, Araujo and Rohde2008), showing evidence of continuity, stability, and predictability of behavioral problems in a developing country. In a large study conducted in 23 societies, Rescorla et al. (Reference Rescorla, Achenbach, Ivanova, Harder, Otten, Bilenberg and Dobrean2011) found that in comparison with the omnicultural mean, Chile had the highest score of total behavior problems in children from 1.5 to 5 years reported by their parents.
Empirical evidence demonstrating differences in socioemotional problems between Mapuche and nonindigenous children is missing. There is one study conducted by Vicente, Rioseco, Saldivia, Kohn, and Torres (Reference Vicente, Rioseco, Saldivia, Kohn and Torres2005), on prevalence of psychiatric disorders in Chilean adults older than 15 years of age, showing less prevalence among the Mapuche in affective disorders and other disorders. In another study of Chilean indigenous minority groups, Caqueo-Uríar et al. (Reference Caqueo-Uríar, Urzúa, Ferrer, Zúñiga, Palma and Escudero2014) also found that among the minority group, children showed lower scores in behavioral problems when compared to nonindigenous children according to their teachers. This result is also consistent with what Rothhammer et al. (Reference Rothhammer, Carrasco, Henríquez, Andrade, Valenzuela, Aboitiz and Rothhammer2005) found in similar populations on attention-deficit and hyperactivity disorder.
There is, however, data from other ethnic groups, in the United States, to suggest that African American males are considerably more likely to show behavioral problems due to their perceived inability to regulate their emotions and behavior (Gilliam & Shahar, Reference Gilliam and Shahar2006). However, one study, addressing ethnic differences in socioemotional development in preschool, showed that behavioral problems associated with ethnicity disappear when the teacher–child ethnicity match was taken into consideration (Scott & Howex, Reference Scott and Howex2011).
The Role of Ethnicity and Socioeconomic Status on Child Development
The differences in child rearing environments between different ethnic groups have been studied in the United States among others by Bradley, Corwyn, McAdoo, and Coll (Reference Bradley, Corwyn, McAdoo and Coll2001). They have shown that effects of poverty on the home environment are more pronounced than are the effects of a particular ethnicity. Other studies reported that ethnic minority parents show less sensitive behavior than majority parents (Spiker, Ferguson, & Brooks-Gunn, Reference Spiker, Ferguson and Brooks-Gunn1993; van IJzendoorn, Reference van IJzendoorn1990; Yaman, Mesman, van IJzendoorn, Bakermans-Kranenburg, & Linting, Reference Yaman, Mesman, van IJzendoorn, Bakermans-Kranenburg and Linting2010). However, a review suggested that these differences are most probably caused by socioeconomic differences (Mesman, van IJzendoorn, & Bakermans-Kranenburg, Reference Mesman, van IJzendoorn and Bakermans-Kranenburg2012). Children from low-income families seem vulnerable to the accumulation of several risk conditions, which become an impediment for reaching their potential across different developmental domains (Grantham-McGregor et al., Reference Grantham-McGregor, Cheung, Cueto, Glewwe, Richter and Strupp2007). Nevertheless, it is still possible that the interpretation of children's signals is subject to cultural beliefs and customs (Bornstein et al., Reference Bornstein, Tamis-LeMonda, Tal, Ludemann, Toda, Rahn and Vardi1992; Keller & Otto, Reference Keller and Otto2009). Despite current progress, it is still difficult to attribute final causality to the complex construct of socioeconomic status. How socioeconomic status operates through multiple mechanisms to affect developmental trajectories varying across ethnic groups remains unclear and deserves further investigation (Bradley & Corwyn, Reference Bradley and Corwyn2005).
Sroufe (Reference Sroufe1997) proposed that maladaptation is the result of a series of interactions between risk and protective factors that could arise from the environment and/or endogenous characteristics. From this perspective, behavioral problems are not a static psychopathological condition, but a maladaptation that leads to a probabilistic pathway to a future disorder.
Research in the developmental trajectories from the early onset of externalizing problems has shown that the mechanism from which they could lead to a disorder is through developmental cascades (Masten & Cicchetti, Reference Masten and Cicchetti2010). One example in the literature shows that behavior problems are a strong predictor of substance abuse in adolescence (Dodge et al., Reference Dodge, Malone, Lansford, Miller, Pettit and Bates2009), and recent evidence considers the interaction between externalizing and internalizing problems to understand probability and amount of substance use (Colder et al., Reference Colder, Frndak, Lengua, Read, Hawk and Wieczorek2018).
The Encuesta Longitudinal de la Primera Infancia [Longitudinal Survey of Early Childhood]
The Chilean Encuesta Longitudinal de la Primera Infancia [Longitudinal Survey of Early Childhood] is a joint effort by the Chilean Ministry of Education and the University of Chile to collect data about early childhood that allows us to evaluate the effect of government child-related policies. A representative sample of more than 15,000 children from 6 months up to 5 years old and their family from all over the country are being followed in a longitudinal study. Caregivers and relatives are interviewed, and children and caregivers are subjected to a battery of anthropometric measurements and psychological tests. In addition, demographic data is registered. The instruments used and the data collected at the first two measurement rounds, in 2010 and 2012, respectively, were available to our research team.
Currently, only very few articles have been published using data available from the Encuesta Longitudinal de la Primera Infancia [Longitudinal Survey of Early Childhood] study. They mainly have focused on the socioeconomic impact on the development of early childhood. For instance, Behrman, Palma, and Puentes (Reference Behrman, Palma and Puentes2017) analyzed data of children´s differences on anthropometrics measures, and they showed that there were no significant differences between low- and high-income families. At birth, there is a slight difference favoring the poorest in height, but it disappears over time. The authors indicate that the major prevalence of Cesarean and shorter gestation in the richest families (three times higher than the poorest) could explain this difference. They also concluded that wealth disparities are more noticeable after the second year of life, especially in cognitive skills more than in anthropometrics, but education and cognitive ability of the mother are also an important factor.
Furthermore, Kagawa, Fernald, and Behrman (Reference Kagawa, Fernald and Behrman2016) explored the association between weight and behavioral problems in children. Using the Encuesta Longitudinal de la Primera Infancia [Longitudinal Survey of Early Childhood] data set, they found that this association exists but only at the age to start elementary school. Children younger than 6 years old do not show this association. This finding was driven by girls and not significant for boys. Reynolds, Fernald, and Behrman (Reference Reynolds, Fernald and Behrman2017) also studied a sample from the Encuesta Longitudinal de la Primera Infancia [Longitudinal Survey of Early Childhood] data set examining the relation between mother's labor market participation and child development outcomes. Taking into account language, cognitive, and socioemotional development, they concluded that in the Chilean population, contrary to several previous results in other samples, children performed better on all these outcomes when mothers participates full-time in the labor market during the first 2 years of life than in cases where mothers worked less. Authors indicated that these results may be associated to more access to toys and other resources, and reduced maternal stress (Reynolds et al., Reference Reynolds, Fernald and Behrman2017).
Only one study using the Encuesta Longitudinal de la Primera Infancia [Longitudinal Survey of Early Childhood] data has focused on ethnic differences (Cárcamo, Vermeer, van der Veer, & van IJzendoorn, Reference Cárcamo, Vermeer, van der Veer and van IJzendoorn2015). This study provided empirical data describing the childcare environment of children raised in the Mapuche and nonindigenous Chilean population. This work reported very small differences in the quality of the childcare environment, and several disadvantageous conditions for Mapuche children. This comparison revealed that socioeconomic status plays a major role to explain the developmental differences.
In summary, very little is known about early childhood development in the Mapuche ethnic group, and empirical information on change in physical and socioemotional parameters is scarce. Therefore, we first performed a comprehensive analysis of anthropometric and behavioral outcomes in Chilean toddlers from different ethnic groups based on a longitudinal, multidimensional, contextualizing, and representative data set. We then analyzed which individual, contextual, or environmental factors are associated with putative differences in toddlers’ development across 2 years.
Our first research question was whether there are differences in development of children growing up within the Mapuche culture as compared with nonindigenous children in Chile. Based on the available literature we propose two hypotheses:
Hypothesis 1: Mapuche Chilean children will have similar physical growth outcomes across time points, but more behavioral problems than nonindigenous children.
Our second research question was whether child development may also, or even more strongly, be related to socioeconomic status of the family compared to ethnicity.
Hypothesis 2: Socioeconomic status will be more strongly associated with developmental outcomes in Chilean children in various domains of growth and development than ethnicity.
Method
Participants
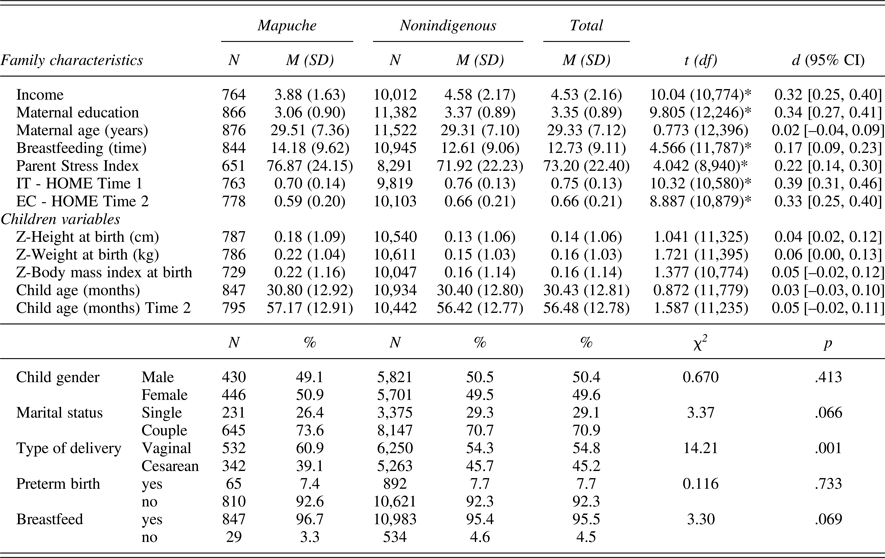
The Encuesta Longitudinal de la Primera Infancia [Longitudinal Survey of Early Childhood] data were available for two time points, in 2010 and 2012, respectively. The initial sample at the first time point included 15,175 children. To select the sample, we first decided to involve in our analysis families where the target child is raised by the mother mainly. This criterion emerged from the fact that 98.8% (N = 14,996) of the families reported that the mother is the main caregiver. We then selected those cases that were interviewed at both time points for analysis (n = 12,607). Finally, we selected from those, families where the mother reported to be part of the Mapuche indigenous group and those who did not belong to any indigenous group. Thus, 12,398 children and their mothers were included in our analysis: 876 (7%) families belonged to the Mapuche ethnic minority group and 11,522 (93%) families belonged to the majority group in Chile. The percentage of missing data for background variables ranged between 0.1% for breastfeeding and 27.9%. for the parental stress index variable. Table 1 reports the sample sizes for all the background variables. For outcome variables, sample sizes are displayed in Table 2.
Descriptive statistics of demographic and family characteristics

Note: Descriptive statistics of demographic and family characteristics. Upper section shows N, mean (M), and standard deviation (SD) differences between ethnic groups were compared with t test t (df) and effect size (d). The lower section shows correlation of different proportions as assessed by chi-squared test (χ2).*p < .001.
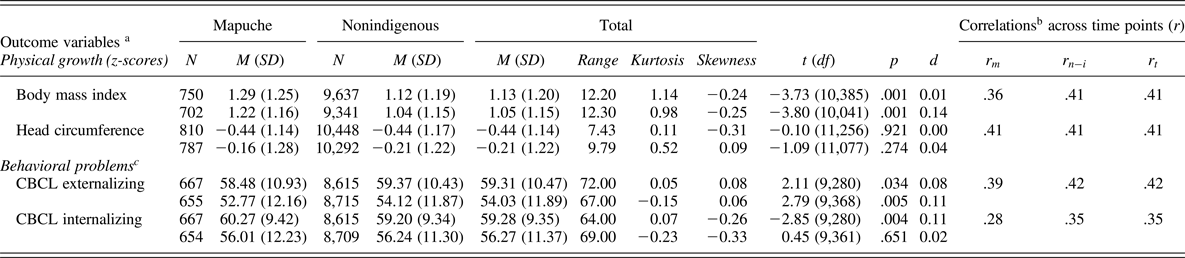
Descriptive statistics, groups comparisons, and Pearson correlations of outcome variables by ethnic groups at both time points

Note: aTime 1 above and Time 2 below. bp values for correlations are <.001. Correlations are presented first for Mapuche (r m), nonindigenous (r n-i), and total sample (r t).
c The values are t scores. CBCL, Child Behavior Checklist.
To have a complete data set for regression analysis, we imputed data for variables with missing data. The selected imputation model was the E-M algorithm (Hedderley & Wakeling, Reference Hedderley and Wakeling1995). For results on hierarchical and stepwise regressions without imputation, see Appendix A Tables A.1 to A.4. Regressions in the imputed and original data set converged to the same conclusions.
Mean age of all mothers was 29.33 years (SD = 7.12) at Time 1. Mean age of the children was 30.43 months (SD = 12.81; range from 7 to 58 months) at Time 1, and 56.48 months (SD = 12.78; range from 33 to 83 months) at Time 2. Fifty percent of the sample consisted of boys, and 29% were raised by single mothers. Table 1 shows the background variables and family characteristics, comparing Mapuche and nonindigenous families.
Procedure
The first time point for assessment was in 2010. During a first visit, the interviewers (n = 467; 78% female) introduced the Encuesta Longitudinal de la Primera Infancia [Longitudinal Survey of Early Childhood] through a letter that explained the study, highlighting its importance for the development of new public policies and clarifying the anonymity and voluntary participation. Interviewers tried to engage the participants, collected demographic data, and arranged the second visit. The second visit was conducted by 326 observers (85% female), and all of them had a higher education in the social sciences, mostly psychology. The goal of the second visit was to measure the child's physical and socioemotional development and the quality of the home environment. Observations during the second visit were completed for 91.6% of the families interviewed during the first visit. Interviewers received an extensive training explaining the goal of the study, details of the survey, and the standardization of the procedures. The data collection took place in 2010 in a time range of 6 months; all the surveys were double-checked by supervisors, and 10% of the interviews were also supervised during data collection to ensure the high quality of the process and the data.
The second time point for assessments was in 2012, and the same procedure was followed. The first visit was intended to reengage the family into the study and to make an appointment for the second visit by a professional psychologist. All the instruments were applied in one session, and no order of them are reported or available for our research team.
Instruments
Anthropometric variables: Body mass index
Weight and height at birth was reported by the parents during the first interview. Head circumference at birth was not asked of the caregivers; therefore, this data was not available for analysis. Measurements were performed at two different time points as previously reported (Kagawa et al., Reference Kagawa, Fernald and Behrman2016): after receiving formal training on proper measurement of anthropometrics, interviewers weighed and measured the children during visits to the homes. Children under 2 years of age were weighed in the arms of their caretaker and the caretaker's weight was subsequently subtracted. Children over 2 years old were weighed individually. A SECA brand digital scale was used for all weight measurements. To measure length, children under 2 years old were measured lying down. A parent assisted the researcher in keeping the child still and straight, and the interviewer used a ruler or a book and masking tape to mark the child's length against a measuring tape attached to a flat surface. To measure height in children over the age of 2, children were assessed standing with their heels, buttocks, shoulders, and head making contact with a wall. The interviewer marked their height against the wall using a book or ruler and masking tape. All were measured barefoot and without hair adornments.
Age- and sex-standardized weight, height, and Body Mass Index across time points (birth, and first and second wave), and its related z-scores were calculated with a custom implementation of the “igrowup.standard” function in R V3.4.4, following World Health Organization recommendations (de Onis et al., Reference de Onis, Garza, Victora, Onyango, Frongillo and Martines2004; WHO, 2011).
Head circumference was measured with a plastic wrap placed over the child's ears and turning around the head. The obtained measure was then recorded in centimeters. The data was normalized for age and sex with the “sdschild” R package using the WHO and European (United Kingdom) reference tables.
Behavioral problems
The behavioral problems were measured using the Child Behavior Checklist (CBCL; Achenbach & Rescorla, Reference Achenbach and Rescorla2000). This instrument is widely used to measure three general scales: internalizing, externalizing, and total problems. The complete test is composed of 90 items with concrete behavior descriptions. The answer options are untrue, sometimes true, and always true. In the Encuesta Longitudinal de la Primera Infancia [Longitudinal Survey of Early Childhood], in addition to the version for children between 18 months and 72 months old, a CBCL version for older children was used with a limited number of children (n = 1,769) and no children were measured with this version at the first wave, which is why we only considered for analysis CBCL scores for young children at both time points.
Background variables
Ethnicity
The ethnicity of the family was defined by self-report. Families were considered as belonging to Mapuche when the mother stated in the interview that they belonged to this minority ethnic group.
Income
Mothers or main caregivers were asked for the monthly family per capita income in Chilean Pesos (CLP). This resulted in the following 10 deciles: 1 = less than $64,000 ($118 USD); 2 = between $64,000 and $132,000 ($244 USD); 3 = between $132,000 and $250,000 ($462 USD); 4 = between $250,000 and $350,000 ($647 USD); 5 = between $350,000 and $450,000 ($832 USD); 6 = between $450,000 and $650,000 ($1,201 USD); 7 = between $650,000 and $850,000 ($1,571 USD); 8 = between $850,000 and $1,050,000 ($1.940 USD); 9 = between $1,050,000 and $1,250,000 ($2.310 USD); and 10 = more than $1,250,000. For analysis, we divided the sample into thirds, where low income represents the first three deciles, from no salary to the minimal Chilean salary. The medium family income included deciles 4, 5, and 6 (29.6% of the total sample), and the high income included all the sample over decile 7 (28.2%).
Maternal educational level
The level of maternal education was self-reported using 19 categories ranging from no education to postgraduate. We transformed these categories into a 5-point scale (1 = no education or incomplete elementary; 2 = incomplete secondary school; 3 = secondary school; 4 = vocational education; and 5 = university studies).
Marital status
Mothers reported at the interview if they were single, married, or divorced. We grouped in the category single mother those who were single, separated, divorced, or widowed. For the category couple, we considered those mothers who indicated to be married or cohabiting. A separate variable indicated whether the biological father was living with the child.
Parental stress
The Parent Stress Index (Abidin, Reference Abidin1995) was applied during the second wave of the Encuesta Longitudinal de la Primera Infancia [Longitudinal Survey of Early Childhood]. Thirty-six items of multiple choice were used in an abbreviated version of the original scale. The scale reports a global score, based on the mother's perception of the parental tasks. Higher scores mean higher level of stress.
Obstetric parameters
Information regarding type of delivery and breast feeding was collected by interviewers during the first visit at Time 1. Mothers were asked whether they underwent Cesarean delivery (yes/no), and for the period of breastfeeding (how many months).
Mother's personality characteristics neuroticism
The Big Five Inventory (Casullo, Reference Casullo2000) was applied to all caregivers. The scale is a self-report inventory and consist of 44 items rated on a 5-point scale. The instrument measures five dimensions of personality (extraversion, agreeableness, conscientiousness, neuroticism, and openness). For our analysis, we decide to use the neuroticism dimension, as there are important variables measured as a self-report.
Quality of home environment
Quality of the home environment was measured with an adapted version of the Infant/Toddler Home Observation for Measurement of the Environment (IT-HOME) at Time 1 in 10,582 families in the analyzed sample. For the majority of the sample (n = 10,641; 97.7%), the adaptation of the Early Childhood Home Observation for Measurement of the Environment (EC-HOME; Caldwell & Bradley, Reference Caldwell and Bradley2003) was used at Time 2; in 240 families (4.6% Mapuche), the IT-HOME was used at Time 2. In both measures, a restricted number of items were selected (32 items for IT-HOME at Time 1 and 22 of the 32 items at Time 2, and 16 items of the 22 for EC-HOME). Through the different time points and versions, the study kept measuring the same subscales of the HOME: responsivity, acceptance, and provision of materials. The IT-HOME at Time 1 measured two more subscales: organization and variety. Bivariate correlations between IT-HOME at Time 1 and Time 2, and between IT-HOME and EC-HOME were comparable (respectively, r = .24 and r = .26). Internal consistency of both instruments was good, with a Cronbach's α of 0.77 for the IT-HOME at Time 1, α = 0.75 for IT-HOME at Time 2, and α = 0.81 for EC-HOME at Time 2. Because of comparable content of items, correlations, and reliabilities, we decided to aggregate scores across IT-HOME and EC-HOME (at Time 2), resulting in one score for Time 2 (hereafter labeled as EC-HOME).
All the outcome variables and the HOME scale were measured at both time points, whereas background variables were collected at Time 1 during the first interview.
Data analytic strategy
We explored differences in background variables of Mapuche and nonindigenous ethnic groups. As independent samples t test was performed on family characteristics and children variables. For all means comparisons, we calculate the Cohen's d effect sizes with the online calculator Practical Meta-Analysis Effect Size Calculator. The formula used for Cohen's d was d = M 1 – M 2 / σpooled. For interpretation of effect size, we considered 0.8, 0.5, and 0.2 as large, medium, and small, respectively (Cohen, Reference Cohen1988). Body mass index, head circumference, and the development of internalizing and externalizing behavioral problems were selected as development outcomes. A t test for independent samples was used to test differences in outcomes across time points between Mapuche and nonindigenous children. To test the association between income and development outcomes, a series of univariate analysis by one-way analyses of variance (ANOVAs) across the three income groups (low, medium, and high) was conducted. The post hoc analysis (Bonferroni) and eta square were used to identify differences and to calculate effect sizes between groups.
To explore the contribution of ethnicity to the prediction of selected outcomes, a series of hierarchical regressions was performed. In order to identify additional significant predictors of child development outcomes, stepwise regression analysis was conducted on body mass index, head circumference, and development of behavioral problems (internalizing and externalizing). Normality of residual variances, homoscedasticity, and absence of multicollinearity was tested for each regression. Finally, for significant predictors, the moderator role of ethnicity was tested using an interaction model based on the multiple regressions. In the first step, the measurement of the variable at the first time point was entered, in the second step centered predictors were added, and in the final step each interaction product between ethnicity and a significant predictor was entered. A significant interaction with ethnicity was a prerequisite for testing the regression model in each of the two groups, Mapuche and non-Mapuche, in order to examine whether in one of the groups the predictive model would be different from the regression model in the total group.
Results
First, we tested for differences in means of background variables between Mapuche and nonindigenous families. Statistically significant differences were found in income and maternal education (d = 0.32; d = 0.34, respectively). Mapuche families showed lower income per capita (M = 3.88, SD = 1.63) than nonindigenous families (M = 4.58, SD = 2.17) and lower educational level on average (M = 3.06, SD = 0.90) than the majority group (M = 3.37, SD = 0.89).
The quality of the home environment was significantly higher for the nonindigenous families across time points with moderate effect sizes (d = 0.45 for Time 1 and d = 0.33 for Time 2). In addition, Mapuche mothers showed higher scores on the parental stress index (M = 76.87, SD = 24.15), than the nonindigenous mothers (M = 71.92, SD = 22.33), with a small effect size (d = 0.22).
Considering the existence of differences in primary healthcare in Mapuche versus nonindigenous individuals in Chile (Torri & Laplante, Reference Torri and Laplante2013), we analyzed several clinical variables known to be related with medical care during the perinatal period, such as type of delivery and breast feeding.
Regarding perinatal maternal variables (see Table 1), the overall observed obstetric intervention rate was 45 per 100 live births. Our analysis revealed higher prevalence of Cesarean delivery in nonindigenous (45.7%) as compared to Mapuche mothers (39.1%, p = .001). The breast-feeding period assessed in months was statistically higher (d = 0.17) for the Mapuche group (M = 14.18, SD = 9.62) than the nonindigenous group (M = 12.61, SD = 9.06).
Physical growth
We then analyzed the trajectory of anthropometric measurements including body mass index and head circumference across available time points. Variables related to physical growth were within the expected range for the Chilean population for both Mapuche and nonindigenous children. Body mass index was computed from measured weight and height and then adjusted by age using the World Health Organization references and values were reported in z-score (de Onis et al., Reference de Onis, Garza, Victora, Onyango, Frongillo and Martines2004; WHO, 2011). At birth the body mass index was M = 13.67 (SD = 1.46; z-score = 0.16; see Table 1). Mapuche newborns and nonindigenous children had similar body mass index with no significant differences.
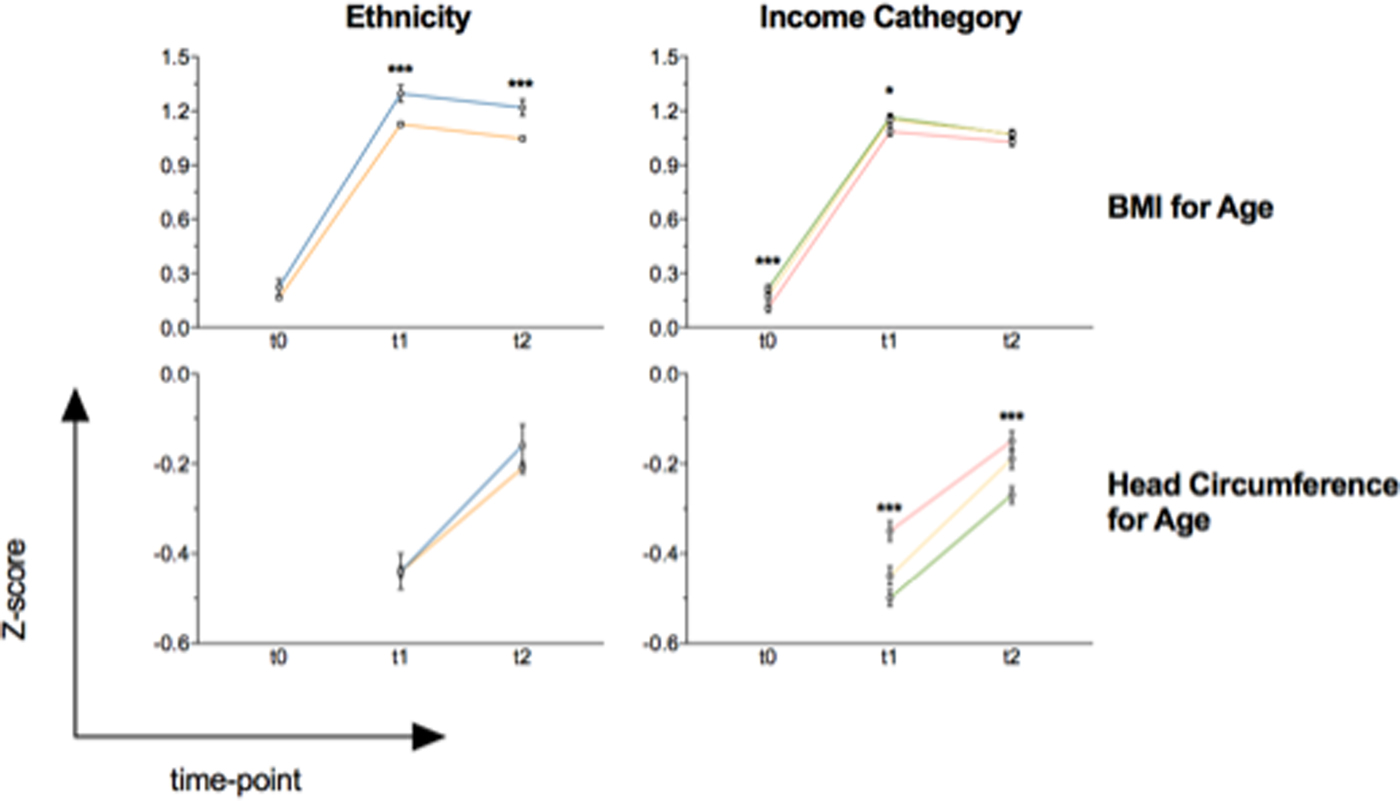
Children were assessed at the first time point at a mean age of 30.43 months (SD = 12.81). The mean z-score for body mass index was M = 1.27 (SD = 1.19), and for head circumference was M = –0.44 (SD = 1.15). At the second time point, at a mean age of 56.48 months (SD = 12.78), the mean z-score for body mass index was M = 1.05 (SD = 1.15) and for head circumference was M = –0.21 (SD = 1.12). Correlations between the first and second time points on physical growth ranged from r = .36 to r = .41 (all p < .001; see Table 2). At follow-up there were statistically significant differences between Mapuche and nonindigenous children for body mass index (d = 0.01 and d = 0.14), at both time points, respectively (see Table 2 and Figure 1).
Trajectories of physical development as assessed by age-adjusted child body mass index and head circumference. Body mass index was analyzed at three different time points: Time 0, birth; Time 1, first interview; Time 2, second interview. Head circumference was measured at two time points: Time 1, first interview Time 2, second interview. (a) Physical development according to ethnicity; and (b) physical development according with income background. Significance of cross-sectional analysis is indicated for each time point, for two groups comparison t tests are reported, and for three-group comparison, one-way analysis of variance significance is indicated.*p < .01.**p < .001.

Next, we analyzed whether differences in body mass index or head circumference are associated with the socioeconomic status. A one-way ANOVA was performed to reveal univariate differences in body mass index, and head circumference between low, medium, and high income across time points. At birth, there were significant differences on body mass index between groups, F (2, 9405) = 7.135, p = .001, η2 = .001 (see Figure 1). Post hoc analysis (Bonferroni corrected) showed that the low-income group had a higher z-score on body mass index (M = 0.21, SD = 1.15) than the high-income group (M = 0.10, SD = 1.15), and the difference was statistically significant (p = .001). There were no differences between the medium-income and the other two groups. Statistical differences in body mass index between income groups were found at the first measured time point, F (2, 9114) = 3.496, p = .030, η2 = .001. Post-hoc analysis (Bonferroni) showed that there is a significant difference between the low-income group and the high-income group (p = .030). The low-income group showed higher score (M = 1.16, SD = 1.21) than the high-income group (M = 1.08, SD = 1.17). There was no significant difference between the medium-income group and the other two groups. Post hoc analysis showed no statistical differences at Time 2 between income groups, F (2, 9625) = 1.435, p = .238.
Head circumference was different between income groups at both time points: first time point, F (2, 9873) = 13.497, p = .001, η2 = .003; second time point, F (2, 10624) = 8.370, p = .001, η2 = .002. Post hoc analysis showed that for the two time points, the low-income group had a smaller head circumference (M Time1 = –0.50, SD = 1.14; M Time2 = –0.27, SD = 1.14) than the high-income group (M Time1 = –0.35, SD = 1.14; M Time2 = –0.15, SD = 1.14), and these differences are significant (p = .001 for both). For the medium-income group at the first time point (M Time1 = –0.45, SD = 1.16) differences were statistically significant when compared with the high-income group at the first time point (p = 003), and not with the low-income group (p = .303). At the second time point, the post hoc analysis showed a significant difference (p = .017) between the low-income group (M = –0.27, SD = 1.23) and the medium-income group (M = –0.19, SD = 1.23). There was also a significant difference (p = .001) between the low-income group and the high-income group (M = –0.15, SD = 1.20), and no difference (p = .854) between the medium-income and high-income groups.
A series of hierarchical regressions were performed to explore the contribution of ethnicity on body mass index and head circumference. Table 3 shows that the contribution is weak and only significant for body mass index measured at Time 2 (β = 0.021, p = .014), after confounders were added into the equation. For head circumference, ethnicity did not contribute to the prediction.
Association between ethnicity and physical growth at Time 2 in the Chilean ELPI sample

Note: For body mass index, Models 1–3 N = 12,398 and Models 4–6 N = 11,060. For head circumference, Model 1 N = 11,079; Models 2–3 N = 10,145; Models 4–6 N = 10,128.
Models were constructed using multiple hierarchical linear regression. Values are regression coefficients, standard errors, and p values. Model 1. Without adjustment. Model 2. Model 1 + body mass index at birth / head circumference at Time 1. Model 3. Model 2 + child gender. Model 4. Model 3 + preterm birth + weeks of gestation + breastfeeding + type of delivery. Model 5. Model 4 + income + education + marital status + parental stress. Model 6. Model 5 + Home Observation for Measurement of the Environment at Time 1 + Home Observation for Measurement of the Environment at Time 2.
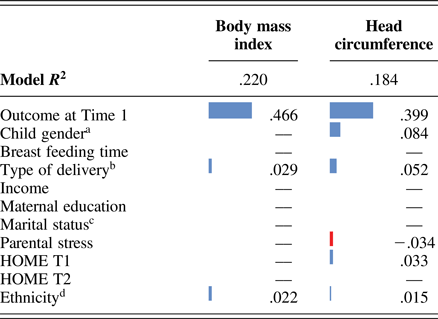
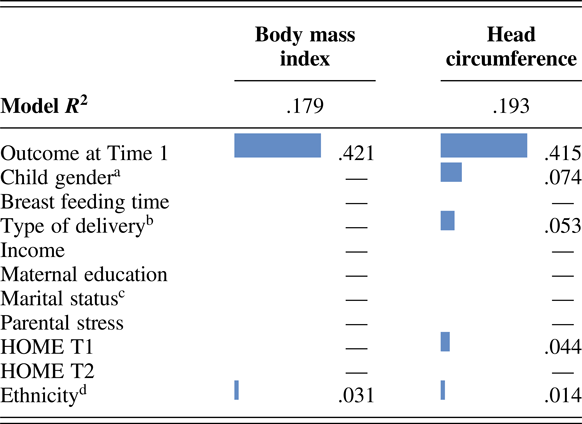
To identify significant predictors of body mass index and head circumference, a stepwise regression analysis was performed. As shown in Table 4, at average age of 4.5 years, the most important predictor for physical development was the previous measurement at average age of 2.5, and the remaining significant predictors showed a minimal contribution to the outcomes. Child gender contributed significantly to predict head circumference (β = –0.021 to 0.084), and type of delivery did predict body mass index (β = 0.034), and head circumference (β = 0.052). Parental stress negatively predicted circumference (β = –0.034). The quality of the home environment at 2.5 years of age was a significant predictor of head circumference. Finally, ethnicity was a significant predictor only for body mass index (β = 0.008, p < .01). Subsequently, we tested whether significant predictors were moderated by ethnicity, but no significant role of interaction terms was found neither for body mass index (Ethnicity × Type of Delivery interaction p = .236) nor for head circumference (Ethnicity × Type of Delivery interaction p = .708, Ethnicity × Gender interaction p = .069, Ethnicity × Parental Stress interaction p = .227, Ethnicity × HOME1 interaction p = .478).
Stepwise regression model to predict physical growth at Time 2

Note: Standardized beta value from the final equation is reported only for significant predictors, except ethnicity that is always reported. Blue bars represent positive beta values and red bars negative values.aGender: 0 = male, 1 = female. bType of delivery: 0 = normal, 1 = Cesarean. cMarital status: 0 = single, 1 = couple. Ethnicity: –1 = nonindigenous, 1 = Mapuche. p value is reported for ethnicity:* < .05;** < .01;*** < .001
Behavioral problems
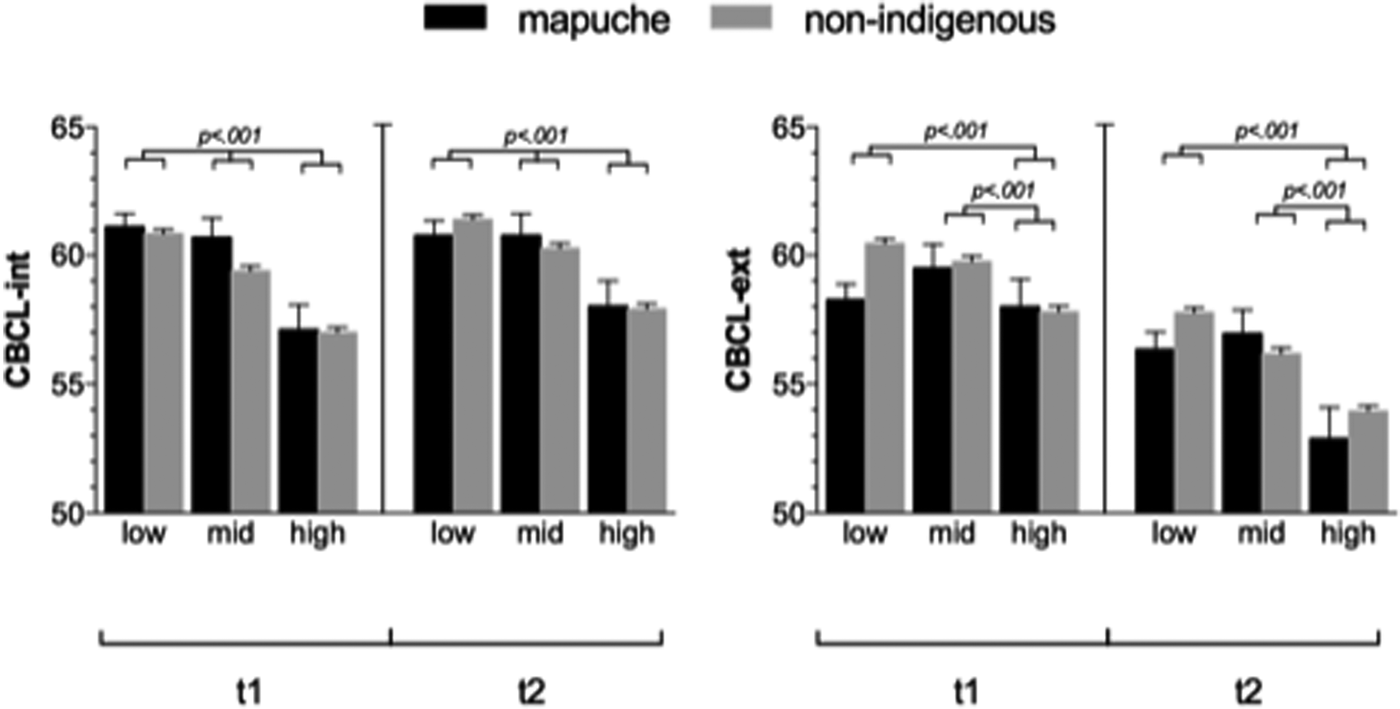
According to the CBCL reports, for the total population, the mean T scores at the first time point for externalizing (M = 59.31, SD = 10.47) and internalizing (M = 59.28, SD = 9.35) were within the normal range (T below 60), but there were significant differences between the ethnic groups. Mapuche children showed less externalizing behavioral problems (M = 58.48, SD = 10.93) than nonindigenous children (M = 59.37, SD = 10.43) at the first time point (p = .03, d = 0.08), and statistically significant (p = .004, d = 0.11) more internalizing problems (M = 60.27, SD = 9.42), than the nonindigenous children (M = 59.29, SD = 9.34). At the second measurement, the T scores were lower for all scales (see Table 2), and only the externalizing behavior problems remained significantly different (p = .005, d = 0.11) between Mapuche (M = 52.77, SD = 12.16) and nonindigenous children (M = 54.12, SD = 11.87), higher for the latter group. Across time, the CBCL scores for externalizing and internalizing correlated from r = .28 to .42 (see Table 2).
One-way ANOVA analysis showed significant differences between groups for low, medium, and high income in externalizing behavioral problems, F (2, 8159) = 39.003, p = .001, and internalizing behavioral problems, F (2, 8159) = 121.452, p = .001, at Time 1. Furthermore, at Time 2, there were also significant differences between income groups in externalizing behavioral problems, F (2, 8984) = 32.698 p = .001, and internalizing behavioral problems, F (2, 8977) = 83.079, p = .001. All the effect sizes of these differences were small (η2 = .007 to .029). Post hoc analysis (Bonferroni) indicated that for externalizing behavior problems at Time 1, the low-income group (M = 60.24, SD = 10.58) and medium-income group (M = 59.73, SD = 10.25) showed a significant higher score (p = .001 for both) than the high-income group (M = 57.81, SD = 10.17). No significant differences were found between low- and medium-income groups (p = .195). For internalizing behavioral problems at Time 1, low-income showed higher scores (M = 60.89, SD = 9.33) than the medium-income group (M = 59.47, SD = 8.97) and the high-income group (M = 57.01, SD = 9.27). There is also a significant difference between the last two groups. All differences are p = .001.
For externalizing behavior problems at Time 2, the low-income group (M = 54.84, SD = 12.13) and the medium-income group (M = 54.16, SD = 11.87) showed a significant higher score (p = .001 for both) than the high-income group (M = 52.40, SD = 11.35). No significant differences were found between the low- and medium-income groups (p = .072). For internalizing behavioral problems at Time 2, the low-income group showed higher scores (M = 57.64, SD = 11.63) than the medium-income group (M = 56.22, SD = 11.43) and the high-income group (M = 53.91, SD = 10.55). There is also a significant difference between the last two groups. All differences are p < .001 (see Figure 2 for details).Figure 2
Development of behavior problems as assessed by Child Behavior Checklist (CBCL) score. The x-axis depicts income categories: low, medium, high, and bar colors adscription to the Mapuche ethnic group (see text for details). Variables were analyzed at two time points: Time 1, first interview; Time 2, second interview.

A series of hierarchical regressions were performed to examine the ethnicity contribution to behavioral problems. Table 5 shows that without any covariates Mapuche children showed less externalizing problem behaviors at Time 2 (age M = 56.48), but internalizing problems did not differ between ethnicities. However, for externalizing and internalizing problems, ethnicity predicted positive change across the two time points (Mapuche children developed lower levels of behavior problems from Time 1 to Time 2) when demographics and parental stress and neuroticism were added to the equation (Model 4).
Association between ethnicity and Child Behavior Checklist (CBCL) problem behaviors at Time 2 in the Chilean ELPI sample (N = 12,398)

Note: Models were constructed using multiple hierarchical linear regression. Values are regression coefficients, standard errors, and p values. Model 1. Without adjustment.
Model 2. Model 1 + CBCL at Time 1. Model 3. Model 2 + child age + child gender. Model 4. Model 3 + income + education + marital status + parental stress + Big Five Inventory neuroticism.
Model 5. Model 4 + Home Observation for Measurement of the Environment at Time 1 + Home Observation for Measurement of the Environment at Time 2.
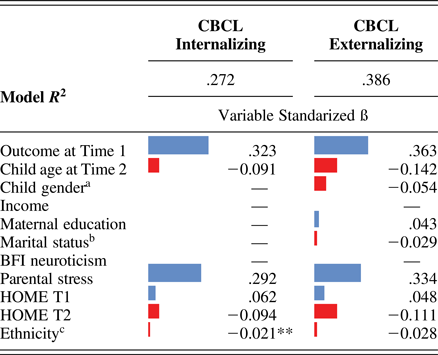
The stepwise regression analysis of behavioral problems identified the previous score (at age 2.5 years) and parental stress as the most significant predictors with a β ranging from 0.319 to 0.360 for the 2.5-year measurement and 0.288 to 0.344 for parental stress. Child age contributed negatively to internalizing and externalizing problems (β = –0.090; β = –0.174, respectively). Female gender predicted negatively externalizing problems (β = –0.053). The quality of the home environment contributed to the development of behavioral problems when measured at Time 1 (β = 0.067 and β = 0.045, for internalizing and externalizing problems, respectively) but negatively when measured at Time 2 (β = –0.092 and β = –0.114, for internalizing and externalizing problems, respectively). Ethnicity negatively contributed to predict behavioral problems in the final equation (β = –0.023 and β = –0.026, for internalizing and externalizing problems, respectively), meaning that Mapuche children showed less behavior problems after controlling for potential confounders. Other background variables modestly contributing to behavioral problems are presented in Table 6.
Stepwise regression model to predict behavior problems at Time 2

Note: Standardized beta value from the final equation is reported only for significant predictors, except ethnicity, which is always reported. Blue bars represent positive beta values and red bars negative values. aGender:–1 = male, 1 = female. bMarital status: –1 = single, 1 = couple. cEthnicity: –1 = nonindigenous, 1 = Mapuche. p value is reported for ethnicity:* < .01;** < .001.
The analysis to test the moderator role of ethnicity on child behavioral problems showed that for externalizing problems, there was a significant interaction between mother's education and ethnicity (p = .047) as well as between parental stress and ethnicity (p = .014). However, for internalizing behavioral problems, no interactions were found (Ethnicity × Age interaction p = .190, Ethnicity × Parental Stress interaction p = .078, Ethnicity × HOME1 interaction p = .248, Ethnicity × HOME2 interaction p = .556). The interactions between parental stress and ethnicity as well as between ethnicity and maternal education for predicting the development of externalizing problems were analyzed by separated regressions. For the Mapuche group, parental stress was a somewhat less strong predictor (β = 0.422) than for the nonindigenous children (β = 0.469). For the Mapuche group, maternal education was a somewhat stronger predictor (β = 0.103) than for the nonindigenous group (β = 0.038). In both cases the direction of the association was the same.
Discussion
Results of this study suggest that children from the Mapuche ethnic group experience a different developmental niche than nonindigenous children. These differences in developmental conditions can be traced back at least to birth. Mapuche children seem to develop in less favorable conditions, in particular when looking at variables imposed by the wider socioeconomic context such as family income, maternal education, parenting stress, and quality of the home environment.
We first hypothesized that Mapuche children would have similar results on physical outcomes across time points, with more behavioral problems than nonindigenous children. Based on our data, the first hypothesis was only partially confirmed. Mapuche and nonindigenous children showed similar anthropometric parameters at birth. However, during follow-up, Mapuche children showed development trajectories characterized by an increasing body mass index.
Data at birth is consistent with previous results showing the absence of an ethnic disparity in birth weight and height despite substantial socioeconomic disadvantages in the indigenous population (Amigo et al., Reference Amigo, Bustos and Kaufman2010). Bustos et al. (Reference Bustos, Muñoz, Vargas and Amigo2009) have reported that throughout the last decade (years 1997–2005), there was a marked decrease in stunting in children with a strong indigenous background, accompanied by an increase in obesity (Bustos et al., Reference Bustos, Muñoz, Vargas and Amigo2009).
Converging with this overall secular trend, our study carried out one decade later found that the higher body mass index of Mapuche children confirm obesity as an emerging issue. Bustos et al. explain differences in height by socioeconomic factors. We hypothesized that socioeconomic status will predict outcomes in Chilean children in various domains of growth and development. At the physical level, lower income was associated with smaller head circumference and increased body mass index although the latter difference was no longer present at the second assessment time at 4.5 years of age. As head circumference may represent a crude estimate of overall structural brain development (Treit et al., Reference Treit, Zhou, Chudley, Andrew, Rasmussen, Nikkel and Beaulieu2016), all together this data suggests that low income in Chile still may impose restriction on physical development with potential implications for other developmental domains.
We tried to further understand the relative contribution of income and ethnicity in a stepwise hierarchical regression analysis, in which ethnicity remained a significant predictor only for body mass index and income did not contribute to the final equation. The identification of the main determinants of physical growth differences warrants future investigation.
We finally tested for differences in behavioral problems between ethnic groups. We were not able to support our hypothesis, as Mapuche children showed unexpectedly less externalizing behavioral problems across time points. In contrast, the Mapuche group showed more internalizing problems when children were 30 months old, but this difference disappeared during follow-up. When controlling for demographics and family variables, in a series of hierarchical regressions ethnicity remained a significant predictor of behavioral problems but in the opposite direction: Mapuche toddlers showed a (rather small) decrease in externalizing and internalizing problems across the 2-year time period. With respect to our second hypothesis, lower income level groups were associated with higher levels of externalizing and internalizing problems. However, when income was tested in a multivariate regression, it no longer predicted behavioral problems, whereas the quality of the home environment and parenting stress, and to a lesser extent and in opposite direction ethnicity, significantly contributed to the final equation. Furthermore, a higher level of maternal education was associated with more externalizing behavior problems.
Several studies have reported on the influence of culture on the expression of emotions (Halberstadt & Lozada, Reference Halberstadt and Lozada2011; Mesquita, Reference Mesquita2001). Particularly, collectivist cultures, such as Mapuche (Rommens, Reference Rommens2017), tend to discourage the free expression of negative emotions such as anger (Eid & Diener, Reference Eid and Diener2001; Markus & Kitayama, Reference Markus and Kitayama1991). This culture-related inhibition of negative emotions expression may explain differences in externalizing problems and may constitute an important resilience mechanism to protect Mapuche children from developing behavioral problems. Long-term follow-up should document possible negative effects of such inhibition of the expression of emotions.
The analysis of interaction terms showed that ethnicity acts as a moderator of parental stress and maternal education on the development of externalizing behavioral problems. In response to multiple and constant exposure to stressors such as prejudice and acculturation (Dunbar et al., Reference Dunbar, Saiz, Stela and Saez2000), Mapuche families may become more resilient to the effect of stress than the nonindigenous population during early parenting. However, maternal education acts as a stronger predictor of child behavioral problems in Mapuche families. It can be speculated that higher level of parent education in the Mapuche families may result in a higher level of collision between values, customs, and worldview. For instance, more educated mothers have in Chile more access to private schools, in contrast to less educated mothers who usually send their child to public schools, and the latter school system has higher levels of integration and cultural pertinence.
Our study also enabled the analysis of additional biomedical and developmental parameters. The obstetric intervention rate observed in our cohort is alarmingly surpassing more than three times World Health Organization recommendations. This data support previous results indicating that in Chile there is a higher rate of obstetric interventions as compared with other Organisation for Economic Co-operation and Development countries (Murray, Reference Murray2012). The Cesarean delivery rate is also increasing in many other countries, a phenomenon that may be associated to economic development (Molina et al., Reference Molina, Weiser, Lipsitz, Esquivel, Uribe-Leitz, Azad and Haynes2015) and cultural behavior (Stoll et al., Reference Stoll, Hauck, Downe, Payne and Hall2017). In our analysis, there was a higher prevalence of Cesarean delivery in nonindigenous as compared to Mapuche mothers, which may be the result of the differences in the worldview between the different (sub)cultures. We considered the type of delivery as a variable of interest in child development as a retrospective study reported that obstetric variables may have an impact on school achievement, intelligence, and neuropsychological development (Gonzalez-Mesa, Cazorla-Granados, & Gonzalez-Valenzuela, Reference Gonzalez-Mesa, Cazorla-Granados and Gonzalez-Valenzuela2016). In particular, vaginal delivery was associated to better scores in the areas of reading accuracy, total reading, phonetic orthography, visual orthography, calculation, writing, articulatory language, expressive language, spatial structuring, visual perception, nonverbal development, and matrixes.
Unexpectedly, we found that parental stress emerged as one of the most important predictors of the development of behavioral problems. According to the family stress model proposed by Conger and Donnellan (Reference Conger and Donnellan2007), parental stress is associated with significant developmental difficulties for children in particular when poverty is severe and persistent. Poverty and income inequality in Chile is a secular phenomenon affecting child environment (Cárcamo, van der Veer, Vermeer, & van IJzendoorn, Reference Cárcamo, van der Veer, Vermeer and van IJzendoorn2014). In our data set an inverse association was found between parental stress and components of socioeconomic status (maternal education and income, data not shown), further supporting this assumption; therefore, this issue deserves further investigation. In addition, modernization or contact with another—dominant—culture has been seen as a possible source of stress (García Coll et al., Reference García Coll, Akerman and Cicchetti2000). The Mapuche culture seems to be undergoing such a process of increasing interactions with the dominant culture, and is currently in the process of being assimilated into the mainstream Chilean society (Caniguan, Reference Caniguan2012). This two sources of stress, low income and increased acculturation pressures, could potentially explain the higher level of parenting stress. Parenting stress therefore seems a potentially fruitful target of policy and interventions to enhance the quality of the developmental niche for the children involved.
Despite the strengths of this study, including longitudinal data on one of the largest developmental samples worldwide, and certainly unique for lower resource countries, covering several domains of the child development, it has some limitations. The instruments were derived from research in WEIRD (Western, educated, industrialized, rich, and democratic) contexts and not specifically transformed and validated for use in ethnic minorities. Therefore, interpretation of tests may be affected by cultural factors even before data-analysis. However, CBCL, for example, has been widely used in non-Western societies as well, and with satisfactory predictive validity (Achenbach & Rescorla, Reference Achenbach and Rescorla2000). Finally, the lack of information on individual scale items within the instruments precluded the computation of test reliability for the current study. Nevertheless, all the instruments applied in the Encuesta Longitudinal de la Primera Infancia [Longitudinal Survey of Early Childhood] study have been extensively used and shown to be reliable and valid.
To our best knowledge, this is the first study based on longitudinal empirical data addressing differences in child development in a Mapuche compared to a nonindigenous population. Mapuche children seem to develop in an adverse environment characterized by lower income, higher parental stress, and lower maternal education. Some of these factors may affect physical and psychological child development. However, Mapuche families also seem to have developed several strategies driven by sociocultural patterns and customs that may help their children to strive and develop even with less behavioral problems than the nonindigenous population. Yet ethnicity seems to play a minor role in predicting development in Chilean toddlers compared to socioeconomic status and parenting stress.
Appendix A
Association between ethnicity and physical growth at Time 2 in the nonimputed Chilean ELPI sample

Association between ethnicity and Chile Behavior Checklist (CBCL) problem behaviors in the nonimputed Chilean ELPI sample

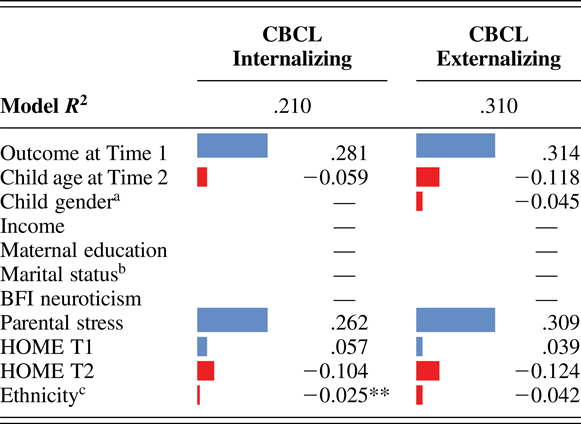
Stepwise regression model using nonimputed data to predict physical growth in the Chilean ELPI sample

Stepwise regression model using nonimputed data to predict cognitive skills and behavior problems