INTRODUCTION
The distribution of aggressive strains of wheat stripe rust, caused by Puccinia striiformis f. sp. tritici (Pst), is causing high yield losses (Hovmøller et al. Reference Hovmøller, Yahyaoui, Milus and Justesen2008; Milus et al. Reference Milus, Kristensen and Hovmøller2009) that threaten food security and the livelihoods of resource-poor farmers around the world. From 2003 onwards, farm losses caused by Pst have increased (Duff et al. Reference Duff, Hamblin and Poole2006; Nazari et al. Reference Nazari, Hodson, Hovmøller and McIntosh2011; Ramdani et al. Reference Ramdani, Nazari, Hodson, Lhaloui, Abbad-Andaloussi, Nsarellah and McIntosh2011) and it is reported to be one of the most widespread and destructive wheat diseases in areas where cool temperatures normally prevail (Dedryver et al. Reference Dedryver, Paillard, Mallard, Robert, Trottet, Negre, Verplancke and Jahier2009). Furthermore, research has shown that recent outbreaks coincided with the spread of the two closely related aggressive Pst pathotypes, which are better adapted to warmer conditions (Milus et al. Reference Milus, Kristensen and Hovmøller2009; Walter et al. Reference Walter, Fejer-Justesen, De Vallavieille-Pope, Hovmøller and McIntosh2011). In a recent review, it was evident that Pst remains a significant threat in the majority of wheat-growing regions of the world with potential to inflict regular regional crop losses ranging from 0·1 to 5%, with rare events giving losses of 5–25% (Wellings Reference Wellings2011). However, yield losses could reach up to 70% when environmental conditions are conducive (Dedryver et al. Reference Dedryver, Paillard, Mallard, Robert, Trottet, Negre, Verplancke and Jahier2009; Li et al. Reference Li, Chen, Wang and Jing2011), and in varieties where infection occurs early in the season (Beard et al. Reference Beard, Loughman, Thomas and Jayasena2005).
The use of resistant varieties was and is still the most effective technique to curb the loss of yield and quality caused by pathogens (Qualset Reference Qualset, Frankel and Hawkes1975; Evans et al. Reference Evans, Baierl, Semenov, Gladders and Fitt2008; Duveiller et al. Reference Duveiller, Singh and Nicol2007). This highlights the need to identify and use novel allelic variation for currently known resistant genes as well as the discovery of new genes that can be utilized in breeding programmes. To find this novel genetic variation will necessitate a search of largely untapped plant genetic resource collections. However, to identify novel and often rare alleles from large genetic resource collections has been likened to searching for a needle in a haystack. To facilitate gene/allele mining an efficient search technique is required that can identify subsets of germplasm that will most probably contain the required trait expressions.
The core collection approach was suggested by Frankel (Reference Frankel, Arber, Limensee, Peacock and Stralinger1984) as a way to better utilize genetic resources and has been widely adopted by the genetic resource community. The core collection, initially constructed on the basis of morphological, geographical and, more recently, molecular diversity, aims to capture as much genetic variation as possible from a source collection in a subset that is 5–10% the size of the source collection. Variations and refinements of the core collection approach include mini-cores and reference sets that further aggregate genetic variation into even smaller subsets. These representative collections aim to concentrate broad genetic variation into smaller subsets that can then be evaluated for specific traits (Upadhyaya et al. Reference Upadhyaya, Pundir, Dwivedi and Gowda2009). However, rare and adaptive alleles, most of which are thought to be functional, may not be captured by a core collection (Brown & Spillane Reference Brown, Spillane, Johnson and Hodgkin1999; Polignano et al. Reference Polignano, Uggenti and Scippa2001; Gepts Reference Gepts2006; Dwivedi et al. Reference Dwivedi, Upadhyaya, Stalker, Blair, Bertioli, Nielen, Ortiz and Janick2008; Pessoa-Filho et al. Reference Pessoa-Filho, Rangel and Ferreira2010; Xu Reference Xu and Xu2010).
The focused identification of germplasm strategy (FIGS) is a genebank search approach that seeks to maximize the likelihood of capturing the specific adaptive traits in subsets of flexible size drawn from a larger source collection (Mackay Reference Mackay, Srivastava and Damania1990, Reference Mackay, Hodgkin, Brown, Van Hintum and Morales1995, Reference Mackay2011; Street et al. Reference Street, Mackay, Zuev, Kaur, El Bouhssini, Konopka, Mitrofanova, Appels, Eastwood, Lagudah, Langridge, Mackay, Mcintyre and Sharp2008; Glaszmann et al. Reference Glaszmann, Kilian, Upadhyaya and Varshney2010; Kilian & Graner Reference Kilian and Graner2012). It exploits evolutionary and ecological drivers by filtering germplasm collections using selection criteria designed to mimic collection site environmental conditions that would impose selection pressures for the emergence of a desired trait. For example, if disease resistance is being sought then the germplasm would be filtered to capture the material from environments that favour high disease pressure which, in turn, creates a selection pressure for the emergence of host resistance. This approach has recently helped researchers to find novel alleles including new sources of resistance to powdery mildew (Bhullar et al. Reference Bhullar, Street, Mackay, Yahiaoui and Keller2009, Reference Bhullar, Zhang, Wicker and Keller2010), Sunn pest (El-Bouhssini et al. Reference El-Bouhssini, Street, Joubi, Ibrahim and Rihawi2009, Reference El-Bouhssini, Ogbonnaya, Chen, Lhaloui, Rihawi and Dabbous2013) and Russian wheat aphid (El-Bouhssini et al. Reference El-Bouhssini, Street, Amri, Mackay, Ogbonnaya, Omran, Abdalla, Baum, Dabbous and Rihawi2011, Reference El-Bouhssini, Ogbonnaya, Chen, Lhaloui, Rihawi and Dabbous2013).
In the present study, the FIGS approach was applied to stripe rust on wheat to locate sources of novel resistance in plant genetic resources collections stored at ICARDA's geneBank. The study mimics the scenario where a request is made to a plant genetic resources curator to provide accessions that are likely to have novel resistance to stripe rust. For common diseases, such as stripe rust, a proportion of the collection is likely to have been evaluated. These data can be used to determine a relationship between the geographic incidence of resistance and the environment under which it emerged. This relationship can then be used to select further germplasm subsets for evaluation.
The hypothesis being tested in the present study is that a relationship exists between the geographic distribution of stripe rust resistance and collection site climate descriptors, and thus making it possible to predict which collection sites are most likely to yield resistant genotypes.
MATERIALS AND METHODS
The modelling process
The study was conducted in two steps: first a learning phase trains a predictive model using collection site environmental data and stripe rust scores for a subset of accessions that had been previously evaluated. In effect the process quantifies the relationship, if any exists, between the disease score and a suite of environmental data. In the second phase, the model is supplied with the collection site climatic data of a further set of accessions which has also been evaluated for stripe rust (Yr) resistance. This second set of accessions is different and independent from the dataset used in the first step to build the model. The model then uses the relationships observed in the training phase to classify the second set of accessions as potentially resistant or susceptible. The results of this prediction are then validated by the actual disease evaluation scores.
The models used are based on the paradigm that the value of the stripe rust resistance state, denoted by (Y) as a response variable, for accessions depends on the climatic independent variables (X) of the collecting sites, where X=(x 1,…,x n ) (Bari et al. Reference Bari, Street, Mackay, Endresen, De Pauw and Amri2012). In the present study, the relationship was defined within a non-linear framework where the model-based learning techniques were used to overcome the problem of restrictive parametric paradigms on the one hand and the prerequisite distribution assumptions on the other (Drake et al. Reference Drake, Randin and Guisan2006). The study details both the development and validation of predictive models for stripe rust resistance using agroclimatic parameters as the predictors.
The modelling framework also included a tuning process for optimal accuracy. The quality of the model was measured using cross-validation algorithms where the data were split into two subsets: the algorithms developed on the training test as well as the validation test were then used to predict for trait states in the second set of material, whose evaluation data were not presented to the models during the prediction phase.
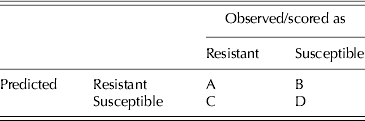
The accuracy of the models (or their predictive power) was measured based on their ability to accurately predict the number of times the fitted model correctly classified the response for each of the two descriptor states (resistant or susceptible). The parameters used to quantify the classification correctness were the area under the curve (AUC) of the receiver operating characteristics (ROC) plots and the Kappa parameters, which were derived from a 2×2 contingency table (Table 1) (Swets et al. Reference Swets, Dawes and Monahan2000; Fawcett Reference Fawcett2006). An AUC value of 0·5 would represent randomness, whereas a value of 1 would represent peak model performance (Fawcett Reference Fawcett2006). A value of 0·7 was considered to indicate that the model is performing favourably in terms of its ability to accurately predict a trait state.
Confusion matrix (2×2 contingency table)

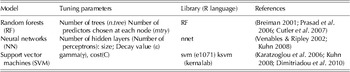
The Kappa statistic is used to assess improvement over chance and measures the specific agreement, such as the agreement between the curator's evaluation and the model's prediction. A value below 0·4 is an indication of poor agreement and a value of 0·4 and above is an indication of good agreement (Landis & Koch Reference Landis and Koch1977). Thus, a high value is an indication that the model performance was adequate for prediction purposes and the overall agreement between observed and predicted values (Scott et al. Reference Scott, Heglund, Morrison, Haufler, Raphael, Wall and Samson2002; Steyerberg et al. Reference Steyerberg, Vickers, Cook, Gerds, Gonen, Obuchowski, Pencina and Kattan2010). The models, detailed in Table 2, are described below.
Model-based learning techniques used in the study

Random forest
Random forest (RF) is a clustering algorithm developed to act like an ensemble classifier – methods that generate many classifiers and aggregate their results (Breiman Reference Breiman2001; Liaw & Wiener Reference Liaw and Wiener2002). In a normal standard tree classifier, the best among all variables is used at each node; however, in RF the best split is randomly selected at each node among subset predictors. The random selection of inputs or combination of inputs at each node to grow each tree improves the overall accuracy of RF model prediction (Breiman Reference Breiman2001).
Two parameters for use of RF: the number of variables in the random subset at each split node (mtry) and the number of trees in the forest (ntree) (Liaw & Wiener Reference Liaw and Wiener2002). The optimization of these two parameters is driven by monitoring the magnitude of the mean square prediction error (rate of classification error) observed in the out-of-bag (OOB) set; that is, the ability of each iteration to correctly classify an unknown germplasm accession as resistant or susceptible. Random forests have been used in gene selection and classification of microarray data and genome-wide association studies for complex human diseases (Lunetta et al. Reference Lunetta, Hayward, Segal and Van Eerdewegh2004; Díaz-Uriarte & Alvarez de Andrés Reference Díaz-Uriarte and Alvarez De Andrés2006).
Neural networks
Neural networks (NN) are commonly used to approximate the complex functional relationships that might exist between input variables, for example climate data (X) and response variables (Y) such as reaction to disease infection; in the present case the reaction of wheat genetic resources accessions to stripe rust pathogen. Neural networks act like general linear models (GLMs) although they do not necessarily require an assumption of linearity between the trait variable (dependent variable) and climate variable (independent variables); it is the data that define the functional form of the relationship or the dependency between the trait (Y) and the climate data (X) (Warner & Misra Reference Warner and Misra1996; Günther & Fritsch Reference Günther and Fritsch2010). Analogous to clusters of neurons in a nervous system, NNs learn from the training data by iteratively adapting their parameters (weights of input data) until an approximation of the functional relationship emerges (Günther & Fritsch Reference Günther and Fritsch2010).
In the present study, the climate data were fed as inputs to the NN model (nnet model R library (Venables & Ripley Reference Venables and Ripley2002)). The nnet is a feed-forward NN with a single hidden layer where the information is processed from the input nodes, through the hidden layer to the output nodes of the network. Prior to the use of the nnet model the tuning process was performed to define the number of neurons (size) and the decay parameter (ε) that measures the trade-offs between the weights (w k ) and the prediction error. The weights keep changing through the back-propagation iterative process until the reduction in error is optimized. The input weights are estimated based on the training set and by the sum-of-squared errors.
Support vector machines
Support vector machines (SVM) is also a learning-based technique that maps input data to a high-dimensional space, and then optimally separates it into respective classes by isolating those inputs, which fall close to the data boundaries (Cortes & Vapnik Reference Cortes and Vapnik1995; Principe et al. Reference Principe, Euliano and Lefebvre2000). The mapping of input data to high-dimensional space is carried out through the processes called kernel functions (equivalent to basis functions) that allow the separation of data.
In the present study, the radial basis function (RBF) was used as the kernel function for the SVM model. It uses Gaussian transfer functions, the centres and widths of which are determined by unsupervised learning rules. The SVM–RBF first assigns a ‘score’ or a label to the combination of input variables, in the present case, the site climatic variables, during the unsupervised procedure and then the value of the label is matched with the actual Y-value, in the present case the trait value (presence or absence of resistance). The results of this comparison are fed back to the system and adjustments are made to the labels until the error between the predicted and the actual are minimized. A Gaussian RBF kernel was tuned using a 10-fold cross-validation on the training data, with the best value of C (cost). The tuning process also involved performing a grid search of values to adjust the two parameters (γ) of the kernel function (RBF) and the cost (C) values.
Support vector machines are rapid and tend to distinguish optimally between groups and predict entities while minimizing the loss of information (Guo et al. Reference Guo, Kelly and Graham2005; Karatzoglou et al. Reference Karatzoglou, Meyer and Hornik2006).
Germplasm and disease data
For each model the training dataset consisted of collection site data and stripe rust (Yr) scores following a modified Cobb scale (Peterson et al. Reference Peterson, Campbell and Hannah1948) for 725 wheat landrace accessions, conserved in the ICARDA geneBank, which had been evaluated for stripe rust resistance on different occasions previous to 2010. The predictive stage was applied to collection site information associated with 2910 accessions also conserved in the ICARDA geneBank. These accessions were planted in the field during the 2010/11 cropping season at Tel Hadya (36°00′N 36°56′E, 284 m a.s.l.), ICARDA and artificially inoculated using the Yr27 virulent pathotype that was identified during the 2009/10 epidemic in Syria.
Climatic datasets
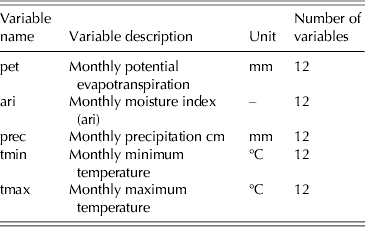
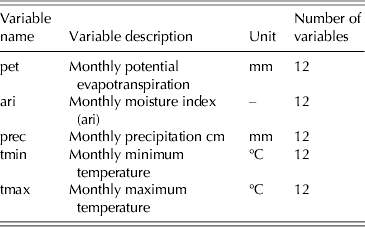
The climate data were extracted for each site from geographical information system (GIS) climatic surface maps developed at ICARDA (Table 3). The process of generating these surface maps from the meteorological climatic station data were carried out by co-splining (Hutchinson Reference Hutchinson1995; Hutchinson & Corbett Reference Hutchinson and Corbett1995), which is a local interpolation method as implemented in the ANUSPLIN software (Hutchinson Reference Hutchinson2000). The process converts the climate data from meteorological stations into climate surfaces and the interpolation process included the use of terrain variables as auxiliary variables, whereby these variables were first converted into digital elevation models (DEM), which led to an increase in the precision of the interpolated values (De Pauw et al. Reference De Pauw, Göbel and Adam2000). The climate data for sites where the accessions were collected were then extracted from these surfaces to generate data sets using the geographical location as a link between the accessions and climate surfaces (Endresen et al. Reference Endresen, Street, Mackay, Bari and De Pauw2011, Reference Endresen, Street, Mackay, Bari, Amri, De Pauw, Nazari and Yahyaoui2012; Bari et al. Reference Bari, Street, Mackay, Endresen, De Pauw and Amri2012).
The climate variables extracted from geographical information system (GIS) surfaces
RESULTS
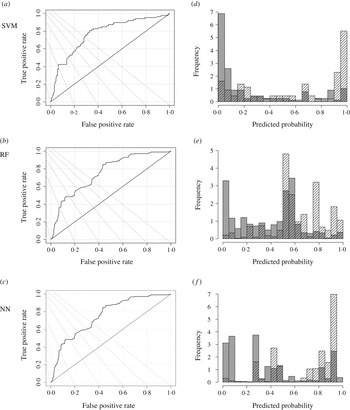
The models used were all able to identify stripe rust-resistant accessions with a high degree of accuracy. The ROC plots for all models were well above the diagonal line (Fig. 1 a to c) with a vertical trend towards the left-hand side, indicating high AUC values and that the models classified the resistant accessions more correctly with less false positive error. A straight diagonal line in the graph is expected when a model is no better than random. All the models yielded plots that demonstrate a better than random performance, achieving values as high as 0·75 for AUC.
(a–c) Receiver-operating characteristic (ROC) plots for the support vector machines (SMV), random forests (RF) and neural networks (NN) models applied to the test set of accessions (evaluation data not made known to the model during the prediction phase). The diagonal line represents the result if the predictions by the models resembled a random classification. The ROC curve to the left of the diagonal plot is the true positive rate v. false positive rate. (d–f) density histograms for prediction of resistance and susceptibility for the SMV, RF and NN models applied to the test set of accessions (evaluation data not made known to the model during the prediction phase); black cross-hatched bars indicates the probability density distribution for resistance and grey solid bars indicates susceptibility.

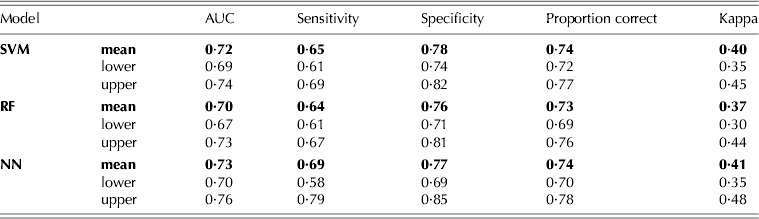
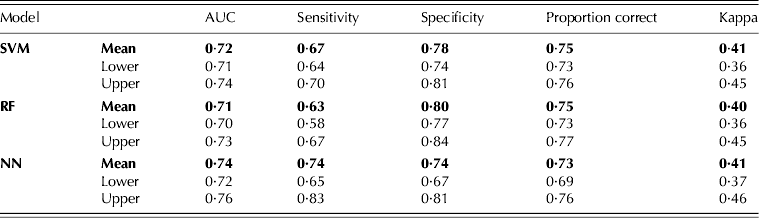
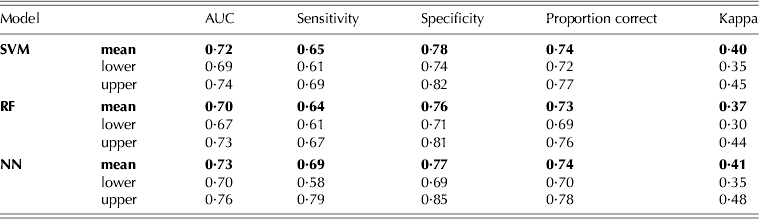
The Kappa values obtained were also mostly adequate to conclude that there is a trait–environment relationship and overall agreement. For the first set of data (in which the trait scores were made known to the model) both the SVM and NN models attained average scores of 0·4 and 0·41 with upper and lower scores ranging from 0·35 to 0·48. The mean score for the RF model was 0·37 with the scores ranging from 0·3 to 0·44. For the second set of data, in which the models constructed on the first data set were used to predict the trait state, the Kappa scores for all models achieved a mean value of 0·4 and above, with ranges of 0·36–0·46.
The histograms in Fig. 1(d to f) further illustrate the extent of separation between the two trait states. The values for AUC and Kappa and Fig. 1 all illustrate that the models were able to correctly classify sites that yield either resistant or susceptible genotypes with a success rate ranging from 0·70 to 0·78 in the validation set (Table 4) and 0·76 in the test set (Table 5). In other words, an accession predicted to be resistant based on climate data is likely to be scored as resistant by the curator or evaluator.
Accuracy parameters for support vector machines (SMV), random forests (RF) and neural networks (NN) self-learning models used to predict stripe rust resistance in the training set of accessions (725). The models were presented with long term climatic descriptors for accession collection sites and full evaluation data for reaction to the stripe rust pathogen. The models arrived at optimal parameter definition by an interactive bootstrapping process that sets tunes of the models by checking how accurately predictions conform to the actual evaluation scores
Accuracy parameters for support vector machines (SMV), random forests (RF) and neural networks (NN) self-learning models used to predict stripe rust resistance in 2910 accessions of wheat (evaluation data not made known to the model during the prediction phase). The models were previously tuned and validated on a stripe rust training data set (Table 4) were presented with long term climatic descriptors for accession collection sites of a wheat subset whose stripe rust evaluation scores were not made known to the model in the prediction phase of the algorithm. The evaluation scores were then used to evaluate the performance of the models predictive ability using Kappa an area under the curve (AUC) parameters
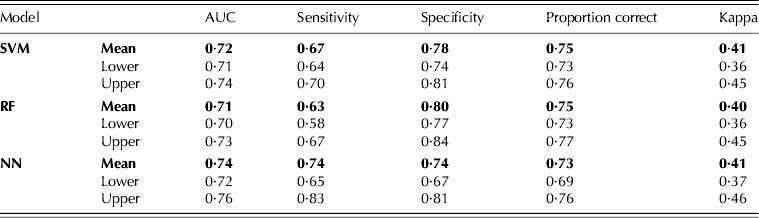
Although all models yielded plots that demonstrated a better than random performance, there is a difference in the performance statistics between the three models used. The values generated by the NN model were slightly higher than those of the SVM model, with the RF model yielding the lowest. Despite this, however, as previously mentioned all three models supported the conclusion that the long-term climatic conditions at a collection site influence the emergence of Pst resistance due to selection pressure exerted by the pathogen and this relationship or dependency is detectable by models such as those used in the present study. This dependency was used as a priori information in turn for the prediction of stripe resistance in independent data with high accuracy and agreement values. These are the first published results where such a comparison was made between the predictions and the actual evaluation or scores for a disease such as stripe rust. The results support the assertion that the approach could be an effective tool to further enhance the discovery of new genes of resistance to biotic stresses.
DISCUSSION
High accuracy and agreement values across the models indicate the presence of strong relationships between the response to Pst Yr27-virulent strains and the collection site environments of the accessions tested. That is, the present study confirms that environmental data for accession collection sites can be used to predict for stripe rust (Yr) resistance. The strength of the predictions is even higher than in a previous study where FIGS was used to detect the presence of such relationships for response to stem rust infection (Bari et al. Reference Bari, Street, Mackay, Endresen, De Pauw and Amri2012). Of further significance, unlike previous studies, the accessions used to test the models were not used in their development (so were unknown to the models); however the accuracy of the predictions was higher. This suggests that the Pst may have a more specific and narrow set of climate conditions where it thrives than the causal agent of stem rust race Ug99 (Puccinia graminis f. sp. tritici; Pgt) studied previously (Bari et al. Reference Bari, Street, Mackay, Endresen, De Pauw and Amri2012). Yellow rust incidence occurs mostly in areas with cool temperatures during the vegetative cycle, whereas stem rust is more prevalent in areas with high temperatures during the period from flowering to maturity (Roelfs et al. Reference Roelfs, Singh and Saari1992).
The current study presents further evidence that the FIGS approach can accurately identify accessions with desirable trait expression and contribute to the proof of concept of the approach. It also confirms the findings of other FIGS studies that used agroclimatic data to predict the presence of resistance to disease or pest organisms (Bhullar et al. Reference Bhullar, Zhang, Wicker and Keller2010; El-Bouhssini et al. Reference El-Bouhssini, Street, Amri, Mackay, Ogbonnaya, Omran, Abdalla, Baum, Dabbous and Rihawi2011; Endresen et al. Reference Endresen, Street, Mackay, Bari and De Pauw2011, Reference Endresen, Street, Mackay, Bari, Amri, De Pauw, Nazari and Yahyaoui2012; Bari et al. Reference Bari, Street, Mackay, Endresen, De Pauw and Amri2012). In fact, the results concur with intuitive expectation since the accessions that have been found to possess resistance to stripe rust in the past are often from Ethiopia, Afghanistan, parts of Turkey and Iran in areas where environmental conditions are conducive for the epidemics of the disease and for recurrent stripe rust outbreaks. For example, the stripe rust resistance gene Yr45 was found in a common spring wheat genotype (PI 181434) from Afghanistan (Li et al. Reference Li, Chen, Wang and Jing2011).
Geographical patterns of disease resistance have been shown by other studies in wheat (Bonman et al. Reference Bonman, Bockelman, Jin, Hijmans and Gironella2007) and for powdery mildew where winter wheat populations with the highest level of resistance were encountered in sites where powdery mildew (Pm) pressure was high (Paillard et al. Reference Paillard, Goldringer, Enjalbert, Trottet, David, De Vallavieille-Pope and Brabant2000). In a more applied study, also demonstrating a geographic pattern to trait distribution, FIGS was used to search for accessions resistant to powdery mildew. It turned out that 0·4 of the collection sites chosen yielded genotypes resistant to Pm, and molecular studies on the Pm3 locus revealed seven new functional resistance alleles (Bhullar et al. Reference Bhullar, Zhang, Wicker and Keller2010).
Use of a priori information, based on the FIGS approach, can not only detect the presence of relationships between a given trait and the climatic/environmental parameters under which it evolved, but could also help to assign trait values for accessions not evaluated. Here, FIGS was used to assign scores (predicting resistance or susceptibility) with the aim of constructing subsets containing the desired trait expression at a higher probability than if the material was selected at random, thus reducing the cost of evaluating accessions lacking the desired expression (Koo & Wright Reference Koo and Wright2000). This issue of evaluation has been a major constraint hindering the effective use of plant genetic resources (FAO 2010). Paradoxically though, genetic resource collections have been a source of scores of specific genes with impressive impacts on wheat breeding such as the ‘dwarfing’ genes, Rht1 and Rht2, found in a wheat landrace from Japan (Hoisington et al. Reference Hoisington, Khairallah, Reeves, Ribaut, Skovmand, Taba and Warburton1999). The lack of evaluation data in particular has been highlighted as the single most prevalent and long-standing complaint in the management of plant genetic resources collections vis-à-vis plant improvement (Koo & Wright Reference Koo and Wright2000). As shown in the present study there is, however, the potential to use limited evaluation to improve the effectiveness and efficiency with which plant genetic resources can be used.
The models used in the present work, as applied to genetic resource diversity research, represent a novel approach and deserve particular comment. Firstly, the RF, NN, SVM are perhaps more robust and easier to use since they have fewer assumptions and thus require less data preparation when compared with linear approaches (Drake et al. Reference Drake, Randin and Guisan2006; Tirelli et al. Reference Tirelli, Pozzi and Pessani2009). For example, these data do not have to be checked for, and if necessary transformed, to ensure normal distribution. Secondly, the use of these types of recursive partitioning algorithms is gaining momentum in areas where the data are too highly dimensional for standard regression methods such as principal components analysis (PCA), in which the decomposition of variables into reduced components leads to the loss of their individual effects, thus rendering the important variables unidentifiable in the interpretation (Strobl et al. Reference Strobl, Malley and Tutz2009).
The FIGS approach addresses the lack of ex ante evaluation as well as reducing the cost and time it takes to identify the constraint then identify the required genetic variation and its introgression into appropriate cultivars. This is an issue highlighted by Koo & Wright (Reference Koo and Wright2000), who found that the speed with which resistant varieties were developed depended on how quickly novel resistance to diseases could be identified. In a similar study, Gollin et al. (Reference Gollin, Smale and Skovmand2000) used models to examine the efficiency of breeding cultivars resistant to diseases and insects; they concluded that the search for a desirable trait is of equal importance to the process of transferring it into improved backgrounds. Gollin et al. (Reference Gollin, Smale and Skovmand2000) found that the use of a focused search approach, which they called a specialized knowledge case, had a positive impact on crop improvement because it increased the probability of finding the desirable plant material while shortening the time taken to develop an improved variety.
Although the present study and previous ones have shown the potential for FIGS to enhance the discovery of novel sources of variation, there is certainly room for improvement. Although an increase in accuracy of these, or alternative models, to define relationships and dependencies between trait expression and the environmental descriptors used thus far may not be expected, an increase in accuracy can be expected as further environmental descriptors are included, or the environmental data are presented in different formats. For example, the modelling done in the present paper used monthly weather data expressed as 12 separate monthly attributes, for each of maximum and minimum temperatures, precipitation, evapotranspiration and aridity/moisture variables (Table 3), corresponding to the calendar year; January to December. Further studies will experiment with daily data that are arranged and aligned so it is expressed from the onset to the end of growing period for each collection site, thus describing the actual conditions during the growing season of the target crop more accurately. In a similar vein, environmental variables for specific crop development phases could be derived so that conditions across the collections sites at critical stages of development could be more accurately compared or used as selection criteria.
Further, by using a landscape genetics approach, FIGS not only improves the scope for utilizing accessions that lack evaluation data, but also accessions that may possess the desired variation but which lack sections of the passport data in particular the accession geographical location. That is, if the general location of the collection site is known, relationships that might exist between landscape features and genetic variation between and within plant populations could be explored and used as predictors (Heywood Reference Heywood1991; Podolsky & Holtsford Reference Podolsky and Holtsford1995; Sharbel et al. Reference Sharbel, Haubold and Mitchell-Olds2000; Manel et al. Reference Manel, Schwartz, Luikart and Taberlet2003; Hakes & Cronin Reference Hakes and Cronin2011).
CONCLUSION
This research contributes to the proof of concept for the use of the FIGS approach to mine genetic resource collections for adaptive traits and demonstrates an effective modelling process that could be used for discovering novel or new sources of resistance to other pests and diseases.
The successful use of non-linear algorithms demonstrated here suggests wider applications in studies of ecogeographic genetic variation where the relationships between variables are likely to be complex and multi-dimensional.
While the models used were effective at predicting stripe rust resistance, improvements in predictive power of such models are likely as further ecogeographic and co-evolutionary descriptors are included or current variables are redefined to reflect conditions within the crop-growing seasons.