I. INTRODUCTION
Hot deformation is an essential step in the processing route of industrial alloys. The energy required for a shape change through hot working (Q d) directly depends on the alloy deformation resistance. Measuring this energy is crucial to the industrial design as well as to the scientific community. Hence, many papers have been devoted so far to calculate Q d for the hot deformation of different alloys. Due to the fact that Q d depends on the deformation resistance, its value is calculated by using different constitutive descriptions of flow stress. Reference Lin, Chen and Zhong1–Reference Zhang, Zhang, Li, Shen and Gu5 The value of Q d strongly depends on the material characteristics, which is particularly controlled by the mechanism of dynamic softening, dynamic recovery (DRV), or dynamic recrystallization (DRX). As a matter of fact, there is a relationship between the stacking fault energy (SFE) and the deformation resistance or Q d. In practice, the value of Q d is often lower for high-SFE metals which are prone to DRV such as Al and ferritic stainless steels than low-SFE ones such as austenite, which undergo DRX. Reference Mehtonen, Karjalainen and Porter6–Reference Momeni, Kazemi, Ebrahimi and Maldar8 It has been approved that most of Ni and Ni-based alloys are softened by DRX through hot working. Reference Momeni, Abbasi, Morakabati, Badri and Wang4,Reference Chen, Lin, Wen, Zhang and He9 However, there have been controversies over the exact mechanism. Reference Mitsche, Sommitch, Huber, Stockinder and Poelt10,Reference Zhang, Zhang, Jiang and Lu11 Although the mechanism of dynamic softening affects the required activation energy, it is apparent that Q d should depend on the applied temperature and deformation.
It has been understood that the deformation resistance or Q d depends on how easily the dislocations can overcome the obstacles during plastic deformation. According to the principles of dislocation theory, the type and energy of the barriers versus dislocations, determines the dependence of flow stress on temperature and strain rate. Reference Hull and Bacon12 This principle helps to understand that temperature and strain are two devices which help dislocations to overcome the barriers. Therefore, Q d should be interpreted as a combination of temperature and mechanical energies. Although currently Q d values have been calculated for various industrial alloys, Reference Shastry, Maji, Krishnan and Ramamurty13–Reference Liu, Li, Li, Liu and Xu16 the physical meaning of this parameter is still opaque. Hence, this research has aimed at shedding light on the physical interpretation of Q d and the parameters which affect it. For this purpose, the studies have been focused on two model alloys of pure Ni and Ni–30Cu alloys which seem to be appropriate candidates to study the influence of a totally soluble alloying element on the deformation resistance and Q d of the base metal Ni.
II. MATERIALS AND METHODS
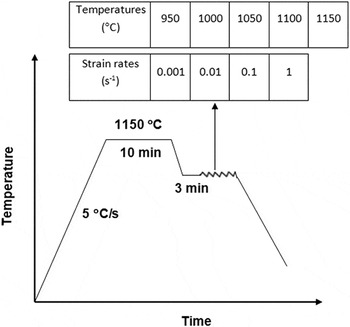
The material used in this investigation was Ni–30Cu alloys with 30 wt% of Cu as the only alloying element. The material was received as a 10 mm gage hot rolled plates with the average grain size of 75 μm. Cylindrical compression samples of 15 mm height and 10 mm diameter were prepared according to the ASTM E209 standard with their axis along the rolling direction of the strip. Concentric grooves of 0.5 mm depth were machined on the both surfaces contacting the anvils and graphite powder was used as the lubricant material to reduce friction. A Zwick Roell testing machine (Zwick GmbH & Co. KG, Ulm, Germany) equipped with a computerized controlled furnace was used to perform hot compression tests at strain rates ranging from 0.001 to 1 s−1 and at temperatures of 950–1150 °C. Before starting the tests, specimens were reheated at 1150 °C for 10 min, cooled down to testing temperatures and soaked for 3 min. All samples were then subjected to a total true strain of 0.7. The tests performed in this investigation were designed and carried out similar to those applied on pure Ni, reported in the literature. Reference Prasad and Sasidhara17 Figure 1 schematically shows the procedure of hot compression tests adopted for the studied alloys.
Schematic representation of the thermomechanical tests adopted in this study.

III. RESULTS AND DISCUSSION
A. Constitutive analysis and effect of strain on activation energy
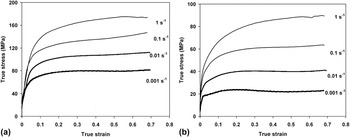
Figure 2 shows the representative flow curves of Ni–30Cu at two temperatures of 950 and 1150 °C. It is clear that the flow stress at each strain depends strongly on strain rate and temperature.
Representative flow curves of Ni–30Cu at various strain rates and temperatures of (a) 950 °C and (b) 1150 °C.

As expected, the results confirm that the deformation resistance of the material increases as temperature declines or strain rate rises. To calculate the apparent activation energy, the interrelation between flow stress, temperature and strain rate was defined by the hyperbolic sine function, given by:
 $$A{\left[ {{\rm{sinh}}\left( {\alpha \sigma } \right)} \right]^n} = \dot \varepsilon \,{\rm{exp}}\left( {{{{Q_{\rm{d}}}} \over {RT}}} \right)\quad ,$$
where Q
d denotes the apparent activation energy, R is the universal gas constant, and A, n, and α are the material constants. Based on Eq. (1), the stress exponent (n) is calculated as (∂ln ε/∂ln[sinh(ασ)])ε,T
and by drawing the variations of flow stress with the reciprocal of temperature
 $\left( {S = \left( {{{\partial {\rm{ln}}\left[ {{\rm{sinh}}\left( {\alpha \sigma } \right)} \right]} \mathord{\left/ {\vphantom {{\partial {\rm{ln}}\left[ {{\rm{sinh}}\left( {\alpha \sigma } \right)} \right]} {\partial \left( {{{\rm{1}} \mathord{\left/ {\vphantom {{\rm{1}} {T}}} \right. \kern-\nulldelimiterspace} {T}}} \right)}}} \right. \kern-\nulldelimiterspace} {\partial \left( {{{\rm{1}} \mathord{\left/ {\vphantom {{\rm{1}} {T}}} \right. \kern-\nulldelimiterspace} {T}}} \right)}}} \right)_{{\rm{\varepsilon ,\dot \varepsilon }}} } \right)$
, as described with more details elsewhere,
Reference Momeni, Abbasi, Morakabati, Badri and Wang4
the value of Q
d can be calculated using the following equation:
 $${Q_{\rm{d}}} = nRS\quad {\rm{.}}$$
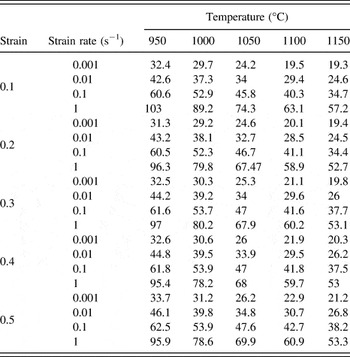
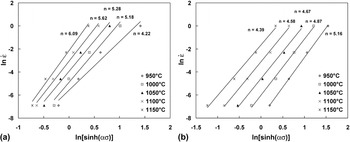
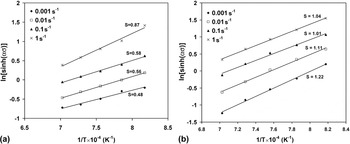
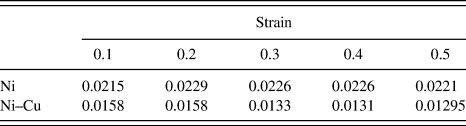
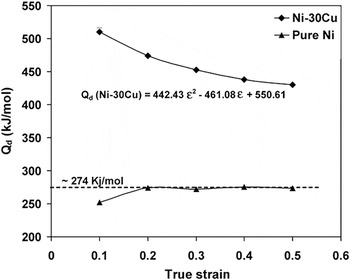
To study the influence of Cu, the activation energy for hot working of pure Ni was calculated in a similar manner using the flow stress data summarized in Table I. Figures 3 and 4 represent the log–log variations of flow stress with strain rate and the reciprocal of temperature for the materials at the typical strain of 0.5. The values of stress coefficient (α) were adjusted to fit the data in Fig. 3 to the best linear condition. Table II summarizes the values of α for different strains. The average values of n and S were used to calculate the value of Q d for both alloys. This operation was repeated for strains in range of 0.1–0.5 and the corresponding Q d values for both alloys were calculated. Figure 5 represents Q d–strain plots for both alloys. It is observed that Q d varies differently with strain in Ni–30Cu and pure Ni. The results show a nearly constant value of Q d (274 kJ/mol) over a wide range of strain beyond 0.2 for pure Ni. In contrast, for Ni–30Cu, Q d decreases with strain and obeys a relationship as follows:
 $${Q_{\rm{d}}} = {\rm{442}}{\rm{.43}}{\varepsilon ^{\rm{2}}} - {\rm{461}}{\rm{.08}}\varepsilon + {\rm{550}}{\rm{.61}}\;\left( {{{{\rm{kJ}}} \mathord{\left/ {\vphantom {{{\rm{kJ}}} {{\rm{mol}}}}} \right. \kern-\nulldelimiterspace} {{\rm{mol}}}}} \right)\quad {\rm{.}}$$
Flow stress data of pure Ni at various deformation conditions.

Variation of flow stress with strain rate in the frame of the hyperbolic sine function: (a) pure Ni, (b) Ni–30Cu. The values of stress exponent (n) have been written on the curves pertaining to various temperatures.


Values of stress coefficient (α) at different strains.

Apparent activation energy for hot deformation of pure Ni and Ni–30Cu as functions of applied strain.

The different variations of Q d with strain in Fig. 5 can be attributed to various microstructural mechanisms in the studied alloys. Previous investigations have pointed out that Ni undergoes typical discontinuous DRX (DDRX) through hot working. Reference Prasad and Sasidhara17,Reference Gandhi18 In agreement with the reports, the results of Fig. 2 indicate that Q d increases up to a specific strain, representing the start of DRX, and then remains constant with strain. The dynamic balance between DRX and work hardening retains Q d intact at high strains. In contrast to pure Ni, recent investigations have shown that Ni–30Cu (Monel400) is mostly softened by a sluggish continuous DRX (CDRX). Reference Ebrahimi, Momeni, Abbasi and Monajatizadeh2 Unlike DDRX, which often leads to a fast flow softening, CDRX proceeds with the gradual evolution of substructure and therefore leads to a steady flow softening. Reference Ebrahimi, Momeni, Abbasi and Monajatizadeh2,Reference Zheng and Wilson19 Therefore, the slow progress of CDRX seems to be responsible for the gradual decrease in Q d of Ni–30Cu in Fig. 5.
B. Effect of temperature and strain rate on the activation energy
As aforementioned, temperature and deformation are two major sources which provide the deformation energy. They take part to unleash the dislocations from different kinds of barriers. Therefore, the total activation energy for deformation can be considered as the sum of two parts: thermal and mechanical energies (Q th and Q mech), so that:
 $${Q_{\rm{d}}} = {Q_{{\rm{th}}}} + {Q_{{\rm{mech}}}}\quad .$$
The thermal energy increases the atomic vibration and facilitates diffusion. It has been well known that the higher the temperature, the faster the atomic diffusion is. There are strong evidences that diffusion helps dislocations to overcome obstacles through positive or negative climb. It is therefore rational to agree that the thermal part of Q d should be consistent with the activation energy of diffusion. Based on this idea, many papers in the literature have tried to correlate Q d for hot deformation or creep to the activation energy for diffusion (Q diff). Reference Abbasi, Morakabati, Sheikhali and Momeni20,Reference Shakiba, Parson and Chen21 However, making this correlation is not always easy, because the motion of dislocations is opposed by different kinds of obstacles, usually categorized into short-range and long-range ones. The short-range obstacles, e.g., dislocation jogs and solute atoms, are in the atomistic scales and therefore are affected by the thermal activation. These kinds of barriers can be overcome by diffusion. However, other barriers, such as the dislocation tangles, produce long-range effects, beyond the atomistic scale, and therefore need mechanical activation, which is provided by the applied stress.
The activation energy for the self-diffusion of Ni [Q self-diff(Ni)] has been reported to be about 285.1 kJ/mol. Reference Neumann and Tuijn22 As it is observed in Fig. 5, this value is in a good agreement with the calculated Q d for pure Ni. It is inferred that diffusion is the major mechanism which helps dislocations bypass the short-range barriers in the deformed Ni. Hence, it can be suggested that in pure metals, Q d can be equal to Q self-diff, and mechanical activation is no longer needed. Figure 5 clearly confirms that for pure Ni, Q d = Q self-diff(Ni) = Q th, and the effect of further deformation is completely neutralized by a diffusion-based dynamic softening process, like DRX.
For Ni–Cu alloys the calculation of Q diff and its correlation with Q d is more challenging. This is because Q diff in alloys depends on the chemical composition. In substitutional alloys, such as Ni–30Cu, Ni and Cu atoms diffuse with their own diffusion rate. Hence, the diffusion of all diffusing atoms should be taken into consideration by calculating the activation energy for the interdiffusion of Ni and Cu. The activation energy for the interdiffusion of Ni and Cu, Q diff(Ni–Cu), can be defined in terms of the individual activation energies for the diffusion of Ni and Cu into Ni–Cu solid solution as follows:
 $${Q_{{\rm{diff}}}}\left( {{\rm{Ni-Cu}}} \right) = {X_{{\rm{Cu}}}}{Q_{{\rm{diff}}}}\left( {{\rm{Cu}}} \right) + {X_{{\rm{Ni}}}}{Q_{{\rm{diff}}}}\left( {{\rm{Ni}}} \right)\quad {\rm{,}}$$
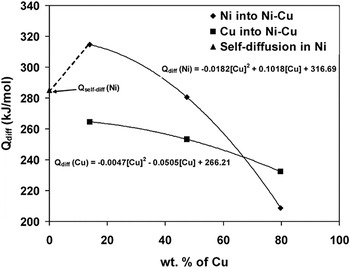
where X refers to the mole fraction and Q diff denotes the activation energy for the diffusion of Ni or Cu into Ni–Cu solid solution. For the calculation of Q diff(Ni–Cu), the available data of Q diff(Ni) and Q diff(Cu) in Ni–Cu alloys with 13.9, 47.4, and 79.8 wt% Cu were obtained from the literature. Reference Monma, Suto and Oikawa23 The variation of Q diff(Ni) and Q diff(Cu) with the addition of Cu has been drawn in Fig. 6 and regressed using the least square fitting technique. From the results shown in Fig. 5, Q diff(Ni), Q diff(Cu), and Q diff(Ni–Cu) for Ni–30Cu were calculated as 303.4, 288.9, and 290 kJ/mol, respectively.
Variation of the activation energy for diffusion of Ni and Cu in a Ni–Cu solid solution with different amounts of Cu. The value of activation energy for self-diffusion in pure Ni has been also highlighted.

Assuming Q th is constant and equal to Q diff, Q d, and Q mech should consistently change with strain, the deformation temperature, or strain rate. As mentioned, Q mech depends on the applied stress and therefore varies with the deformation temperature and strain rate. Accordingly, at a given strain, Q d should be a function of temperature and strain rate. Using the equation originally proposed by Kocks and his co-workers, Reference Kocks, Argon and Ashby24 the ratio of Q mech to Q d can be related to the flow stress as follows:
 $${{{Q_{{\rm{mech}}}}} \over {{Q_{\rm{d}}}}} = {\left( {{{\sigma \left( {T,\dot \varepsilon } \right)} \over {{\sigma ^{\rm{0}}}}}} \right)^p}\quad ,$$
where σ0 is the flow stress at 0 K and p is a constant. It is clear that at 0 K, where there is no thermal activation, i.e., Q
th equals 0, the right-hand side of Eq. (6) reaches unity and Q
mech = Qd. On the other hand, as
 $\sigma \left( {T,\dot \varepsilon } \right)$
decreases with increasing temperature, Q
mech decreases toward Q
th at high temperatures. It is therefore possible to determine Q
mech by drawing the variation of Q
d with the deformation temperature. The variation of Q
d with temperature can be described by using Eq. (2) as follows:
 $${Q_{\rm{d}}}\left( {{T,\ \dot \varepsilon }} \right) = RS{{(\dot \varepsilon )}}n{\rm{(}}T{\rm{)}}\quad {\rm{.}}$$
It is important to note that according to Fig. 4, S which is equal to
 ${\left( {{{\partial {\rm{ln}}\left[ {{\rm{sinh}}\left( {\alpha \sigma } \right)} \right]} \mathord{\left/ {\vphantom {{\partial {\rm{ln}}\left[ {{\rm{sinh}}\left( {\alpha \sigma } \right)} \right]} {\partial \left( {{{\rm{1}} \mathord{\left/ {\vphantom {{\rm{1}} {T}}} \right. \kern-\nulldelimiterspace} {T}}} \right)}}} \right. \kern-\nulldelimiterspace} {\partial \left( {{{\rm{1}} \mathord{\left/ {\vphantom {{\rm{1}} {T}}} \right. \kern-\nulldelimiterspace} {T}}} \right)}}} \right)_{\varepsilon {\rm{,}}\dot \varepsilon }}$
, is constant with temperature and Q
d is related to temperature due to
 $n\left( T \right) = {\left( {{{\partial {\rm{ln}}\,\dot \varepsilon } \mathord{\left/ {\vphantom {{\partial {\rm{ln}}\,\dot \varepsilon } {\partial {\rm{ln}}\left[ {{\rm{sinh}}\left( {\alpha \sigma } \right)} \right]}}} \right. \kern-\nulldelimiterspace} {\partial {\rm{ln}}\left[ {{\rm{sinh}}\left( {\alpha \sigma } \right)} \right]}}} \right)_\varepsilon }$
. On the other hand, as n is constant with strain rate, the dependence of Q
d on strain rate is established by
 $S\left( {\dot \varepsilon } \right)$
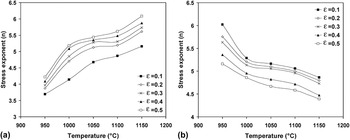
. Figures 7(a) and 7(b) show the plots of n–T, respectively, for pure Ni and Ni–30Cu at different strains in the range of 0.1–0.5. It is observed that n for pure Ni increases as temperature or strain rises. For Ni–30Cu, however, n shows a completely different response to the increase in temperature or strain. As aforementioned, this difference stems from the dissimilar dynamic softening mechanisms of the materials.
Reference Ebrahimi, Momeni, Abbasi and Monajatizadeh2,Reference Prasad and Sasidhara17–Reference Zheng and Wilson19
Variation of stress exponent (n) with temperature at various strain rates for (a) pure Ni and (b) Ni–30Cu.

It has been well known that materials with higher strain rate sensitivity parameter (m = ∂ln σ/∂ln
 $\dot \varepsilon$
) have more resistance against flow localization.
Reference Abbasi and Momeni25
As m ∝ 1/n, larger n values increase the risk of flow localization especially at high strains. The results of Fig. 7 imply that pure Ni is sensitive to flow localization or adiabatic shear bands; and their risk increases with increasing temperature or strain. This is supported by the literature, for example, Shapiro and Dieter reported the hot ductility degradation in hot torsion testing of pure Ni at high temperatures.
Reference Shapiro and Dieter26
For Ni–30Cu, however, it is inferred that the progress of CDRX diminishes the risk of flow localization, even at high temperatures or large strains.
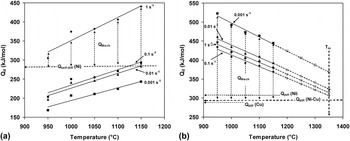
The variation of Q d with temperature and strain rate at a typical strain of 0.5 has been represented in Fig. 8. As expected, it is observed that Ni and Ni–30Cu show the opposite Q d–T variations. For both alloys, the activation energies for the diffusion of dominant atoms (self-diffusion in Ni and interdiffusion in Ni–30Cu) have been highlighted and considered as the thermal part (Q th) of Q d. Based on Eq. (4), the mechanical activation energy (Q mech) at any temperature and strain rate is determined as Q d–Q self-diff(Ni) for pure Ni and Q d–Q diff(Ni–Cu) for Ni–30Cu.
Variation of the activation energy for the hot deformation of (a) pure Ni and (b) Ni–30Cu with the deformation temperature and various strain rates. The dashed lines and white symbols show the predicted curves at higher temperatures. The values of activation energies for the diffusion of Ni and Cu as well as their interdiffusion have been highlighted.

The results pertaining to the pure Ni, in Fig. 8(a), show that Q d increases with increasing temperature at all studied strain rates. As mentioned before, this is associated with the same variation in the n–T plot of Fig. 7(a). This, in turn, reflects the higher risk of flow localization with increasing temperature in pure Ni. It is also observed that at low and medium strain rates, i.e., 0.001–0.1 s−1, Q self-diff(Ni) > Q d and therefore Q mech is actually negative. This means that at such deformation regimes, the thermal activation is high enough to overcome the deformation resistance without the contribution of mechanical activation. Furthermore, the negative Q mech can be interpreted as the flow softening which occurs due to fast DDRX at low strain rates. These results well agree with those of Fig. 5 and confirm that the self-diffusion is the rate-controlling mechanism of hot deformation for pure Ni, especially at low and medium strain rates. It should be noted that increasing strain rate or temperature gives rise to flow localization and therefore decreases the extent of flow softening. At strain rate of 1 s−1, Q mech > 0 shows that the cooperation of thermal and mechanical energies is necessary for deformation. As temperature rises, deformation becomes more localized and the influence of flow softening degrades. This, in turn, increases the contribution of mechanical energy in Q d.
In contrast to pure Ni, Q d for Ni–30Cu presented in Fig. 8(b) shows a monotonic decrease with increasing temperature at all studied strain rates. The extrapolated curves (dashed lines and white symbols) predict that Q d continues to decrease by further increase in temperature up to the melting point (1350 °C).
It is important to note that at a given temperature, Q d decreases unexpectedly when strain rate increases to 0.1 s−1 and then ascends again by an increase to 1 s−1. This anomalous behavior reflects a change in the mechanism of microstructural evolution as the strain rate exceeds 0.01 s−1. Recently, Ebrahimi et al. Reference Ebrahimi, Momeni, Abbasi and Monajatizadeh2 found that the mechanism of flow softening changes from CDRX to DDRX when the strain rate exceeds 0.01 s−1. This change particularly accelerates the rate of dynamic softening and therefore decreases the deformation resistance and the apparent activation energy. However, when the strain rate exceeds 0.1 s−1, the rate of DDRX decreases again and leads to an increase in Q d. The variation of Q d with strain rate shows that the change from CDRX to DDRX increases the role of diffusion-based processes and decreases the contribution of mechanical activation (Q mech). It is also concluded that Q d can be proposed as an index to the microstructural evolutions through hot working.
The positive values of Q mech for Ni–30Cu at all studied temperatures and strain rates lead one to deduce that diffusion cannot convey the applied deformation without the contribution of mechanical energy. This can be attributed to two major reasons: first, the strengthening influence of Cu atoms and second, the sluggish mechanism of dynamic softening. The pinning or dragging influence of the solute atoms on dislocations leads to the formation of more dislocations for carrying the applied deformation. This, in turn, increases the dislocation interactions which give rise to increasing dislocation tangles. Therefore, even though diffusion tries to unlock dislocations from the solute atoms, the mechanical activation is still the indispensable part of total activation energy to overcome the dislocation tangles. The mechanism of microstructural evolution during CDRX is the second reason for larger Q mech in Ni–30Cu. It has been well known that CDRX occurs with the progressive evolution of substructure through straining. The well-developed persistent sub-boundaries, which are formed during this process, work as the major barriers for the new dislocations and result in excessive mechanical resistance. This is why the flow stress for a material softened by CDRX is controlled by the average subgrain size. Therefore, as the subgrains grow with increasing strain or temperature, the average dislocation density decreases and the mean free path for the moving dislocations increases. This means that the flow stress and the mechanical activation required for deformation decrease with increasing strain or temperature.
IV. CONCLUSIONS
Hot compression tests have been conducted on pure Ni and Ni–30Cu at temperatures in range of 950–1150 °C and various strain rates of 0.001–1 s−1 to identify the physical interpretation of the apparent activation energy for hot deformation. The major results of this investigation can be summarized as follows:
-
(1) The activation energy for hot deformation of Ni–30Cu gradually decreased with increasing strain. Unlikely, for pure Ni, it remained constant for large strains. The value of apparent activation energy for pure Ni was identical to the activation energy for the self-diffusion in Ni. The variation of activation energy for Ni–30Cu with strain was attributed to the gradual progression of dynamic softening.
-
(2) The activation energy for hot deformation was separated into thermal and mechanical parts. The thermal activation was found necessary to propel diffusion and help dislocations bypass the short-range barriers such as the solute atoms. The mechanical energy could help dislocations overcome strong long-range obstacles such as dislocation tangles.
-
(3) For pure Ni, the apparent activation energy increased with temperature and strain rate due to the tendency for flow localization. The mechanical activation was zero at low and medium strain rates of 0.001–0.1 s−1 and the diffusion was the controlling mechanism of hot deformation. However, at 1 s−1, both the thermal and mechanical activation contributed to the deformation energy.
-
(4) For Ni–30Cu, the activation energy for hot deformation was considerably greater than the activation energy for the interdiffusion of Ni and Cu. The value of mechanical activation decreased with increasing temperature and strain rate. The effect of strain rate was found to be associated with a change in the mechanism of dynamic softening.
-
(5) Although the thermal activation energies for pure Ni and Ni–30Cu were nearly identical, the mechanical energy for the latter was considerably higher. The strengthening effect of Cu atoms and the sluggish dynamic softening were found as the reasons for the larger mechanical activation in Ni–30Cu.