Introduction
Latin American countries have participated in several international (Programme for International Student Assessment/PISA, Trends in International Mathematics and Science Study/TIMSS, Progress in International Reading Literacy Study/PIRLS) and regional student achievement studies (Laboratorio Latinoamericano de Evaluación de la Calidad de la Educación, 2000, 2008). Additionally, there are collections of psychometric intelligence studies (Lynn & Vanhanen, Reference Lynn and Vanhanen2006, Reference Lynn and Vanhanen2012). However, there are no psychometric intelligence studies reported for Costa Rica, and the country has not participated in a larger Latin American IQ comparison study (Flores-Mendoza et al., Reference Flores-Mendoza, Gallegos, Mansur-Alves, Rosas, Ardila and Gómez-Maqueo2007). Nevertheless, LLECE and PISA-2009 allow a first estimation of students' average cognitive ability level. According to LLECE (2006 survey, 3rd and 6th grades, language and mathematics) the average Costa Rican result in a Latin American scale was 554 student assessment scale (SAS) points. Costa Rican students had the second best result of sixteen countries. The best results were achieved by Cuba. However, the Cuban results remain questionable: there are no other studies showing similar results for Cuba. Cuba has never participated in PISA, TIMSS or PIRLS. Cuban LLECE results are inconsistent with psychometric IQ estimates pointing to an average IQ of 85. Cuban LLECE results are inconsistent with observations in the 1990s in Cuba of people's behaviour in everyday life cognitive tasks and proficiency in Spanish orthography (Rindermann, Reference Rindermann1999).
The average in this Latin American study was 501 SAS points (SD=53). In an international SAS scale the Costa Rican result corresponds to 447 SAS points. (The LLECE scale was adjusted by using countries participating both in LLECE and PISA or TIMSS or PIRLS, similar to the procedures described in Rindermann et al., Reference Rindermann, Sailer and Thompson2009.) Directly converted to IQ without any corrections the result would be IQ 92. Costa Rica also participated in the PISA 2009 Plus study (Walker, Reference Walker2011). The average result on the OECD scale was 427 SAS points. This is equivalent to IQ 89 (directly converted) or IQ 88 (adjusted and standardized as ‘Greenwich-IQ’ with the UK average set as benchmark at 100). However, according to Walker (Reference Walker2011), 21% of 15-year-old youth in Costa Rica did not attend school, and additionally 47% of students did not participate in the survey. Assuming that (a) young people not in school at age 15 are negatively selected (i.e. dropped out of school) and (b) are less nurtured in their cognitive development as a result of being out of school, the average student achievement IQ for the entire age group is estimated at 84. Looking at the International Mathematical Olympiad (IMO) results, converted to average IQs, Costa Rica achieved an IQ of 85 points (Rindermann, Reference Rindermann, Ziegler and Perleth2011, Table 1a).
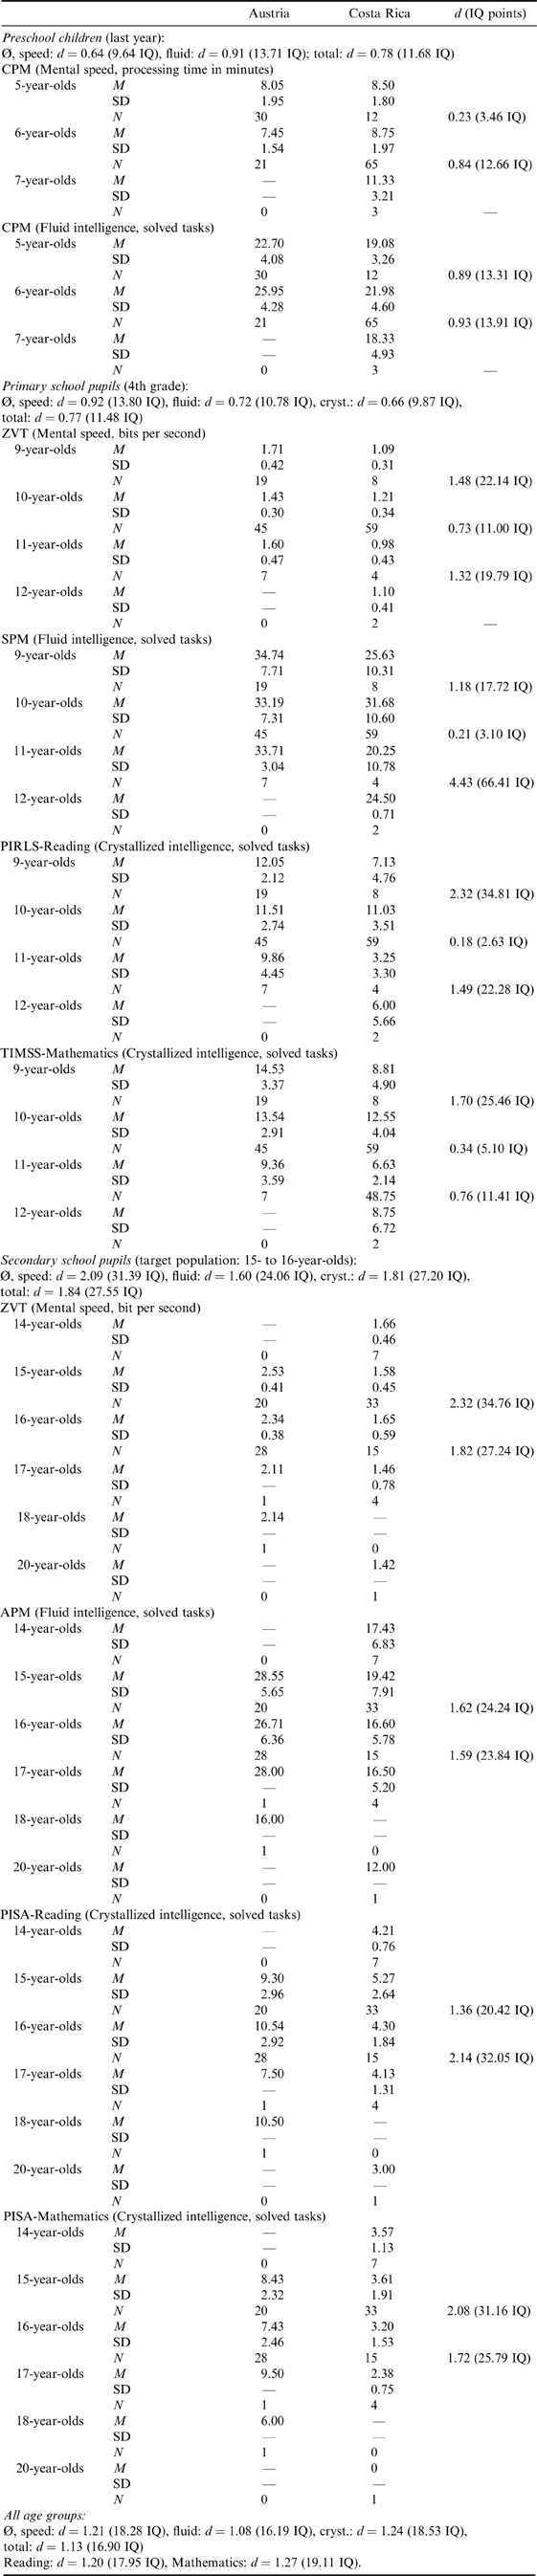
Raw cognitive ability results for Costa Rican and Austrian children, 2008

For further analyses the 7-, 12-, 18- and 20-year-olds were deleted (too small samples and unintended age groups); d-calculation: Austrian SD as reference sample, IQ converted from d; means in d and IQ difference across ages (not age-groups) weighted for N.
Compared with the general Latin American average in student achievement studies (as adjusted IQ 80, for total youth estimated IQ 76; in IMO IQ 80, in Lynn & Vanhanen, Reference Lynn and Vanhanen2012, average corrected IQ 81), Costa Rican results are 5 to 8 IQ points above the Latin American average. Acknowledging the benign political and economic conditions in Costa Rica, the above-average results of Costa Rican students are not surprising. Costa Rica is sometimes described as the ‘Switzerland of Central America’. For 60 years there has been no war, crime rates are low by Latin American standards, life expectancy is 79 years, government has been relatively democratic since 1889 and solidly democratic since World War II, and average gross national income (GNI) per capita (PPP 2008 US dollars) is US$10,870, compared with a Latin American median of US$8542 (UNDP, 2010). According to the Happy Planet Report, in 2012 Costa Rica achieved the worldwide highest ecological efficiency in supporting happiness (Abdallah et al., Reference Abdallah, Michaelson, Shah, Stoll and Marks2012).
Low cognitive test results of developing countries, especially in the tropics, are not unusual. Outside South America the results are lower, e.g. in South-East Asia (Bali: 79 IQ points; Rindermann & te Nijenhuis, Reference Rindermann and te Nijenhuis2012), in sub-Saharan Africa (averages around 70 to 75 IQ points; Rindermann, Reference Rindermann2013) and elites achieve only average results (Emirati engineering students: IQ 104; Rindermann et al., Reference Rindermann, Baumeister and Gröper2014). These test results are not only numbers: they are indicators of both the socioeconomic development of a society and, as measures of cognitive human capital, its cause (Bishop, Reference Bishop1989; Jones, Reference Jones2012; Meisenberg, Reference Meisenberg2012; Rindermann, Reference Rindermann2012). However, the causes of large gaps – up to 250 SAS points or 40 IQ or six to seven years of learning in school – are a contentious issue. Causes discussed in research include test bias and familiarity with tests, culture and genes, health and education, wealth and modernization (Hunt, Reference Hunt2012; Lynn & Vanhanen, Reference Lynn and Vanhanen2012; Rindermann et al., Reference Rindermann, Woodley and Stratford2012).
In this paper three research questions are investigated:
(1) What is the cognitive ability level in Costa Rica compared with a European benchmark country (Austria)?
(2) If there are differences in average cognitive ability between Costa Rica and Austria, are these differences increasing with age and with school-related content of tests? If yes, this would suggest that differences in school systems can at least partially explain ability gaps.
(3) If there are differences, can evidence be found for their causes?
For this purpose three age groups were used: last year preschool (age 5–6 years), primary school 4th grade (9–10 years old, comparable to TIMSS and PIRLS surveys) and secondary school students aged 15–16 years, comparable to PISA surveys. Elementary cognitive tasks of a paper-and-pencil test (ZVT) to measure mental speed, figural, ‘culture-reduced’ psychometric IQ tests (Raven's Progressive Matrices: CPM, SPM, APM) to measure fluid intelligence, and items from PIRLS, TIMSS and PISA to measure knowledge and competence in curricular subjects related to literacy and crystallized intelligence were administered.
Methods
Participants
In Costa Rica the data were collected in the western region, in and around San Isidro de El General and Buenos Aires, district Pérez Zeledón, from October to December 2008. Both urban and rural preschools and schools were included. The sample consists of the general local population including some of native background (indigenous people). All participating preschools (kindergartens) and schools in Costa Rica and Austria were public institutions. The Costa Rican regions in which the tests were applied are about as developed as the country average except for the capital. In Austria the samples were collected in the state of Styria (districts Judenburg and Weiz). There are no indications that Styrian children and youth perform lower or higher than the Austrian average on cognitive tests. Three groups of children (and their parents) participated:
Preschool (kindergarten) children in their last year, 5–6 years old; N=80 in Costa Rica, mean age 5.89 years; N=51 in Austria, mean age 5.41 years. Children were tested in their preschool. In Costa Rica no child had a migration background, and in Austria five.
Primary school children, 4th grade, 9–10 years old; N=73 in Costa Rica, mean age 10.00 years; N=71 in Austria, mean age 9.83 years. Children were tested in school. In Costa Rica one child had a migration background, and in Austria ten.
Secondary school children, 15–16 years old, 9th and 10th grades; N=60 in Costa Rica, mean age 15.35 years; N=50 in Austria, mean age 15.66 years. Children were tested in school. In Costa Rica the two schools were ‘Colegio Ambientalista’ (a vocational school for students wanting to become farmers; good students acquire a high-school diploma enabling them to go to university) and ‘Colegio Calderón’ (a general vocational school; good students acquire a high-school diploma enabling them to go to university). In Austria the schools were ‘Bundesbildungsanstalt für Kindergartenpädagogik’ (BAKIP), for students who want to become kindergarten educators, and ‘Höhere technische Lehranstalt’ (HTL), a vocational school with technical orientation. Both schools end with the high-school diploma. It is important to stress that neither of the Austrian schools was a Gymnasium. Therefore the top performers of the age cohort, around 30%, are missing, but also are youth with serious learning problems. The Costa Rican sample seems to be similarly selected. In Costa Rica and Austria no child had a migration background.
Because there were more children in the sample with a migration background in Austria than in Costa Rica (15 vs 1), and because Austrian children with a migration background (mother tongue: 5 Albanian, 3 Turk and Kurdish, 3 Serbo-Croat, 4 Eastern European languages) scored approximately 7 IQ points lower than natives, the Austrian sample is slightly downward biased. However, because immigrants are part of today's Austrian youth, their results were included. Excluding immigrants would raise the Austrian average in this sample by 0.68 IQ points (from defined 99.28 to 99.96 IQ points). The single migrant child in Costa Rica (mother tongue English) scored 9 IQ points higher than the Costa Rican average.
Measures
There is no paper–pencil test measuring mental speed that would be suitable for preschool children. As a substitute we tried to use the time to complete the Coloured Progressive Matrices (CPM). However, the later CPM tasks are not easy, elementary cognitive tasks. Therefore this ‘speed’ measure should be interpreted only tentatively.
The CPM (full version; Raven, Reference Raven2003/1958) was used as a measure of fluid intelligence in the preschool children. This is the easiest version of the Raven tests. All Raven tests consist of figural tasks. The first 10+3+2 tasks are very easy and (nearly) solvable by pure visual inspection. But the later, more difficult tasks require reasoning abilities to analyse abstract properties of figures and to detect rules of continuation, opposition/reflection or directionality. The Raven tests are measures of fluid (knowledge-distant, culture-reduced) intelligence.
The Raven Matrices tests are widely used in cross-cultural research, but they are not culture-free because different cultures create different environmental conditions for cognitive development. There are differences in (a) non-school environmental conditions relevant for cognitive development, including quality of nutrition, health care and the complexity of everyday life; (b) quantity and quality of schooling (schooling furthers intelligence, including performance on the Raven tests); (c) importance attached to school education, thinking and cognitive stimulation. Additionally, secular gains on the Raven tests have been large both in today's highly developed societies (e.g. Flynn, Reference Flynn2009) and in less developed countries (e.g. Meisenberg et al., Reference Meisenberg, Lawless, Lambert and Newton2006). Environmental changes are the most plausible causes of these gains. The Raven tests can be considered culture-reduced in the sense that they do not require specific language skills or instruction in mathematics and other curricular subjects. Because preschool children read and calculate only at a very basic level, student achievement tests were not used.
For primary school pupils, the Zahlenverbindungstest (ZVT, number-trail; Oswald & Roth, Reference Oswald and Roth1978) was used as a measure of mental speed. This is a German trail-making test in which randomly arranged numbers have to be connected with a pencil in an ascending order (from 1 to 90, four parallel matrices; for an example see http://docmed.tv.vitanet.de/demenz-alzheimer/video-symptome-diagnose). Mental speed is seen as a basic capacity in developing intelligence and school performance (Rindermann & Neubauer, Reference Rindermann and Neubauer2000).
Fluid intelligence was measured with the Standard Progressive Matrices (SPM, full version; Raven et al., Reference Raven, Raven and Court1998/1938). The SPM are more difficult than the CPM. The first 10+2+2+1+0 tasks of the five sets are very easy and (nearly) solvable by pure visual inspection. But all following tasks require reasoning abilities: rules have to be detected (continuation, opposition/reflection, composition of single parts, becoming more, greater, smaller, relationships like 1:2 is as 2:4, addition, subtraction). At least some basic mathematics is indispensable (e.g. counting to 10 and addition and subtraction), but the main focus is on the detection of rules and their application (inductive and deductive reasoning).
As measures of crystallized, school-related, knowledge-loaded intelligence published tasks from PIRLS-Reading and TIMSS-Mathematics from their 4th grade task collections were used. The tasks were chosen according to representativity and length. The PIRLS-Reading task (Antarctica: Land of Ice, with eleven questions, open and closed multiple choice format) measures, according to the test authors (Mullis et al., Reference Mullis, Martin, Kennedy and Foy2007, pp. 348–350), ‘focusing on and retrieving explicitly stated information and ideas’, ‘interpreting and integrating ideas and information’, ‘making straightforward inferences’ and ‘examining and evaluating content, language, and textual elements’. Not only reading, but comprehension is measured. The TIMSS-Mathematics tasks (20 questions, TIMSS tasks do not have names; Mullis et al., Reference Mullis, Martin, Foy, Olson, Preuschoff, Erberber, Arora and Galia2008) contain ‘number’, ‘fractions and decimals’, ‘simple linear equations’, ‘patterns and sequences’, ‘geometric shapes and measures’, ‘2D and 3D shapes’, ‘location and movement’, ‘data display’ and ‘organize and display data’. The German and Spanish tasks are documented in Pieber (Reference Pieber2009). They measure ‘knowing, applying, reasoning’ and whether, at different levels, children ‘have some basic mathematical knowledge’ or ‘apply basic mathematical knowledge in straightforward situations’.
For secondary school pupils the ZVT (see above) was used as a measure of mental speed. Fluid intelligence was measured with the Advanced Progressive Matrices (APM, full version; Raven, Reference Raven1976/1943). Only the very first tasks can be solved by visual inspection. All others require abstract reasoning.
Crystallized, school-related, knowledge-loaded intelligence (cognitive ability/competence) was measured with tasks from PISA-Reading and PISA-Mathematics. Among PISA-Reading three tasks with several sub-questions were chosen: Lake Chad, Flu and Gift. These reading literacy tasks should measure retrieving information, forming a broad general understanding, developing an interpretation and reflecting on and evaluating the content and form of a text (OECD, 2006). Like in PIRLS, not just reading but comprehension is measured. Among PISA-Mathematics eight tasks were chosen: staircase, the best car, exports, robberies, carpenter, Internet relay chat, skateboard and cubes. Student assessment tasks were taken from the original sources in Spanish and German languages.
Additionally, questionnaires were used for students and for parents. The students' questionnaire was applied in primary and secondary school. It asked for date of birth, sex, number of siblings, leisure time activities and instruction at school. The parents' questionnaire was applied in all three age groups. It asked for family status, parents' education, parents' job, children's age, sex, height, breast-feeding, nutrition, state of health, vaccination, migration background, crèche attendance, preschool attendance, parenting style, reading to the child, leisure time activities, number of books at home, and for their views of their children's instruction at school. The questionnaires were administered in German and Spanish. The Spanish translation was checked by local teachers before applying it to Costa Rica.
Standardization and statistical analysis
Three 7-year-old preschool children (intended age: 5 and 6 years) were excluded from the Costa Rican sample in age-parallel comparisons. The same was done with two 12-year-old Costa Rican pupils in 4th grade, and with 14-, 17-, 18- and 20-year-old students in the secondary school sample (intended age: 15 and 16 years, twelve Costa Ricans and two Austrians excluded). This may lead to a minor overestimation of the Costa Rican results.
First, raw scores were compared within identical ages. Averages were calculated with weighting for sample sizes within age groups (preschool, primary, secondary), but not across age groups (‘weight’ 1). A second analysis using g-factors was done only with primary and secondary school samples, because among preschoolers there was no correlation between CPM processing time and CPM number of solved tasks. The g-factor was extracted from Raven, student achievement and the mental speed tests using principal components analysis.
There are three possibilities for standardization of the results:
1. The Austrian sample is used as reference sample because average cognitive ability in Austria relative to the UK Greenwich norm is known from many previous studies. Standardized differences between the countries are calculated based on the Austrian mean and standard deviations. The d scores were then multiplied by 15 and 100 was added to convert them to the IQ scale (M=100, SD=15). The Austrian average in international cognitive ability studies is slightly below the British, which is defined as 100. When all available ability measures (psychometric IQ and student assessment studies until 2009) are averaged, Austria's mean is 99.28 IQ points. Only looking at IQ, Austria has 99.50 IQ points; only looking at student assessment studies (PISA, TIMSS, PIRLS) Austria has 98.93 IQ points. Because student assessment tests were included in the study, for Austria a Greenwich mean IQ of 99.28 points was adopted. The Costa Rican results are calculated as deviation from the Austrian mean, scaling the Austrian standard deviation to 15. This procedure has the advantage that meaningfully scaled results for all tests can be presented, but it depends on the representativeness of the Austrian samples.
2. The three Raven tests can be scaled using published UK norms. Here the children who are outside the intended age range and for whom there are no cross-country reference groups in the samples can be included. But this procedure depends on the quality of the Raven standardization samples (not always free of problems, see Gudjonsson, Reference Gudjonsson1995). And, if older standardization samples are used, a Flynn effect correction is needed (Flynn, Reference Flynn2012) based on somewhat speculative assumptions on ability changes across time. For the ZVT there are German norms that can be applied in Austria (both countries have very similar results in international ability studies). There are no published norms for the CPM speed measure and the selected PIRLS-, TIMSS- and PISA-tasks. The Raven means of Austria could be referred to here as the benchmark for the student assessment tests (same Austrian means and SDs).
3. A combination of both standardization approaches.
For standardization of the ZVT results the age-based German norms from Oswald & Roth (Reference Oswald and Roth1978, pp. 44, 50–54) were used. It is necessary to consider an adaptation to UK norms. The German average in international comparisons of psychometric intelligence and in student assessment studies is 99.13, relative to 100 for Britain. Therefore a correction of −0.87 IQ points was applied.
The ZVT norms stem from around 1977 and in 2008/9 they were more than 30 years old (31 years). According to Pietschnig et al. (Reference Pietschnig, Voracek and Formann2010) the Flynn effect for vocabulary (crystallized intelligence) in German-speaking countries is still ongoing (3.5 IQ points per decade from 1971 to 2007). In light of this information it would be necessary to subtract 10.85 IQ points (31 years×0.35 IQ) for both countries. However, reaction times have lengthened over time (Silverman, Reference Silverman2010; Woodley et al., Reference Woodley, te Nijenhuis and Murphy2013). Because of these contradictions, a Flynn correction was not applied.
For scaling of the CPM results it is not possible to use age-based British norms because they are presented only for age groups 6 years and older (from 1984 and 1982; Raven et al., Reference Raven, Raven, Court, Bulheller and Häcker2006/1956, p. 53) and in our sample there are also 5-year-old children. Therefore German norms were used (Raven et al., Reference Raven, Raven, Court, Bulheller and Häcker2006/1956, p. 52), which were obtained from a sample from Germany and France tested in 1998 and 1999 (the two countries had similar results). Two corrections were applied: −0.87 IQ points to adjust to UK norms, and −3.5 points for the Flynn effect (10 years).
For standardization of the SPM results the British SPM norms from 1979 were used (Raven, Reference Raven1981). The British 1979 norms were not smoothed, so a post-hoc smoothing procedure was applied. For all 9-year-olds the averaged norms for age 9.0 to 9.5 and 9.6 to 9.11 months were used; for all 10-year-olds the averaged norms for age 10.0 and 10.5 and 10.6 to 10.11 months were used, and so on. Because the norms stem from the UK, a country adaptation is not necessary. The evidence concerning the continuation of secular rises of intelligence in the UK is contradictory (see in-depth discussion in Rindermann & te Nijenhuis, Reference Rindermann and te Nijenhuis2012). According to diverging results a modest correction of 2 IQ points was chosen (dec=0.69 points per decade; see Rindermann & te Nijenhuis, Reference Rindermann and te Nijenhuis2012).
For the APM German norms from 1979 were used (Kratzmeier & Horn, Reference Kratzmeier and Horn1980). Norms do not differ with age. To adjust to Greenwich norms a correction of −0.87 IQ points was needed. Because the norms were about 29 years old in 2008, and IQ gains have occurred until very recently in German-speaking countries (Pietschnig et al., Reference Pietschnig, Voracek and Formann2010), a Raven Matrices Flynn correction of 2 IQ points per decade (5.8 IQ points total) was used (Rindermann & te Nijenhuis, Reference Rindermann and te Nijenhuis2012). This means, it can be assumed that a German sample, the benchmark here, would have solved more tasks in 2008 than in 1979, corresponding to an increase of 5.80 IQ points.
There are no norms for the student assessment tasks from PIRLS-Reading, TIMSS-Mathematics, PISA-Reading and PISA-Mathematics. These were scaled by anchoring their results to the mean age-related Raven (CPM, SPM, APM) and ZVT results. The CPM processing time was normed according to CPM solutions. For population estimates statistics on education were used (see paragraph ‘Cognitive ability estimation for total Costa Rican youth and society’). For the path analysis Mplus 5.21 was chosen. Missing data were not imputed, and existing data of observations with single or several missing values were used (full-information-maximum-likelihood, FIML, no listwise deletion in the case of missing data).
Results
Cognitive ability measures: raw values
In all three cognitive ability measures (mental speed, fluid intelligence, crystallized intelligence) and in all three age groups (preschool, primary school, secondary school) Costa Rican children achieved lower results than Austrian children (see Table 1). The average difference across all three abilities and all three age groups is d=1.13 standard deviations. The difference is smaller in fluid compared with crystallized intelligence (d Fl=1.08 vs d Cr=1.24), but it is also large in mental speed (d MS=1.21). The difference is smaller in preschool and primary school than in secondary school (d Pre=0.78, d Prim=0.77, d Sec=1.84). The country pattern is by and large independent of the tests used to assess each ability construct. Within speed, preschool CPM-time vs school ZVT: d CPMt=0.64 vs d ZVT=1.51. Within fluid intelligence, preschool CPM, primary SPM and secondary APM: d CPM=0.91, d SPM=0.72, d APM=1.60. Within crystallized intelligence: d Read=1.20 vs d Maths=1.27.
However, the differences increase with age for each of the three ability constructs: mental speed, d Pre=0.64, d Prim=0.92, d Sec=2.09; fluid intelligence, d Pre=0.91, d Prim=0.72 and d Sec=1.60; crystallized intelligence, d Prim=0.66 and d Sec=1.81. There is no indication that the secondary school samples are differently selected (as ‘Austrian elite’ or ‘Costa Rican sub-standard’).
Differences between the two countries increase when they are compared at the level of the g-factor: in primary school from d Prim=0.77 to d gPrim=0.95; in secondary school from d Sec=1.84 to d gSec=2.81. The Costa Rican samples contain more over-aged children (see Table 1, in kindergarten 7-year-old children, in 4th grade 12-year-old pupils, in the 15- and 16-year-old secondary school group 17- and 20-year-old students). There are also some ‘too young’ 14-year-old students. Age streaming seems to work less well in the Costa Rican educational system; or in Costa Rica more children with delayed development are kept in regular schools, perhaps due to integration policies or for lack of special schools for mentally challenged children.
The reliability is higher in Costa Rica than in Austria for the CPM (3 sets, Cronbach's α CR=0.74 vs α Au=0.66), the SPM (5 sets, Cronbach's α CR=0.84 vs α Au=0.72) and the APM (2 sets, Cronbach's α CR=0.48 vs α Au=0.38). The value for APM is rather low, there are only two subtests and the first twelve-item scale is more intended as a warm-up. The measures of crystallized intelligence in 4th grade have slightly higher reliability in the Austrian sample (PIRLS-Reading and TIMSS-Mathematics, Cronbach's α CR=0.63 vs α Au=0.67), similar to PISA-Reading and PISA-Mathematics in secondary school (Cronbach's α CR=0.60 vs α Au=0.64). (Unfortunately there are no ZVT results at the level of the four subtests, nor item-level results in the Ravens and student assessment tests.) There is no indication for generally lower reliability of the cognitive tests in the Costa Rican sample.
In both countries there is no correlation between CPM processing time and CPM solved tasks in preschool: r CR=−0.01 vs r Au=−0.07. The ‘mental speed’ substitute in kindergarten has low validity, possibly because of a speed–accuracy trade-off. Within primary school the correlation between mental speed and fluid and crystallized intelligence is higher in Costa Rica (Costa Rica: r MS-Fl=0.41, r MS-Cr=0.42, r Fl-Cr=0.57; Austria: r MS-Fl=0.29, r MS-Cr=0.34, r Fl-Cr=0.42). Also, in secondary school the correlation between mental speed and fluid and crystallized intelligence is on average higher in Costa Rica (Costa Rica: r MS-Fl=0.29, r MS-Cr=0.42, r Fl-Cr=0.54; Austria: r MS-Fl=0.01, r MS-Cr=−0.04, r Fl-Cr=0.54). Because of the higher correlations between tests the average g-factor loadings and variance explained by the g-factor are higher in Costa Rica: in primary school, λ CR=0.76 vs λ Au=0.72, explaining 57.30% vs 52.11%; in secondary school, λ CR=0.74 vs λ Au=0.59, explaining 54.55% vs 48.78%. The pattern corresponds to Spearman's law of diminishing returns, which says that g-loadings are lower at higher ability levels (Spearman, Reference Spearman1932; Jensen, Reference Jensen1998; Coyle & Rindermann, Reference Coyle and Rindermann2013). The pattern also underscores the validity of the Costa Rican ability results.
Cognitive ability measures: IQ values
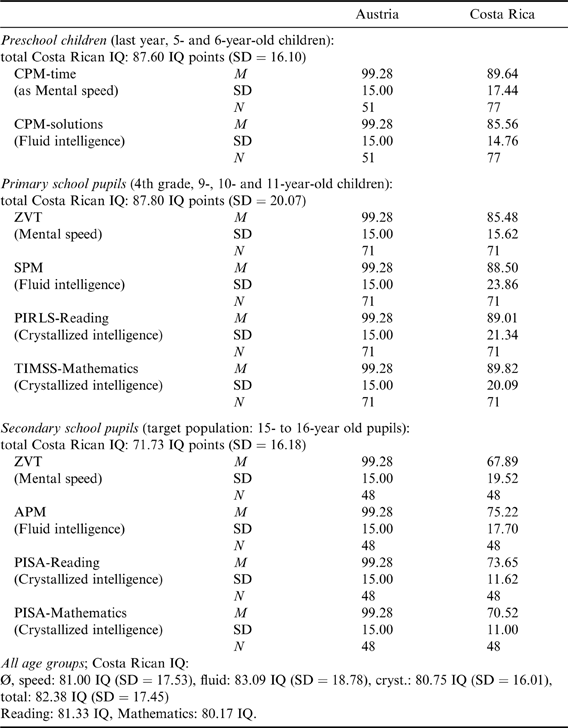
In the first standardization procedure the results were standardized by defining the Austrian sample mean as M=99.28 IQ points (in Greenwich norm) and SD=15 (see Table 2). The total Costa Rican sample average is 82.38 IQ points. Differences between speed, fluid intelligence and crystallized intelligence are negligible (M MS=81.00, M Fl=83.09, M Cr=80.75). Also the reading and mathematics results are similar (M Read=81.33, M Maths=80.17). The results in secondary school are well below the results of preschool and primary school (M Pre=87.60, M Prim=87.80 and M Sec=71.73). Compared with other cognitive ability studies in Costa Rica (PISA 2009: IQ 88 for students, IQ 84 total youth corrected, IMO IQ 85) and with the Latin American average (student assessment: IQ 80, total youth corrected IQ 76, IMO IQ 80, psychometric corrected IQ 81) the results are similar.
IQ cognitive ability results, Costa Rican and Austrian children, 2008 (standardization based on Austrian results, defined as Greenwich 99.28 IQ points and SD=15)
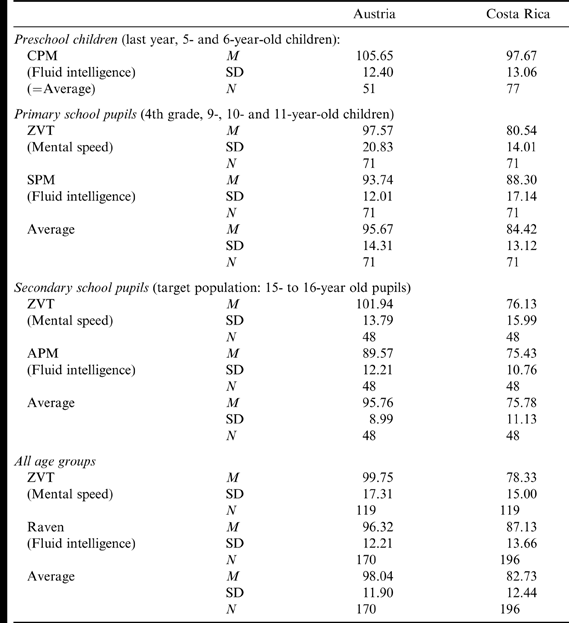
In the second standardization procedure the results for ZVT and the Ravens were standardized using published test norms and, if necessary, a Greenwich adaptation and Flynn correction (see Table 3). For the ZVT, a ‘standard’ Flynn effect correction (−10.85 IQ points) would have produced an Austrian mean of 88.9 IQ points, clearly below the expected value of 100 or 99. But why should Austrian pupils differ so much in mental speed from German ones, when both countries obtain very similar results in psychometric and student assessment studies (in a current standardization, Austria IQ 99.28, Germany IQ 99.13)? As Silverman (Reference Silverman2010) has shown there is no indication for any secular rise in mental speed during the 20th century, and reaction times have actually become worse, implying an anti-Flynn effect. Therefore no Flynn effect correction was applied to the mental speed measure ZVT. This leads to an average IQ of 99.75 points for mental speed in the Austrian sample, which is compatible with the German standardization and with the results for fluid and crystallized intelligence. The Costa Rican average mental speed IQ of 78.33 is still 3 IQ points below the Costa Rican average derived from the standardization based on Austrian sample values (Table 2).
IQ cognitive ability results, Costa Rican and Austrian children, 2008 (standardization based on published test norms, Greenwich-adapted and Flynn-corrected)
Calculation of the Costa Rican values depends not only on the means of norms, derived either from this Austrian sample or from published test norms and their corrections, but also on the distributions in this Austrian sample or in the standardization samples, and on assumptions about the normality of latent ability distributions as opposed to measured scores. The ZVT standard deviations are larger in this Austrian sample than in the standardization sample (SD=17.31 vs 15.00), meaning the ZVT standardization sample was more homogeneous. Based on the properties of our sample, it is not plausible to assume that it is more heterogeneous than a representative German sample. (1) In the Austrian secondary school sample there were no students attending the high-ability Gymnasiums, and there were no immigrants. (2) Mentally handicapped children are missing. (3) The Austrian sample was recruited in small towns, not in the city of Vienna with its large cognitive elite and many low-scoring labourers and immigrants. (4) Flynn effects tend to be larger in low-ability groups than in high-ability groups leading to a more homogeneous age cohort. In correspondence with this the Raven results in the Austrian sample were more homogeneous than the standardization samples in the Raven manual (SD=12.21 vs 15.00).
These considerations led to a correction of the ZVT standard deviation. The Raven SD of around 12.21 based on this sample information is more plausible and additionally highly robust across age groups (SDPre=12.40, SDPrim=12.01, SDSec=12.21). However, comparing the three cognitive ability measures speed, fluid intelligence and crystallized intelligence in Table 2 reveals that differences between countries are smaller on tests of fluid intelligence than on tests of speed or crystallized intelligence. Therefore it was decided not to influence the cross-country differences by using different standard deviations. One common standard deviation slightly above the Ravens' empirical mean but well below the ZVT mean was used: SD=13.00. This SD of 13 was also used for the student assessment comparisons.
Finally there are large differences across age. In preschool (using CPM) the results in both countries are higher than in primary school (using SPM), and in both countries the primary school results in the Raven are higher than the secondary school results (Table 3). This pattern for both countries is not plausible. The ZVT results indicate an average level in the Austrian secondary school sample. There is no indication that the preschool samples were elite samples. Maybe the Flynn correction was too small. The secondary school APM results (with Flynn correction) are far lower than the ZVT results (without Flynn correction). Flynn effects are frequently higher for younger children than for older youth and adults in countries as diverse as Britain (Flynn, Reference Flynn2009; Lynn, Reference Lynn2009, Table 3), USA (Rindermann & Thompson, Reference Rindermann and Thompson2013) and Taiwan (Chen et al., Reference Chen, Liao, Chen, Chen and Lynn2013). Thus the secondary age group Flynn correction was reduced from dec=2.0 to 0.5 points/decade, subtracting 1.45 instead of 5.80 points from the APM score. And a conservative downward correction of 3 points was applied to the preschool results of both countries, bringing the Austrian IQ to 103. The primary school sample was corrected upwards by 3 points, assuming that the Flynn correction was too strong or both samples were negatively selected. The results of ZVT and SPM are now similar.
All these corrections reduce the age-group differences, but do not abolish them. These corrections have their uncertainties, but there are no recent test standardizations in Great Britain and in this study in Austria and Costa Rica there are not the usually ‘large-scale’ study samples. Adjusting scores based on theoretical assumptions and empirical results leads to more valid outcomes.
Rather than following the above procedures, it is possible to suppose Flynn effects only for younger but not older students on the Raven tests (referring to Flynn, Reference Flynn2009) and on school-related tests (referring to TIMSS studies, which found improvement over time for 4th graders but not 8th graders; Mullis et al., Reference Mullis, Martin, Foy and Arora2012, pp. 51–64; Martin et al., Reference Martin, Mullis, Foy and Stanco2012, pp. 48–62). As long as there are no total current surveys in Great Britain and Costa Rica sample results cannot be used as unbiased estimates and therefore will never be free of considerations and corrections based on theory and empirical findings in achieving sound results. The authors also think that it is important to show the existing uncertainties and possible ways of dealing with them when researchers compare test scores across countries. This is common practice in economics, e.g. for comparing productivity, income and wealth, but is less commonly done in cross-cultural cognitive ability research.
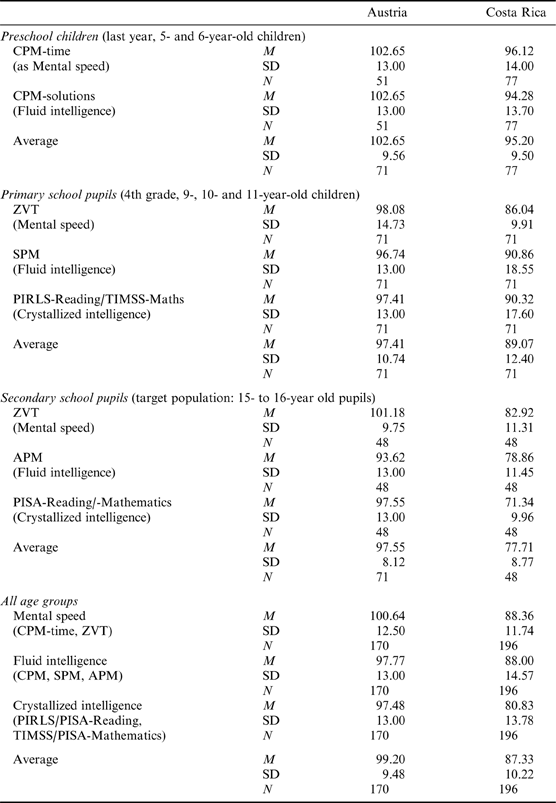
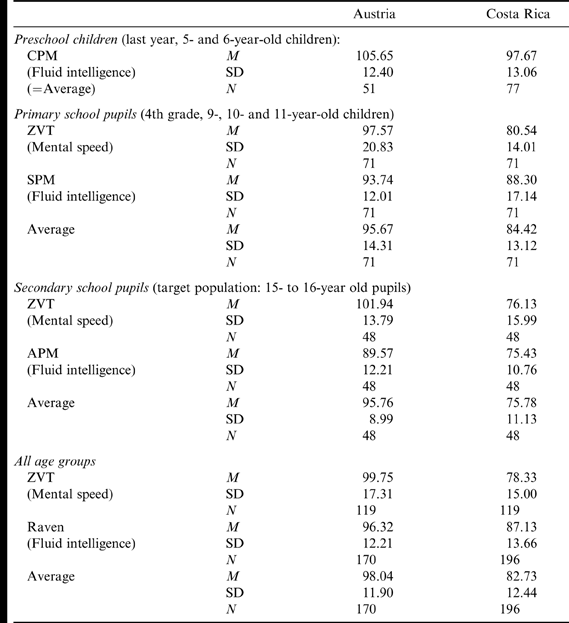
The results of the third standardization procedure are presented in Table 4. Average cognitive ability levels across ability constructs, tests and age groups ‘are’ M Au=99.20 and M CR=87.33 IQ points. ‘Are’ is put in quotation marks to emphasize that these values depend on assumptions and corrections. Differences increase with age, from preschool d IQ=7.45 and primary school d IQ=8.34 to secondary school d IQ=19.84. This general pattern could be observed with all scaling procedures. Differences are larger in crystallized intelligence than in fluid intelligence and mental speed, a pattern also observable in raw value comparisons and standardizations based on the Austrian sample (Tables 1 and 2). When g-factor scores (based on normed scales) are compared, differences between the countries increase from d Prim=8.34 to d Prim=13.27 IQ (standardized ds multiplied by 15; by 13: 11.50 IQ) in primary school and from d Sec=19.84 to d Sec=39.29 (multiplied by 13: 34.05) in secondary school.
IQ cognitive ability results, Costa Rican and Austrian children, 2008 (standardization based on norms, Austrian results and theoretical assumptions)
Sex/gender differences are rather unsystematic across ages. However, as in other studies (e.g. Flores-Mendoza et al., Reference Flores-Mendoza, Widaman, Rindermann, Primi, Mansur-Alves and Couto Pena2013), girls have higher mental speed (M ♂=93.21 and M ♀=95.48 IQ points, SD=11.97, same pattern in Austria and Costa Rica) whereas boys show higher fluid intelligence (M ♂=94.25 and M ♀=91.97 IQ points, SD=13.67, same pattern in Austria and Costa Rica). In crystallized intelligence there is no robust pattern. Girls very slightly outperform boys in reading literacy (M ♂=90.38 and M ♀=90.71 IQ points, SD=13.72), and boys outperform girls in mathematics (M ♂=92.27 and M ♀=88.24 IQ points, SD=12.65).
Cognitive ability estimation for total Costa Rican youth and society
Finally, we tried to estimate ability values for total Costa Rican youth and society. Some children and youth will not attend preschool and secondary school, but because primary attendance is mandatory it was assumed that the entire cohort is in primary school (CINDE, 2011). There are no private schools in the sample: these are attended mainly by the children of wealthier and better-educated parents, but only 8–10% of elementary and secondary school students are enrolled in private schools (CINDE, 2011; see also www.indexmundi.com/facts/costa-rica/school-enrollment). These two effects (omitting weaker youth out of school and smarter youth in private schools) tend to cancel each other out. Because no deviation larger than ±1 IQ point was expected, the student result was accepted as an estimate for the entire age cohort (IQ 87).
However, about 4% of Costa Rican adults are illiterate (CINDE, 2011), and the average level of adult schooling is lower than among youth. In 2000 only 91% of adults older than 24 years had ever attended school, and average length of school attendance for adults above 24 years was 6.01 years (compared with Austria: 8.80 years, UK: 9.35 years; Barro & Lee, Reference Barro and Lee2009). It is estimated that today's Cost Rican youth have an average of around 10 years of education (100% 6 years elementary and 91% 5 years secondary minus a dropout rate; www.tradingeconomics.com/costa-rica/school-enrollment-secondary-percent-gross-wb-data.html; 4th January 2012). It is assumed that in Costa Rica, being an ‘emerging’ country with most likely lower quality of schooling, schooling-related IQ gains are somewhat smaller (e.g. Van de Vijver & Brouwers, Reference Van de Vijver and Brouwers2009) than the usual 3 IQ points per year of school attendance (Winship & Korenman, Reference Winship, Korenman, Devlin, Fienberg, Resnick and Roeder1997). Additionally, school-related gains are generally smaller at older ages (Arum & Roksa, Reference Arum and Roksa2011). Therefore an IQ gain of 2 points per school year was estimated. This estimate is supported by the age-related increases in performance gaps in the sample. Thus 8 IQ points from the youth estimate of IQ 87 were subtracted (10 vs 6 years school attendance, 4 years×2 IQ points), resulting in an estimated average adult IQ of 79.
Some may have acquired more education as adults, and experiences other than schooling can raise intelligence. On the other hand, general developmental conditions in the past were almost certainly worse: poorer nutrition and health, no computers and related gadgets etc. For the entire Costa Rican population (in 2010: 0- to 19-year-old group around 34%, 20- to 49-year-old group 47%, 50- to 99-year-old group 19%; DESA, 2010), this results in an estimated average IQ of 82 (0.34×IQ 87+0.66×IQ 79). In a second version only the difference compared with Austria was used, the benchmark country: Costa Rican adults have on average 2.79 years less education (6.01 vs 8.80 years). This translates into an estimated adult IQ of 81 (IQ 87−(2.79×2 IQ points)). Using the same formula as above this results in an IQ of 83 for the total population (0.34×IQ 87+0.66×IQ 81). The last approach has the advantage that it considers also a lower adult educational level in Austria (i.e. considering the worldwide rise of education in calculating IQs).
Other measures
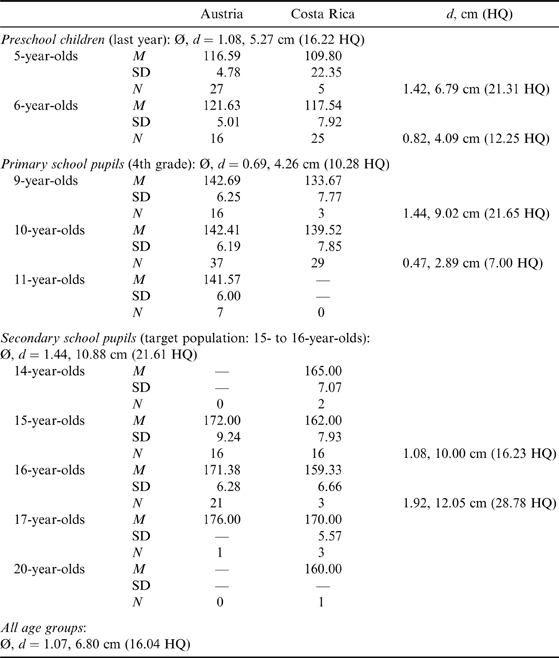
Height is a general indicator of standard of living (Komlos & Kriwy, Reference Komlos and Kriwy2003). In this study, Austrians are 6.80 cm taller than Costa Ricans (d=1.07, 16.04 HQ (height quotient) when scaled the same way as IQ, see Table 5). The difference is larger in secondary school (10.88 cm, d=1.44, 21.61 HQ) than in preschool (5.27 cm, d=1.08, 16.22 HQ) and primary school (4.26 cm, d=0.69, 10.28 HQ). The height differences are not due to undernutrition. The body mass index (BMI) is higher in Costa Rica (19.35 kg/m2) than in Austria (17.59 kg/m2). The difference in BMI units is −1.76 (d=−0.89, −13.37 BQ).
Height differences, Costa Rican and Austrian children, 2008
d-calculation: Austrian SD as reference sample; HQ, Height Quotient (similar to IQ) converted from d by multiplying by 15; means in d and HQ across ages (not age-groups) weighted for N.
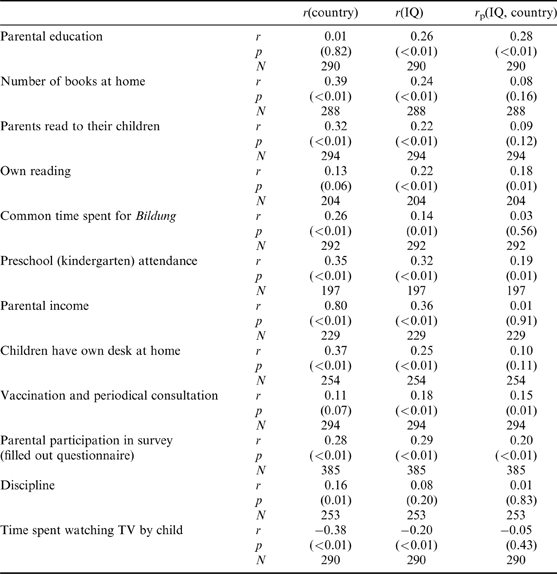
Table 6 lists correlations of family and child background variables with country (positive correlation: higher values in Austria), with cognitive ability mean (speed, fluid and crystallized averaged) and with cognitive ability mean when country is partialled out. Parental educational level (school and professional degrees of both parents averaged, α=0.83) is similar in both countries, but robustly correlated with children's ability (r p=0.28). One degree higher (e.g. from primary to secondary or from high school degree to university degree) corresponds to 1.96 IQ points (not corrected for country). Austrian families have more books (on average 208 vs 86 in Costa Rica), and 166 additional books add 1.00 IQ point (uncorrected). Austrian parents read more frequently to their children (in Costa Rica on average twice a week, in Austria four times). This corresponds to 2.41 IQ points. Children in Costa Rica read twice a week and in Austria three times; this corresponds to 2.11 IQ points. Common leisure time spent on Bildung (education and culture) is an index variable consisting of playing brain-teaser games, attending museums and theatres, playing an instrument and doing handcraft together with parents (Cronbach's α=0.60). This index is half a standard deviation higher in Austria (d=0.52). One standard deviation adds 1.73 IQ points.
Correlations of possible cognitive ability determinants with country and ability, Costa Rican and Austrian children, 2008
p=significance, r(country)=correlation with country (1 Costa Rica, 2 Austria, positive coefficients mean higher values in Austria); r(IQ)=correlation with cognitive ability sum (mental speed, fluid and crystallized intelligence), r p(IQ, country)=correlation with cognitive ability sum, country partialled out.
In Costa Rica 69% of primary and secondary school children have attended preschool, and in Austria 95%. Attending preschool adds 10.40 IQ points (not corrected for country, corrected 5.76 points). Parental income (family income per month in Euro) is seven times higher in Austria than in Costa Rica (2204 vs 340 Euro); 250 Euro correspond to 1 IQ point (not corrected for country, corrected 2002 Euro for 1 IQ point). More children in Austria have their own desk at home (94% vs 63%). A desk contributes 7.82 IQ points (not corrected for country, corrected 1.82 points).
There is a small cross-country difference in vaccinations and periodical consultation of pediatricians (index-variable). Receiving all necessary vaccinations and regular pediatric check-ups corresponds to 8.38 IQ points. Parental participation in survey (filled questionnaire was returned to the test administrator by child) was better in Austria (90% vs 66%) and is associated with 8.90 IQ points (corrected for country 5.60 points). Discipline in school (no disrupting of instruction, not skipping class) is slightly higher in Austria: ‘sometimes’ instead of ‘frequently’ or ‘never’ instead of ‘sometimes’ is associated with 2.44 IQ points (uncorrected). Children in Costa Rica watch TV an average of 146 minutes per day; in Austria 98 minutes. One hour subtracts 2.28 IQ points (corrected for country 0.66 points). Of course, these variables are correlated among themselves and with country. Assumed causal effects and their theoretical meanings need clarification.
Attempt at a (causal) path analysis of national differences
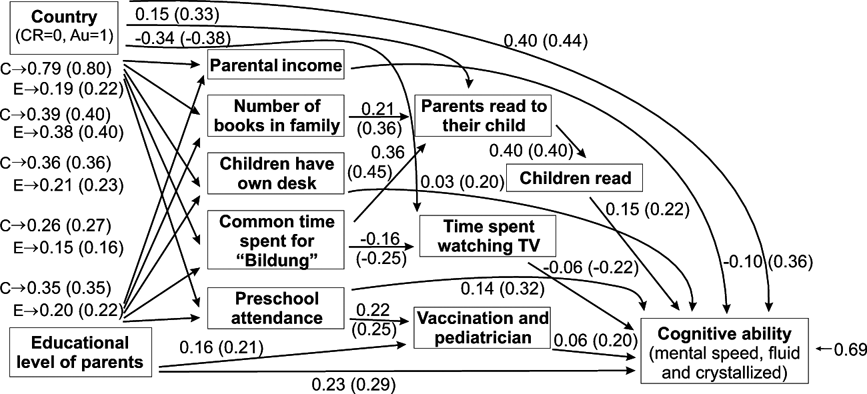
Is it possible to explain the 12-point IQ gap between Costa Rica and Austria? For an explanation a convincing theory is needed that is compatible with results from earlier empirical research and that is supported by robust associations within and across countries. A model was developed (see Fig. 1, model has a good fit) starting with country and parental educational level. Country is an atheoretical variable that may represent aspects of culture, social and physical environment and genes. Country itself has no explanative value. Parental educational level stands for home environment, parenting styles and genes (Hart & Risley, Reference Hart and Risley1995). Ideally, it would be possible to reduce the direct (but atheoretical) effect of country on intelligence to zero by including as mediators all those variables that could create differences between countries and which are themselves influenced by ‘country’ (e.g. as culture or wealth). It was assumed that both country and parental education influence the environmental conditions that are important for children's cognitive development: higher parental income (β Country→PIn=0.79, β Education→PIn=0.19), number of books, children having their own desk, time parents spend with children on Bildung activities and preschool attendance. For all these hypothesized mediators the macro-social country effect is stronger than the individual parental effect. People shape their environment, but are constrained heavily by macrosocial conditions. One example: being skilled or not (e.g. as craftsperson or physician) will usually raise income everywhere, but being born in Western Europe vs Central America or in the 20th compared with the 19th century has a much larger effect.
Model for cross-country differences between Costa Rica and Austria (N max=385, FIML, CFI=0.95, SRMR=0.04; C → means effect of country; E → means effect of parental education; positive effect of country means higher value in Austria; correlations are in parentheses).
Country and parental education have independent direct effects on children's cognitive ability (β Co→CA=0.40, β PEd→CA=0.23). Again the country effect is larger. Country accounts for 10.47 IQ points, one step higher in parental educational degree for 1.87 points. Many effects are indirect in the sense that mediating variables can be identified: in Austria more parents read more frequently to their children, and this appears to stimulate children's own reading either through modelling, creation of a habit or even through shared ‘genes for reading’. Frequent reading by the child can further the child's cognitive ability by training of thinking processes and acquisition of vocabulary and knowledge (Protzko et al., Reference Protzko, Aronson and Blair2013), although the association can also be caused by pleiotropic genes that influence both learning ability and the propensity for reading (β OR→CA=0.15, 1.43 IQ points). Number of books, indicating environmental opportunities for learning and cognitive training, is an intervening variable (Rindermann et al., Reference Rindermann, Michou and Thompson2011). Also children who have their own desk have a better opportunity to learn (β OD→CA=0.03, 0.78 IQ points). Parents who spend time with their children attending museums or theatres are also likely to read more to their children, and the children spend less time watching TV (β TV→CA=−0.06, −0.67 IQ). Usually, watching TV is more a distraction than an element of Bildung (education and culture). Time for TV watching is likely to compete with time for reading, doing homework or other cognitively more stimulating activities. Therefore it can potentially have a negative impact on cognitive development.
Better educated parents care more for the health of their children through vaccinations and pediatric check-ups. This will further healthy development and thereby cognitive development (β VP→CA=0.06, 3.99 IQ points). Another important variable is preschool attendance (β Pre→CA=0.14, 4.70 IQ points). Early educational interventions, from special programmes to regular kindergarten, have been shown to have positive impacts on cognitive and personality development (Pianta et al., Reference Pianta, Barnett, Burchinal and Thornburg2009; Rindermann & Baumeister, Reference Rindermann and Baumeister2012). The positive impact of kindergarten attendance on medical care may have two causes. First, preschool educators can ‘diagnose’ sick children and initiate steps for medical referral. Second, preschool educators can influence parents' health care behaviour. Like other hypothesized mediators, these variables are also indicators for more general conditions, such as general interest of parents in the well-being of their children. In a simpler model (not displayed) considering only parental education, income and vaccination and pediatric visits, parental education has a stronger effect on health care than income (β PEd→VP=0.17, r=0.19, β PIn→VP=0.09, r=0.13). It's an ability effect, not a wealth effect (Gottfredson, Reference Gottfredson2004).
Finally, there is an important suppressor effect: parental income. In spite of very large country differences, this has no positive effect on children's cognitive development (β PIn→CA=−0.10). This challenges any interpretation of cross-country cognitive differences as wealth difference or poverty effects. Some effects are rather small (β<0.10), but their ‘effects’ in the IQ metric are not negligible. These effects should be checked for generalizability, e.g. with data from the coming PISA surveys in Costa Rica. Their causality should be explored in experimental training studies.
Discussion
There is no single answer to the question about the levels of cognitive ability across countries. Results depend on standardization samples, benchmark countries, survey years, chosen age groups, chosen tests and applied corrections. This does not mean that national ability levels are not amenable to study, but that results are better expressed as a range of IQs rather than one single IQ value. It was found for Costa Rican pupils as the lower bound an average of 82 IQ points when standardization was based on the Austrian sample or based on published test norms, either Greenwich-adapted or using UK norms. A combined procedure using published norms and the Austrian sample (Greenwich-adapted norms), averaging across all tests and age groups and correcting SDs and for the Flynn effects when indicated, arrived at an average of 87 IQ points (Greenwich-IQ). This value is only meaningful for youth in public schools. Because there were neither youth who were out of school nor private schools in the sample, it was assumed that negative and positive biases cancelled each other. For the less-schooled adult population an average IQ of 79 to 81 was estimated, and for the entire population an average of 82 to 83.
These results are compatible with those of other studies (LLECE, PISA, IMO), which produced IQ estimates of 92, 88, 85 and 84. Estimated IQs of the Austrian reference population ranged between 98 and 99. Based on large international surveys and corrections a Greenwich-IQ of 99 was estimated for Austria. If migrants were excluded, the average IQ in Austria would rise by 0.68 IQ points. This would slightly raise the Austrian–Costa Rican difference from 12 to 13 IQ points.
Earlier studies have shown Costa Rican ability levels to be above the Latin American average, though well below European and Western standards of around 96 to 100 IQ points. An important contribution of the present study is the demonstration that the gap between Costa Rica and Austria increases with age, being largest in secondary school. This result is not unique to Costa Rica. Declines in (age-normed) cognitive ability with increasing chronological age, relative to economically advanced societies, have been observed in many developing countries, for example in Saudi Arabia (Batterjee, Reference Batterjee2011) and Darfur (Khaleefa et al., Reference Khaleefa, Lynn, Abulgasim, Dosa and Abdulradi2010). There are several possible explanations for this. According to one hypothesis, the increasing gaps are caused by the cumulative effects of poor environmental conditions in school, family and wider society. Of these three possibilities, conditions in school are more likely and family-related conditions are less likely because family influence is expected to be most important in preschoolers.
It was found that the difference between countries, and especially the increase of this difference from primary to secondary school, was greater for crystallized intelligence (i.e. knowledge and competence acquired in school) than fluid intelligence (i.e. abstract reasoning ability not explicitly taught in school): in primary school, d IQFl=5.88 vs d IQCr=7.09; in secondary school, d IQFl=14.76 vs d IQCr=26.21. These results agree with earlier observations that differences between countries tend to be approximately 30–40% larger in student achievement studies such as TIMSS and PISA than in IQ studies, a difference that has been attributed to poorer quality of schooling in less developed countries (Meisenberg & Lynn, Reference Meisenberg and Lynn2011). Another observation that is relevant in this context is that Black–White test score differences in the United States also increase with age, both in children (Jensen, Reference Jensen1977) and in the 15–23 age range (Meisenberg, Reference Meisenberg2009). Again, cumulative effects of environmental factors, and more specifically different experiences in school, can be suggested as possible causes.
However, there is also a height difference, which is far larger in secondary school (d=10.88 cm) than in preschool and primary school (d=4.77 cm). Because BMI is higher in Costa Rica than in Austria, the height difference is more likely to be caused by genetic differences than by malnutrition. Nutrition has been proposed as one reason for cognitive differences between countries, and for the Flynn effects that have contributed to these differences (Lynn, Reference Lynn1990; Colom et al., Reference Colom, Flores-Mendoza and Abad2007). Nevertheless, there is no indication that poor nutrition is a cause of lower cognitive ability in Costa Rica.
The results of the cognitive tests are also compatible with genetic theories. Heritability, defined as proportion of individual-differences variance in the population that is explained by genetic factors, is known to increase monotonically from early childhood to late adolescence (Haworth et al., Reference Haworth, Wright, Luciano, Martin and de Geus2010; Johnson, Reference Johnson2010). Therefore genetically based differences are expected to increase with age in children and adolescents. However, known environmental mediators need to be examined first. For correlations and the path analysis theoretically plausible variables were selected. Of the 12 IQ point difference between countries only 2 IQ points can be explained (difference of the gross 12 IQ effect of country and its net direct impact in the path analysis) with plausible and measurable variables that are related to cognitive development at the individual level while being sufficiently different between the countries to explain part of the cognitive differences between them. Important factors of this kind were own reading, preschool attendance and vaccinations/periodical consultation of pediatricians.
Practically nothing about specific genetic effects on intelligence is known, nor their allele frequencies in Costa Rica and Austria. But information on ancestry and the typical IQs of ancestral populations can be used to predict Costa Rica's ‘theoretical’ IQ. Putterman and Weil (Reference Putterman and Weil2010) estimated the origins of the Costa Rican population as 61% Spanish–European (average IQ 97; own calculation), 30% Native American (average IQ 86; Lynn, Reference Lynn2008, p. 267) and 9% sub-Saharan African (own calculation IQ 70, cross-study average IQ 75; Rindermann, Reference Rindermann2013). From these numbers (0.61×97+0.30×86+0.09×70 or 0.61×97+0.30×86+0.09×75), and assuming that there has been no selective migration according to intelligence, an IQ of 91 or 92 was expected. Transferring members of current Spanish, Native American and African populations in their shares of today's Costa Rican population to an imagined ‘Costa Rica 2’ would result in a higher average IQ of 91 to 92 than the actually measured IQ of 87. The predicted IQ is at least 4 points too high. Ancestry effects, which can be either genetic or cultural, could statistically explain only 7 or 8 of the 12 point difference. This is also below the 10 IQ pure country effect in the path analysis. The strong but not exclusive effect of ancestry in these results conforms to a worldwide pattern that has been observed in a recent analysis of 130 IQ test administrations by Christainsen (Reference Christainsen2013). The causes of differences in the other country-related variables, including number of books, own desk, time spent for cultural activities (Bildung), preschool, reading to the child, own reading, TV watching and vaccination, also remain uncertain.
There are more speculative possibilities. Neubauer and Benischke (Reference Neubauer and Benischke2002) assumed that intelligence differs between Central America (Guatemala) and Europe (Austria) as a result of culturally different speed motivation. In their sample of 11- to 12-year-old 5th grade students, the difference was approximately 19 points for mental speed and 27 points for fluid intelligence. But there is no indication that test motivation or test speed motivation were lower in Costa Rica than in Austria. In our study the children were given incentives for participating and the conductor of the survey (Eva-Maria Pieber/Stiegmaier) reported high motivation of the children. She did mention a generally slower speed of life (‘pura vida’ mentality, ‘easy-going’), similarly reported by Levine (Reference Levine1997). But why should slower life speed depress achievement in the Ravens or the school achievement tests? Time limits are generous in both kinds of test. Therefore speed could not be an important limiting factor for performance.
The country effect was much larger than any specific, measurable effect. There have to be strong macro-social factors whose nature remains elusive. Unimpressive cognitive performance may be related to low perceived importance of schooling and cognitive ability, but there are no data that would speak to this possibility. Cultural ‘inertia’ can be invoked to ‘explain’ sluggish progress, but how can this concept be measured, let alone explained? The mediator variables that were used, such as number of books and frequency of parents reading to their children, are imperfect indicators of attitudinal factors that are likely to work also through expressions other than those that were quantified for this study.
Are differences between countries amplified by trans-generational feedback-loops between cognitive abilities of parents and teachers, of important adults as neighbours, physicians, journalists and politicians and of friends and classmates, the environments they create for children, and the cognitive abilities that these children develop? According to one view, slightly higher average cognitive ability that has been attained in a country by environmental improvements in or out of school will lead to better conditions for the development of children's intelligence resulting in stronger long-term effects. The same can, in theory, be triggered by small long-term genetic trends. Improved environmental conditions will raise the average intelligence in the children's generation even more, and these more intelligent children will create even better conditions for the cognitive development of their children. This mechanism can produce the sustained secular gains in intelligence (Flynn effects) that have characterized Europe and North America during the last century, and it can explain the great magnitude of IQ differences between countries today. Researchers can try to identify those features of the environment that are most important for developing children's intelligence, although one very important environmental factor is rarely measured and difficult to manipulate: exposure of children to highly intelligent adults.
One possibility for further research is to go into the families and observe everyday life: the communication, argumentation, reasoning, thinking, speaking, playing and learning; observe lifeworld cognition and its outcomes, in the form of belief systems and subjective causal explanations for daily experiences such as sickness or success; observe this in the family, in neighbourhoods, in kindergarten and school; and do this in two contrasting countries. Such a ‘grounded theory’ approach would help to develop a theoretically well-founded model of interwoven determinants leading to cross-culturally different cognitive ability levels.
Nevertheless, some recommendations for improving cognitive development in Costa Rica can be given: provide all children with preschool education, give children more books and read to children. Motivate, if not urge children to read more and watch less TV, ease their learning by giving them a desk, go to museums and play smart games with them (e.g. Mastermind or chess) and keep them healthy; finally, based on general educational research, send them to schools with demanding curricula, and keep them there for a longer time. Countries in Latin America and the Caribbean have seen substantial improvements in IQ and school achievement in recent years (e.g. Meisenberg et al., Reference Meisenberg, Lawless, Lambert and Newton2006; Meisenberg & Woodley, Reference Meisenberg and Woodley2013). We can only hope that these trends will continue.
Acknowledgment
The authors thank all the children and parents who helped through their participation in this study.