Introduction
Cordierite-orthopyroxene and/or -orthoamphibole rocks (also known as CORs) represent relatively unusual mineral assemblages that provide instructive information on the metamorphic development of the terranes in which they are found as well as the processes that form their protoliths. They were first described among the classic Finnish metabasite rocks at Orijärvi by Eskola (Reference Eskola1914). Since Eskola’s work, this lithology has been noted as a minor constituent in many metamorphic terranes worldwide ranging in age from Archean to Phanerozoic and commonly associated with massive sulfide deposits (Pan and Fleet, Reference Pan and Fleet1995; Roberts et al., Reference Roberts, Oliver, Fairclough, Hölttä and Lahtinen2003; Heimann et al., Reference Heimann, Spry, Teale and Jacobson2006). This rock type has unusual bulk compositions being enriched in Mg and Al and depleted in Ca, Na and K. This bulk composition commonly yields the diagnostic, typically low variance, cordierite-orthopyroxene/orthoamphibole (i.e. anthophyllite and/or gedrite) metamorphic mineral assemblage (Diener et al., Reference Diener, Powell and White2008). In addition to cordierite and orthorhombic inosilicate(s), CORs can have other petrologically distinctive minerals such as aluminosilicate polymorphs, biotite, cummingtonite, garnet, plagioclase, quartz, staurolite, talc, rutile and ilmenite that are responsive to metamorphic pressure-temperature (P-T) conditions (e.g. Spear, Reference Spear1993). As such, CORs are useful petrological monitors of the overall P-T history of metamorphic terranes.
Cordierite-orthopyroxene (and/or orthoamphibole) rocks have been the subject of many metamorphic studies because of their unusual bulk composition and uncertain protolith. Their bulk compositions do not correspond to common igneous or sedimentary protolith compositions (e.g. basaltic or pelitic compositions) thus making the petrologic parentage of CORs debatable (Schneiderman and Tracy, Reference Schneiderman and Tracy1991). Diverse origins for CORs have been proposed such as: (1) metamorphism of sediments with the requisite cordierite-orthopyroxene (and/or orthoamphibole) composition (Reinhardt, Reference Reinhardt1987; Pan et al., Reference Pan, Fleet and Stone1991; Labotka and Kath, Reference Labotka and Kath2001); (2) melt residuum of a metamorphosed common protolith (Grant, Reference Grant1968; Hoffer and Grant, Reference Hoffer and Grant1980); (3) syn-metamorphic protolith metasomatism (Eskola, Reference Eskola1914; Eckelmann and Poldervaart, Reference Eckelmann and Poldervaart1957; Pitra et al., Reference Pitra, Boulvais, Antonoff and Diot2008; Driouch et al., Reference Driouch, Debat, Ganne, BÉziat, Kriegsman and Martignole2017); and (4) pre-metamorphic protolith alteration or metasomatism (Vallance, Reference Vallance1967; Schumacher, Reference Schumacher1988; Smith et al., Reference Smith, Dymek and Schneiderman1992; Burger et al., Reference Burger, Peck, Johnson, Tierney, Poulsen, Cady, Lowell, MacFarlane, Sincock and Archuleta2004; Pownall et al., Reference Pownall, Waters, Searle, Shail and Robb2012). Though none of these proposed origins explain all COR occurrences, the most common origin is pre-metamorphic metasomatism of intermediate-to-mafic volcanogenic rocks in seafloor hydrothermal systems (e.g. Schumacher, Reference Schumacher1988). As such, many CORs have tectonic implications for the terranes in which they are found.
Metamorphosed xenoliths and xenocrysts preserved in ∼2.80 Ga granitic rocks from the eastern Beartooth Mountains preserve key pieces of evidence of the tectonometamorphic development of ancestral North America during the Archean. Among the xenolithic rock types of the eastern Beartooth Mountains is a COR lithology that was recognised in early reconnaissance mapping (James, Reference James1946; Eckelmann and Poldervaart, Reference Eckelmann and Poldervaart1957), however its role in the geological history and petrogenetic processes has yet to be defined. Given the petrological value of CORs, this lithology can provide important complementary information on the geological history of the Archean in the northern Wyoming Province. The purpose of this investigation is to constrain the petrological evolution of this xenolithic COR lithology as a means for improving reconstructions of the local metamorphic P-T history. To accomplish this objective, mineral- and whole-rock geochemistry, paired with detailed petrography, are used to constrain the conditions of COR metamorphism using mineral textural relations, chemical thermobarometry and whole-rock composition thermodynamic modelling.
Geological setting
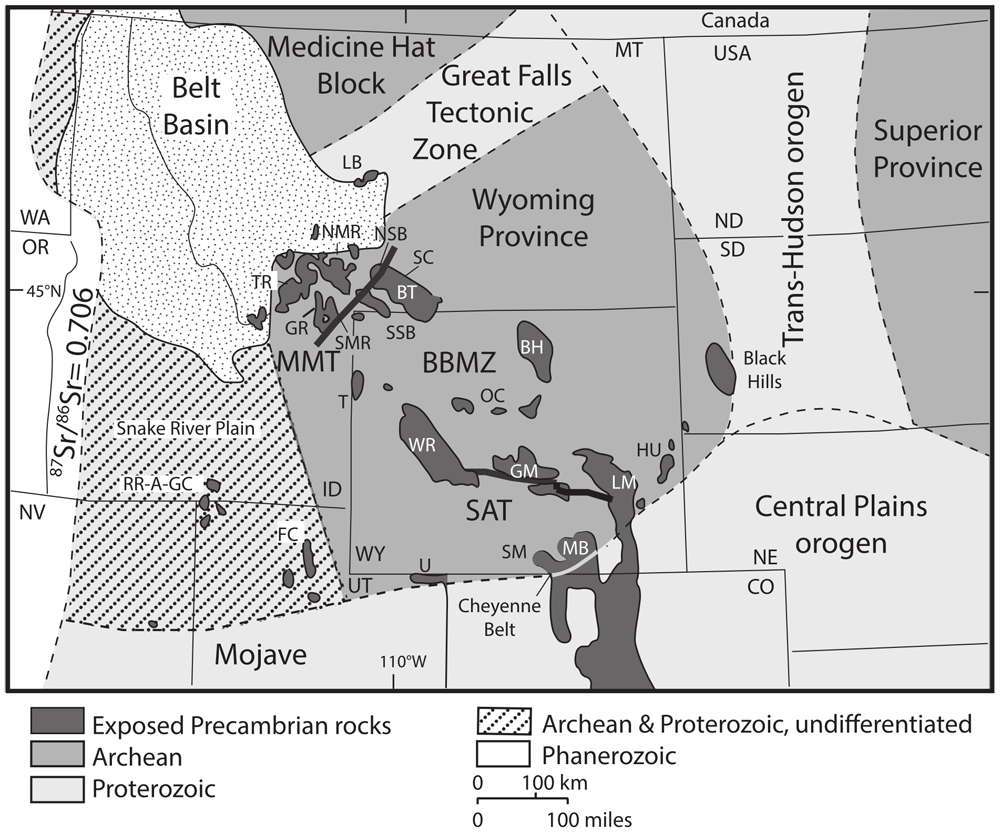
The Wyoming Province is an Archean craton in the western United States that is surrounded by Palaeoproterozoic collisional orogenic zones to the north (Great Falls Tectonic Zone), east (Trans-Hudson Orogen) and south (Cheyenne Belt) and Archean and Proterozoic terranes to the west (Farmington Zone) (Mogk et al., Reference Mogk, Frost, Mueller, Frost, Henry, Whitmeyer, Williams, Kellett and Tikoff2022) (Fig. 1). There are three major subdivisions of the craton: the Montana Metasedimentary terrane the Beartooth-Bighorn magmatic zone; and the southern accreted terranes (Mogk et al., Reference Mogk, Mueller and Wooden1992; Mueller and Frost, Reference Mueller and Frost2006). The Montana Metasedimentary terrane is distinguished by sequences of high-grade metasupracrustal rocks intercalated with Palaeoarchean to Mesoarchean quartzofeldspathic gneisses whereas the Beartooth-Bighorn magmatic zone consists predominantly of ∼2.80 Ga plutonic rocks of the tonalite-trondhjemite-granodiorite (TTG) suite with older (up to 3.5 Ga) igneous and metamorphic xenoliths and xenocrysts (e.g. Henry et al., Reference Henry, Mueller, Wooden, Warner and Lee-Berman1982; Mueller et al., Reference Mueller, Shuster, Graves, Wooden and Bowes1988; Mogk et al., Reference Mogk, Mueller and Wooden1992). The southern accreted terranes comprise 2.70–2.60 Ga continental arc terranes formed in the waning stages of the Archean (e.g. Frost et al., Reference Frost, Fruchey, Chamberlain and Frost2006). Rocks from the Montana Metasedimentary terrane and Beartooth-Bighorn magmatic zone are characterised by a uniquely high radiogenic 207Pb/204Pb isotopic signature reflective of evolution from a similar high U/Pb reservoir (e.g. Mueller et al., Reference Mueller, Mogk, Henry, Wooden, Foster, Dilek and Furnes2014b; Mogk et al., Reference Mogk, Mueller and Henry2020). The Southern Accreted Terrane represents Neoarchean magmatic arc additions exotic to the rest of the Wyoming Province (Mogk et al., Reference Mogk, Frost, Mueller, Frost, Henry, Whitmeyer, Williams, Kellett and Tikoff2022). With the exception of select portions of the Southern Accreted Terrane that contain rocks displaying greenstone belt affinities, the Wyoming Province is most analogous to global Archean terranes that are predominantly comprised of high-grade gneiss belts (e.g. Windley and Smith, Reference Windley and Smith1976).
Geological map from Mogk et al. (Reference Mogk, Frost, Mueller, Frost, Henry, Whitmeyer, Williams, Kellett and Tikoff2022) showing the Wyoming Province and its three principle subdivisions: the Montana Metasedimentary terrane (MMT); Beartooth-Bighorn magmatic zone (BBMZ); and Southern Accreted Terrane (SAT), relative to surrounding terranes. Petrological divisions of the Beartooth Mountains are labelled thus: NSB – North Snowy block, SSB – South Snowy block, SC – Stillwater block and BT – Beartooth Plateau block. US state abbreviations are also indicated: MT – Montana, WY – Wyoming, etc.

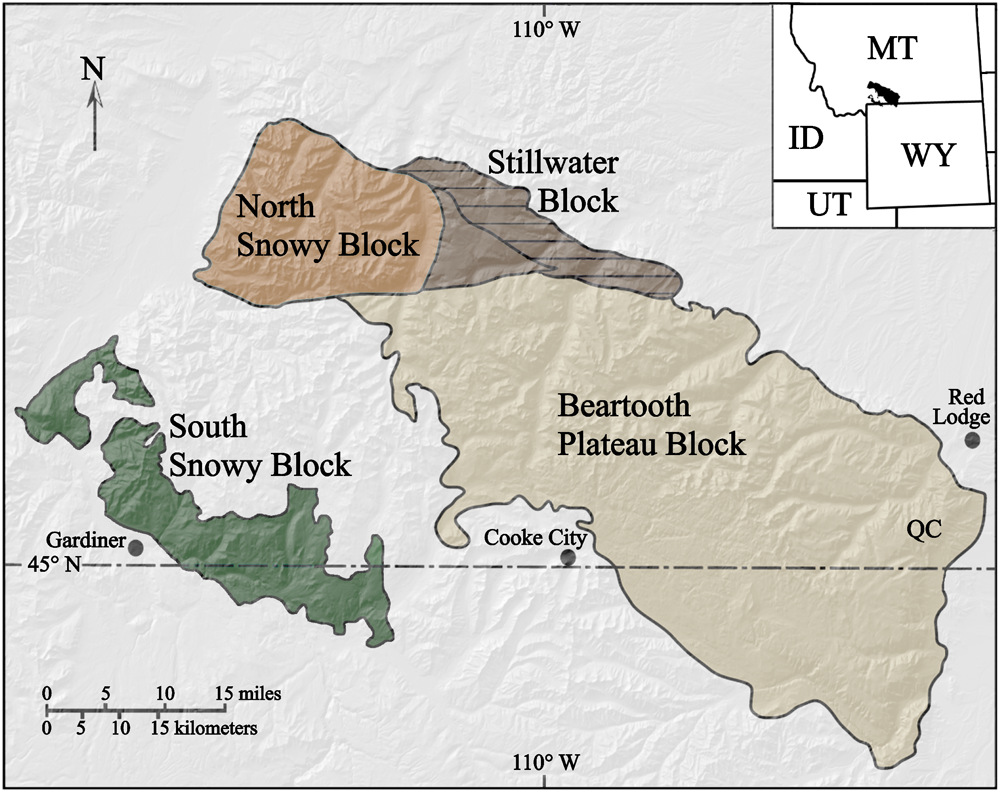
The Beartooth Mountains lie predominantly within the Beartooth-Bighorn magmatic zone and four main petrological subdivisions are recognised: the North Snowy block; the South Snowy block; the Stillwater block; and the Beartooth Plateau block (Fig. 2, Wilson, Reference Wilson1936). Rocks in the North Snowy block consist of seven distinct metaigneous and metasedimentary lithologies that were tectonically aggregated between 2.56 Ga and 2.74 Ga (Mogk et al., Reference Mogk, Mueller and Wooden1988; Mueller et al., Reference Mueller, Wooden, Mogk, Nutman and Williams1996). The South Snowy block contains the Jardine metasedimentary sequence, a series of metaturbidites deposited between 2.90 and 2.80 Ga, as well as multiple ∼2.80 Ga cross-cutting granitic plutons (Casella et al., Reference Casella, Levay, Eble, Hirst, Huffman, Lahti and Metzger1982; Thurston, Reference Thurston1986; Mueller et al., Reference Mueller, Mogk, Henry, Foster, Berndt, Grip, Hanson, Kotash, Maloney, Philbrick and Ware2014a). The 2.70 Ga Stillwater layered mafic intrusion comprises the bulk of the Stillwater block along with the surrounding contact metamorphic aureole of metasupracrustal rocks (Page, Reference Page1977). Lastly, the Beartooth Plateau block is dominated by voluminous ∼2.80 Ga TTG (meta-)plutonic rocks with older metamorphosed xenolithic lithologies, including the COR of interest, that are intercalated throughout (Henry et al., Reference Henry, Mueller, Wooden, Warner and Lee-Berman1982; Mueller et al., Reference Mueller, Wooden, Mogk, Henry and Bowes2010). The geology of the Beartooth Plateau block is generally representative of the Beartooth-Bighorn magmatic zone as a whole.
Map of the Beartooth Mountains modified after Mueller et al. (Reference Mueller, Wooden and Nutman1992). The Quad Creek COR xenolith is from the eastern edge of the Beartooth Plateau block, denoted by ‘QC’.

Metamorphic xenoliths within the 2.80 Ga TTG rocks of the eastern Beartooth Plateau block have experienced a complex geological history that spans much of the Archean. Ancient detrital zircons (up to 4.0 Ga in age) recovered from quartzite xenoliths record geochemical evidence for mafic crust production in the area that was probably related to plume-dominated tectonism over a zone of mantle upwelling that produced small batches of TTGs until ∼3.60 Ga ago (Mueller and Wooden, Reference Mueller and Wooden2012). Hafnium isotope data for detrital zircons and the development of meta-igneous xenolithic lithologies with calcic to calc-alkalic affinities suggest a change in crustal production mode to a system with new juvenile contributions from the mantle in a subduction-style tectonic regime initiated at ∼3.60 Ga with a major crust-forming event recorded at 3.30–3.20 Ga (e.g. Mueller et al., Reference Mueller, Mogk, Henry, Wooden, Foster, Dilek and Furnes2014b; Mogk et al., Reference Mogk, Frost, Mueller, Frost, Henry, Whitmeyer, Williams, Kellett and Tikoff2022). This period of enhanced crust formation resulted in the development of a rigidly connected pairing between the crust and mantle lithosphere at ∼3.00–2.80 Ga and a period of tectonic quiescence in the study area that accommodated deposition of passive margin or stable platform sediments (Mogk et al., Reference Mogk, Frost, Mueller, Frost, Henry, Whitmeyer, Williams, Kellett and Tikoff2022; Frost et al., Reference Frost, Mueller, Mogk, Frost and Henry2023). At 2.83–2.79 Ga, a stage of subduction-related igneous activity produced voluminous TTG lithologies, typified by the Long Lake Magmatic Complex in the Beartooth Mountains and the Bighorn Mountains (Barker et al., Reference Barker, Arth, Millard and Barker1979; Arth et al., Reference Arth, Barker and Stern1980), that comprise much of the Beartooth-Bighorn magmatic zone (Mueller et al., Reference Mueller, Wooden, Mogk, Henry and Bowes2010). The passive margin sediments together with mafic and ultramafic lithologies were metamorphosed to granulite-facies peak conditions (∼0.60–0.80 GPa and 750–800°C) and intermixed tectonically with the 3.20–3.50 Ga TTG gneisses prior to entrainment as xenoliths in the Long Lake Magmatic Complex igneous intrusions related to compressional subduction processes at ∼2.80 Ga (Henry et al., Reference Henry, Mueller, Wooden, Warner and Lee-Berman1982; Maas, Reference Maas2004). The Long Lake Magmatic Complex intrusions resulted in: (1) a regional amphibolite-facies overprint; (2) infiltration of late sub-solidus fluids that decreased the activity of water (CO2 or brines) that resulted in local dehydration of amphibole to pyroxenes in localised late-stage granulite assemblages formation; and (3) local greenschist-facies overprints (Mueller et al., Reference Mueller, Mogk, Henry, Wooden, Foster, Dilek and Furnes2014b; Henry et al., Reference Henry, Will and Mueller2015). The resulting multi-stage metamorphic P-T path preserved in the metamorphic xenoliths is commonly difficult to interpret and evidence for each metamorphic event is not preserved consistently among all xenolithic lithologies. However, an overall clockwise P-T path is inferred from xenolithic garnet-bearing migmatite lithologies in the study area (Guevara et al., Reference Guevara, Caddick and Dragovic2017; Tuttle and Henry, Reference Tuttle and Henry2023). This P-T path is consistent with the inferred continental arc subduction zone tectonometamorphic setting.
Proximal to xenolithic amphibolites and quartzites in the study area is a distinctive lithology containing cordierite, orthopyroxene and orthoamphibole (anthophyllite). The COR outcrop consists of <100 m2 of exposed material on the Quad Creek Plateau and was originally mapped by Arie Poldervaart and students (Eckelmann and Poldervaart, Reference Eckelmann and Poldervaart1957). Although the Quad Creek COR appears to be the only such lithology within the Beartooth Plateau block, other COR localities in the Beartooth Mountains have been described, specifically in the Stillwater block (Page, Reference Page1977; Labotka and Kath, Reference Labotka and Kath2001), and the South Snowy block (Casella et al., Reference Casella, Levay, Eble, Hirst, Huffman, Lahti and Metzger1982). Additionally, there are COR localities found in several ranges in the Montana Metasedimentary terrane to the west: Ruby Range (Dahl, Reference Dahl1979; James, Reference James1990; Alcock et al., Reference Alcock, Muller and Jercinovic2013); Tobacco Root Mountains (Burger et al., Reference Burger, Peck, Johnson, Tierney, Poulsen, Cady, Lowell, MacFarlane, Sincock and Archuleta2004); and the Highland and northern Madison ranges (Crenshaw, Reference Crenshaw2021). Since the initial field studies of Eckelmann and Poldervaart (Reference Eckelmann and Poldervaart1957), no subsequent studies of the Quad Creek COR have been published. This investigation seeks to fill this knowledge gap in the Beartooth literature by applying modern petrological tools, i.e. mineral microanalysis, mineral thermobarometry and whole-rock composition-based pseudosection diagrams, to describe the mineral and rock composition of the Quad Creek COR and to model its overall P-T path. Modelling the P-T path in the COR lithology may provide additional insights into the tectonic regimes operative within the northern Wyoming Province during the Mesoarchean.
Methods
Seven samples of the Quad Creek COR were examined using a variety of microanalytical and imaging methods to assess the petrological evolution of the rock. Polished thin sections were examined with optical and reflected light petrography as well as optical cathodoluminescence to characterise sample mineralogy and textures. The mineral-name abbreviations used are after Warr (Reference Warr2021).
Mineral composition and thermobarometry
Electron microprobe analysis (EMPA) was conducted using a JEOL 8230 electron microprobe in the Department of Geology & Geophysics at Louisiana State University (LSU) to determine major-, minor- and trace-element composition of minerals. Mineral compositions were analysed quantitatively for amphibole, biotite, cordierite, ilmenite, feldspar, pyroxene, quartz and rutile. Natural and synthetic standards were used to ensure data quality (see Supplementary material S1 for more information). Prior to quantitative analysis, samples were imaged using back-scattered electrons (BSE) and cathodoluminescence in the electron microprobe to optimise the placement of analytical points. Electron microprobe cathodoluminescence imagery utilised a blue-light filter to examine quartz grains prior to trace-element measurements of Ti as brightness in the blue region of the quartz cathodoluminescence spectrum (∼415 nm) has been shown to correlate with quartz Ti content (Spear and Wark, Reference Spear and Wark2009; Henry et al., Reference Henry, Zappettini and Dutrow2022).
Mineral quantitative analyses were normalised based on the appropriate number of oxygens for each mineral analysed (pyroxene – 6 O; plagioclase – 8 O; biotite – 22 O; and ilmenite – 3O). Cordierite was normalised based on 18 cations except for cations that might occupy the cordierite structural channels (Na, K, Ca, etc.) and 1.30 atoms of H2O per formula unit. Amphibole normalisation followed the procedure of Locock (Reference Locock2014) and naming followed the classification scheme of Hawthorne et al. (Reference Hawthorne, Oberti, Harlow, Maresch, Martin, Schumacher and Welch2012). Ferric iron contents were estimated primarily based on charge balance and stoichiometry for amphibole, ilmenite and pyroxene. In the case of biotite, the presence of ilmenite implies that Fe3+/Fetotal in biotite is ∼0.12 (Guidotti and Dyar, Reference Guidotti and Dyar1991). All Fe in cordierite and plagioclase is reported as FeO.
Numerous independent mineral geothermometers were used to calculate temperatures for various stages of the COR metamorphic history. These geothermometers include: Ti-in-biotite (TiB, Henry et al., Reference Henry, Guidotti and Thomson2005); Ti-in-quartz (TitaniQ, Thomas et al., Reference Thomas, Watson, Spear, Shemella, Nayak and Lanzirotti2010); Zr-in-rutile (Zrt, Tomkins et al., Reference Tomkins, Powell and Ellis2007); and Na-in-cordierite (Na-in-crd, low Na2O calibration – Wyhlidal et al., Reference Wyhlidal, Thöny, Tropper and Mirwald2008). The TiB geothermometer was originally calibrated for graphitic, peraluminous metapelites that equilibrated at ∼0.40–0.60 GPa. Although the present COR lithology does not contain graphite, the TiB geothermometer is still generally applicable and has an estimated error of ±12–24°C depending on the calculated temperature. TiB and TitaniQ are both calibrated for assemblages that contain a Ti-saturating phase such as the Quad Creek COR assemblage as it contains rutile. Rutile buffers the activity of titania (TiO2) at a fixed value (αTiO2 = 1), a requirement for accurate calculation of TitaniQ temperatures (within geothermometer error of ±20°C). Successful application of the Zrt geothermometer requires the presence of the buffering assemblage: quartz and zircon, both present in the Quad Creek COR. Given the relevant local metamorphic P-T conditions, Zrt thermometry temperatures were calculated in the beta-quartz stability field with an error of ±30°C. The Na-in-crd geothermometer relies on the pressure-independent, linearly temperature-dependent incorporation of Na in cordierite structural channels (Mirwald, Reference Mirwald1986). The Na-in-crd geothermometer was originally calibrated in pelitic systems with albitic plagioclase and commonly muscovite. Errors estimated for this thermometer are ±10–15°C.
Whole-rock compositions and thermodynamic modelling
Bulk-rock composition thermodynamic modelling was employed to supplement the P-T constraints for the COR from mineral thermobarometry. Thermodynamic modelling efforts utilised the previously published bulk compositional dataset of an unaltered Quad Creek COR sample from Eckelmann and Poldervaart (Reference Eckelmann and Poldervaart1957) that was acquired via wet-chemistry methods. Thermodynamic modelling consisted of pseudosection diagrams that were calculated with the program Domino (de Capitani and Petrakakis, Reference de Capitani and Petrakakis2010) in the MnNCKFMASHTO system using the thermodynamic dataset 5.5 of Holland and Powell (Reference Holland and Powell1998) formatted for Theriak-Domino by Doug Tinkham. Activity-composition models used include chlorite (Mahar et al., Reference Mahar, Baker, Powell, Holland and Howell1997; Holland and Powell, Reference Holland and Powell1998), chloritoid, cordierite, epidote, staurolite, talc (Holland and Powell, Reference Holland and Powell1998), white mica (Coggon and Holland, Reference Coggon and Holland2002), orthopyroxene, magnetite (White et al., Reference White, Powell and Clarke2002), feldspar (Holland and Powell, Reference Holland and Powell2003), biotite, garnet, melt (White et al., Reference White, Powell and Holland2007) and orthoamphibole (Diener and Powell, Reference Diener and Powell2012). An ideal Mg–Fe–Mn ternary solution model was used for ilmenite. Aluminosilicate polymorphs, quartz, rutile and H2O were treated as pure end-member phases. Pseudosection calculations utilised the measured H2O value reported by Eckelmann and Poldervaart. Domino modelling did not include ferric iron. Modelling all iron as ferrous is reasonable because of the: (1) low ferric iron in the modelled COR bulk composition; and (2) low hematite component of measured ilmenite grains (see Supplementary material S8).
Results
Petrography and optical cathodoluminescence imagery
The typical mineral assemblage of the Quad Creek COR is orthopyroxene (25–30 vol.%), cordierite (25–30 vol.%), biotite (15–20 vol.%), quartz (10–15 vol.%), anthophyllite (5–10 vol.%), plagioclase (1–2 vol.%) and ilmenite and/or rutile (1–2 vol.%) (Table 1). Sillimanite, apatite, zircon and monazite are trace constituents present as matrix and inclusion grains which, together, comprise <1% of the total rock volume.
Observed mineral assemblages for each Quad Creek COR sample from EMPA in this study. Representative scans of COR thin sections and corresponding rock chips for an unaltered sample (QC 82-19) and an altered sample (QC 21-14) are found in Supplementary material S2

Notes: Abbreviations from Warr (Reference Warr2021), Pin = pinite, x = present and tr = trace mineral constituent.
Elongate orthopyroxene and anthophyllite grains define a lineation and biotite grains typically define a weak foliation. In most samples, both ilmenite and rutile are present in the matrix and as inclusions in cordierite, biotite and inosilicates. Rutile commonly exhibits partial to complete replacement by ilmenite. Local alteration products include talc after orthopyroxene and anthophyllite and pinite (chlorite) after cordierite. The degree of anthophyllite replacement of orthopyroxene, talcification of inosilicates and pinitisation of cordierite is variable across the outcrop.
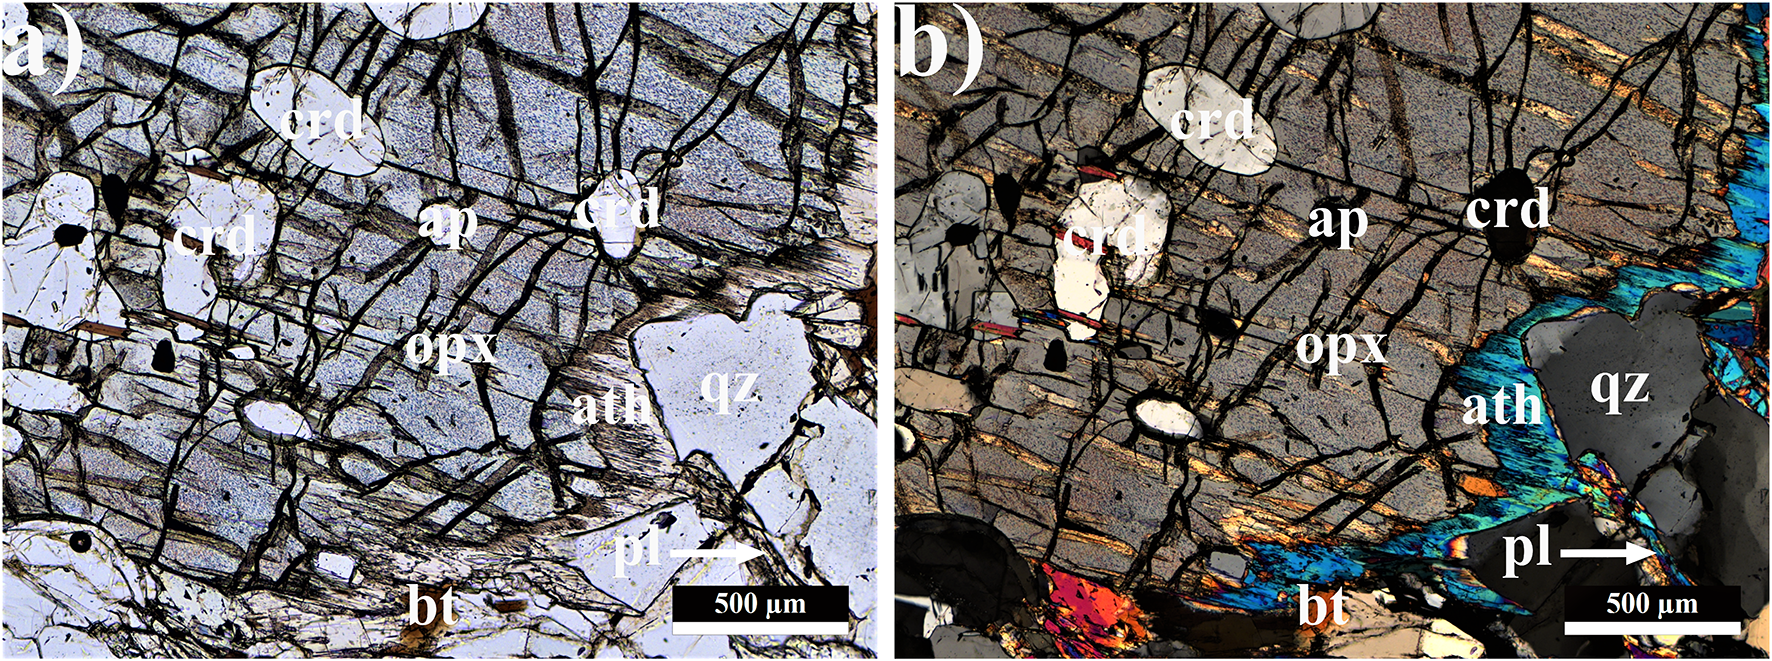
Orthopyroxene is commonly poikiloblastic with inclusions of cordierite, biotite, quartz, rutile (and/or ilmenite) and apatite. Inclusions of cordierite in orthopyroxene locally contain inclusions of biotite and rare sillimanite. The interiors of pyroxene grains display fine exsolution rods of rutile. Anthophyllite is generally restricted to the rims and along the fractures of orthopyroxene porphyroblasts (Fig. 3). Anthophyllite can exist independently of visible orthopyroxene grains, though this is not common. In addition to rounded inclusions in orthopyroxene porphyroblasts, cordierite is abundant throughout the matrix as rounded to blobby grains. Matrix cordierite grains are commonly poikiloblastic with inclusions that are generally concentrated within cordierite grain cores. Matrix cordierite inclusions consist of quartz, biotite and rutile (and/or ilmenite); however, sillimanite has not been found in matrix cordierite. Biotite can be present as inclusions or as matrix grains.
COR photomicrographs showing a typical orthopyroxene porphyroblast with anthophyllite developed along the rim: (a) plane-polarised light (PPL) photomicrograph; (b) cross-polarised light (XPL) photomicrograph. Abbreviations from Warr (Reference Warr2021).

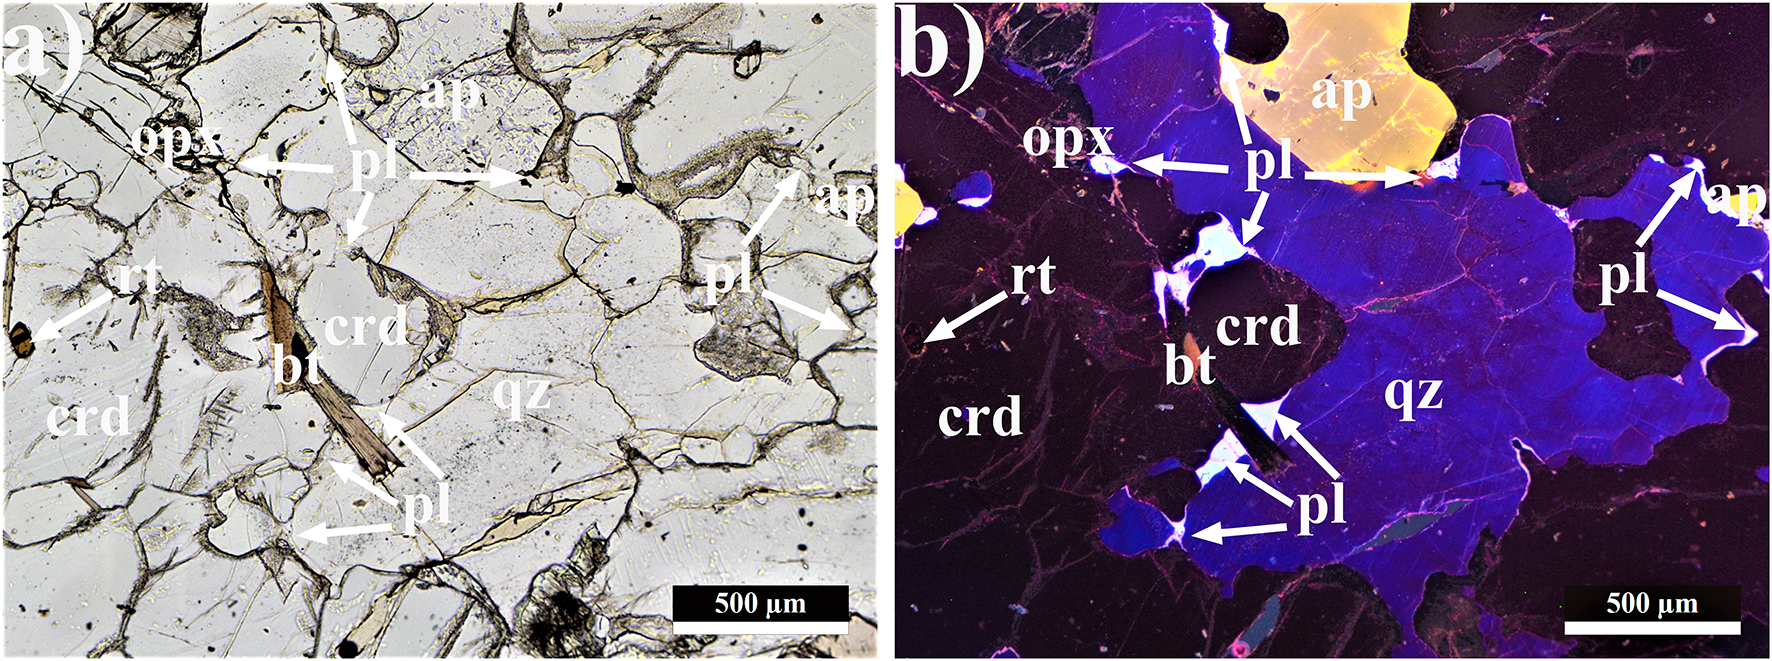
Plagioclase, optically similar to quartz and cordierite, is readily observable with optical cathodoluminescence imaging and is found in trace amounts throughout the matrix as small pockets along the grain boundaries of surrounding phases, excluding anthophyllite (Fig. 4). Together with apatite, plagioclase is the primary Ca-bearing phase in the Quad Creek COR.
COR photomicrographs showing the relationship between plagioclase and surrounding matrix mineral phases: (a) PPL photomicrograph in which the plagioclase is difficult to distinguish; (b) optical cathodoluminescence photomicrograph in which plagioclase appears as white grains along the margins of apatite (light yellow), biotite (black), cordierite (dark red) and quartz (patchy dark blue/purple). Abbreviations from Warr (Reference Warr2021).

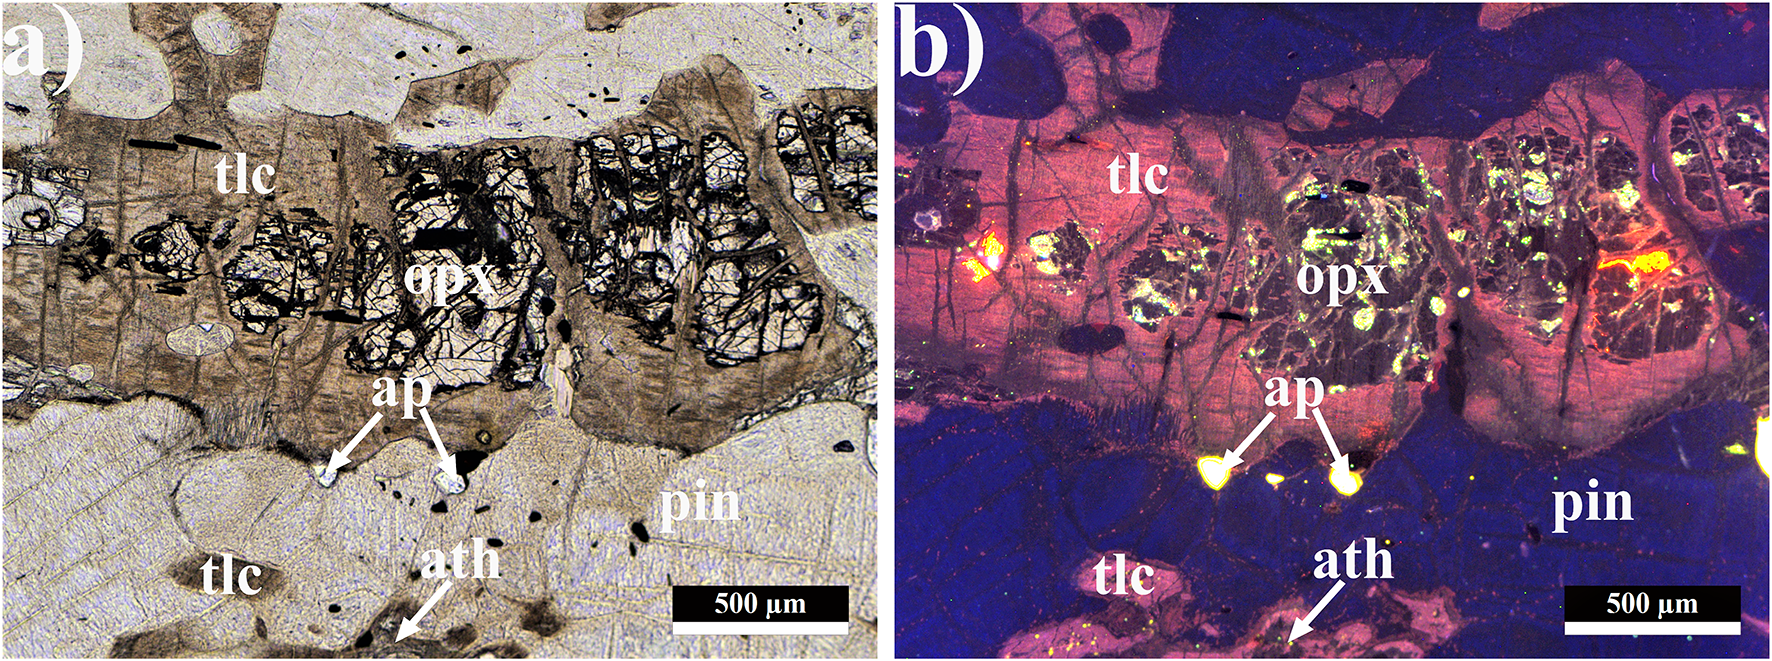
In extensively altered samples, extant pyroxene and anthophyllite grains are surrounded by masses of talc and cordierite grains are completely pinitised. These alteration phases are best observed in optical cathodoluminescence imagery (Fig. 5).
Photomicrographs of an extensively altered COR sample in which inosilicates are rimmed by talc and cordierite is completely replaced by pinite: (a) PPL photomicrograph; (b) optical cathodoluminescence photomicrograph.

Mineral composition and thermobarometry
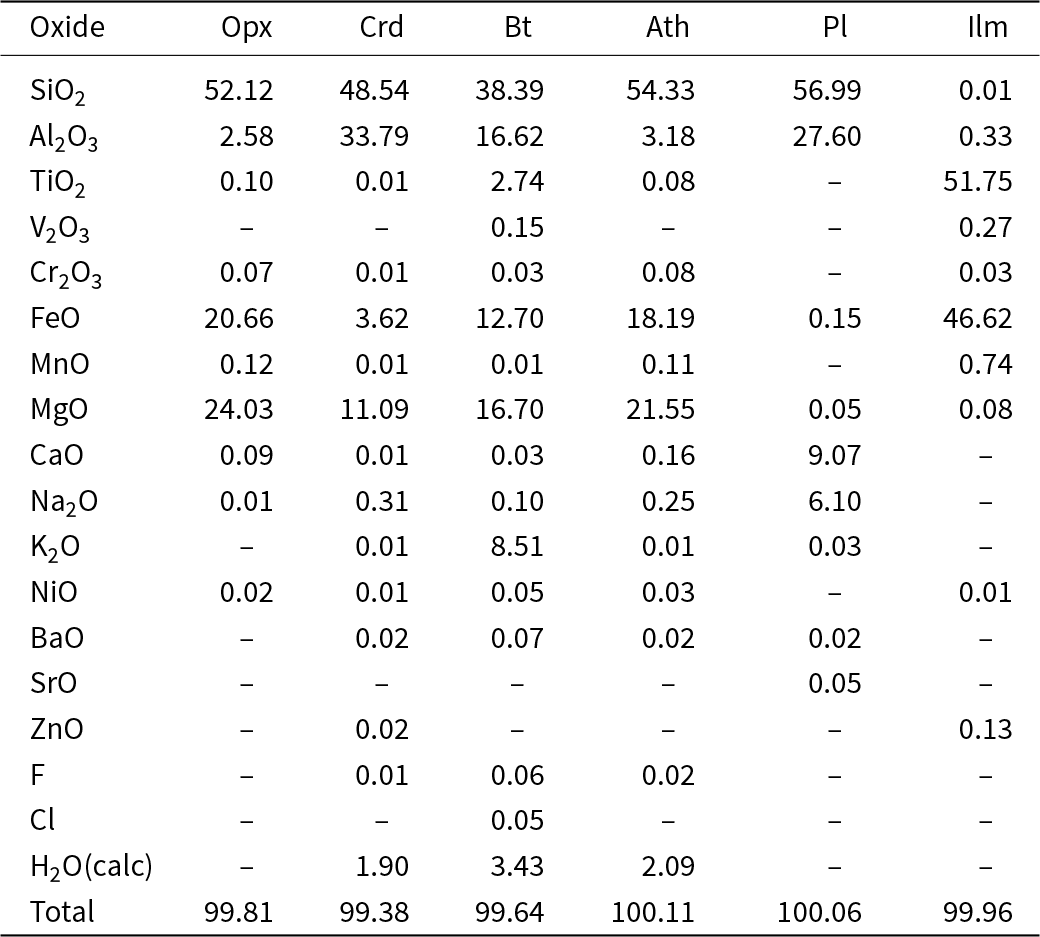
The average composition of each mineral determined by EMPA is shown in Table 2 (data for the individual COR samples analysed are given in Supplementary material S3–S8). Among the minerals analysed for major and minor elements, most do not display systematic element zoning. However, biotite locally exhibits a reduction of Ti near the grain margins, particularly where ilmenite is present. Slight differences in bulk composition across the COR outcrop are reflected by variations in the compositions of the mineral constituents in each sample. For example, the Mg# (where Mg# is equal to the atoms per formula unit ratio of Mg/(Mg+Fe)) of measured ferromagnesian minerals increases slightly (i.e. on the order of ∼0.10–0.15) by sample in the general order: QC 8218 (lowest Mg# among ferromagnesian minerals); QC 81-130; 10QCP 728-04; 987-206; QC 82-19; QC 21-14 (highest Mg# among ferromagnesian minerals).
Average Quad Creek COR mineral compositions for each mineral targeted for major- and minor-element constituents

Notes: ‘–’ below detection limit; abbreviations from Warr (Reference Warr2021)
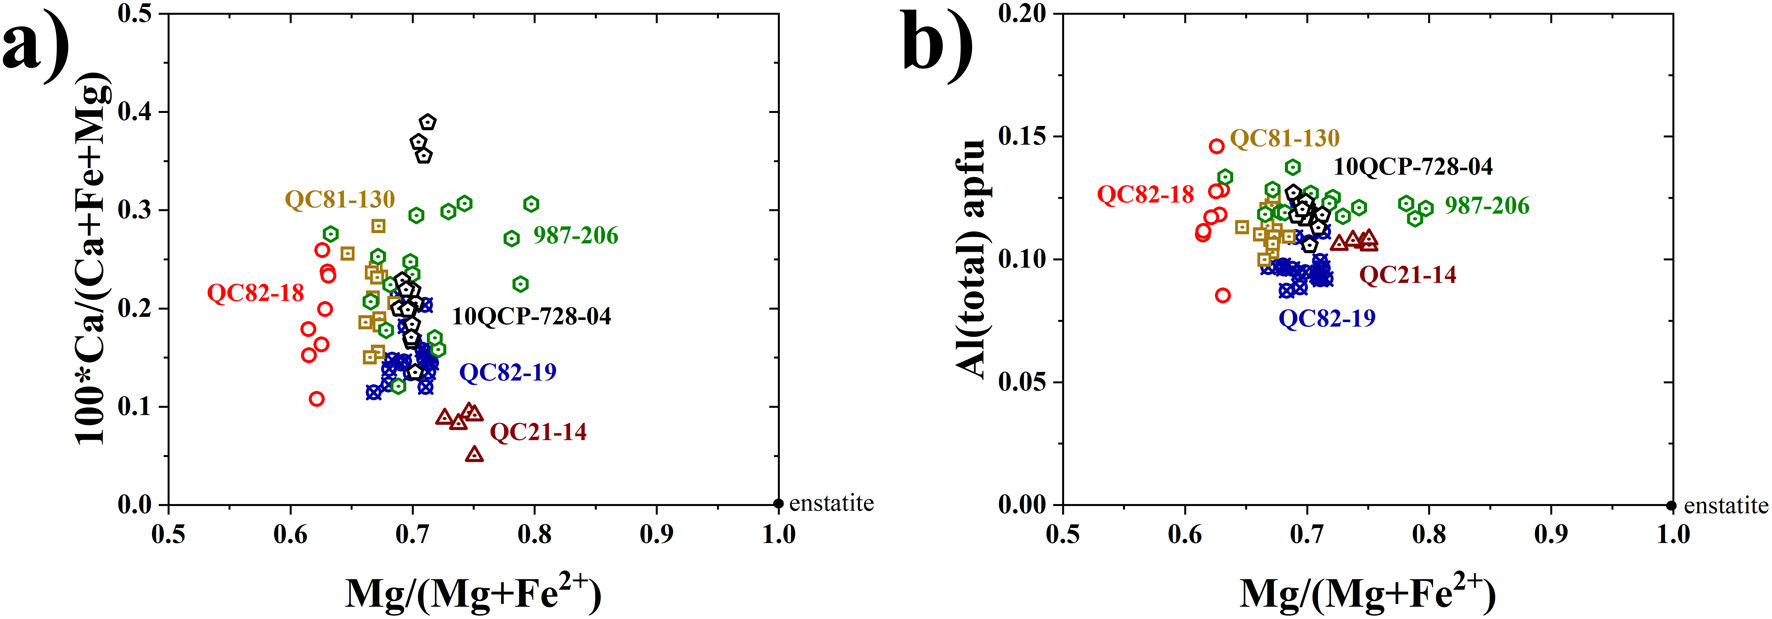
The average orthopyroxene composition is enstatite (68.79), ferrosilite (31.01) and wollastonite (0.20) (Fig. 6). The wollastonite component is consistently low among orthopyroxene grains (i.e. <1%) whereas the Mg# varies slightly from ∼0.60 to ∼0.80.
Orthopyroxene mineral chemistry: (a) Mg# (i.e. (Mg/Mg+Fe2+)) vs Ca content; (b) Mg# vs Al content.

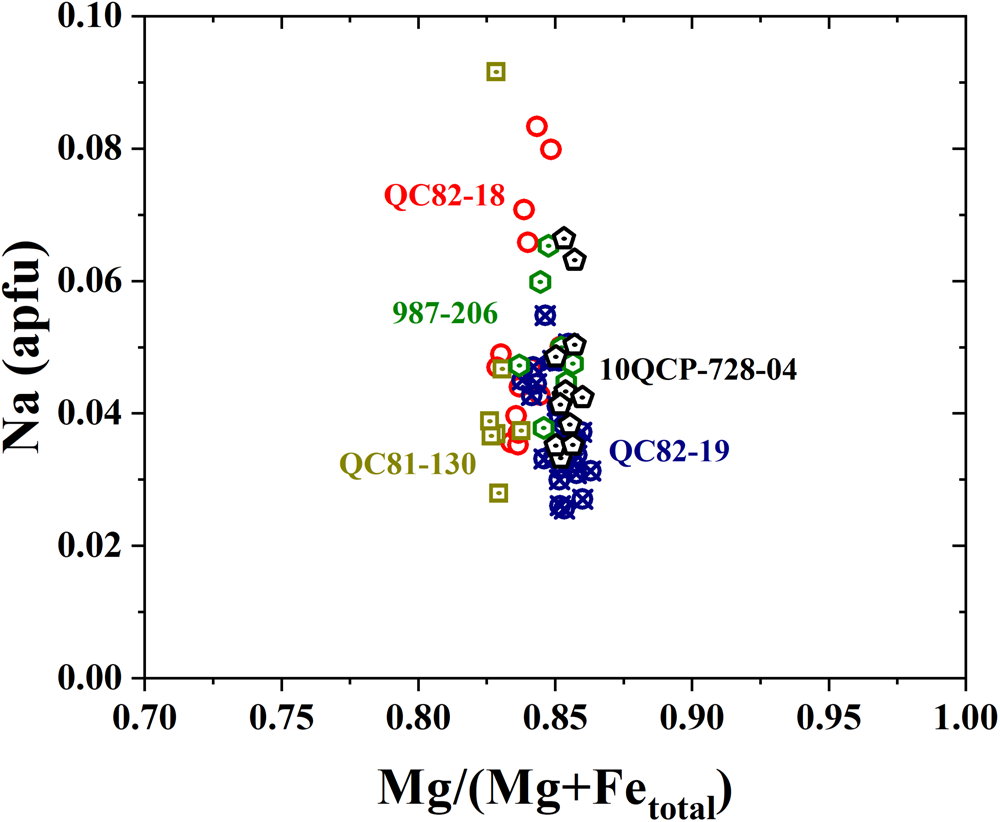
Cordierite is magnesian with a clustering of data about the average Mg# of 0.85 (Fig. 7). Measured cordierite Na contents range from 0.03–0.09 atoms per formula unit (apfu) which correspond to Na-in-crd thermometry temperatures of ∼640–770°C.
Mg# of cordierite relative to Na content used to calculate Na-in-cordierite geothermometry temperatures.

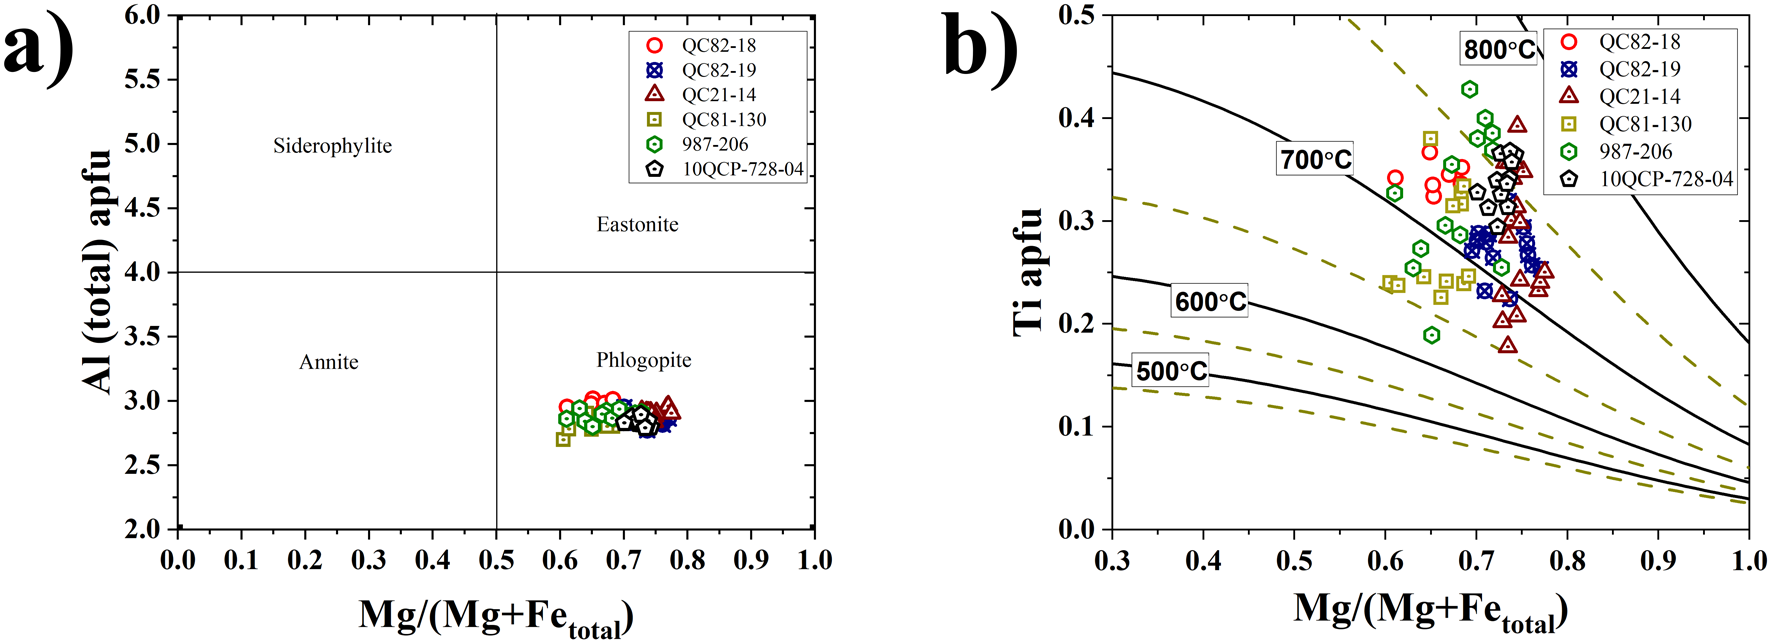
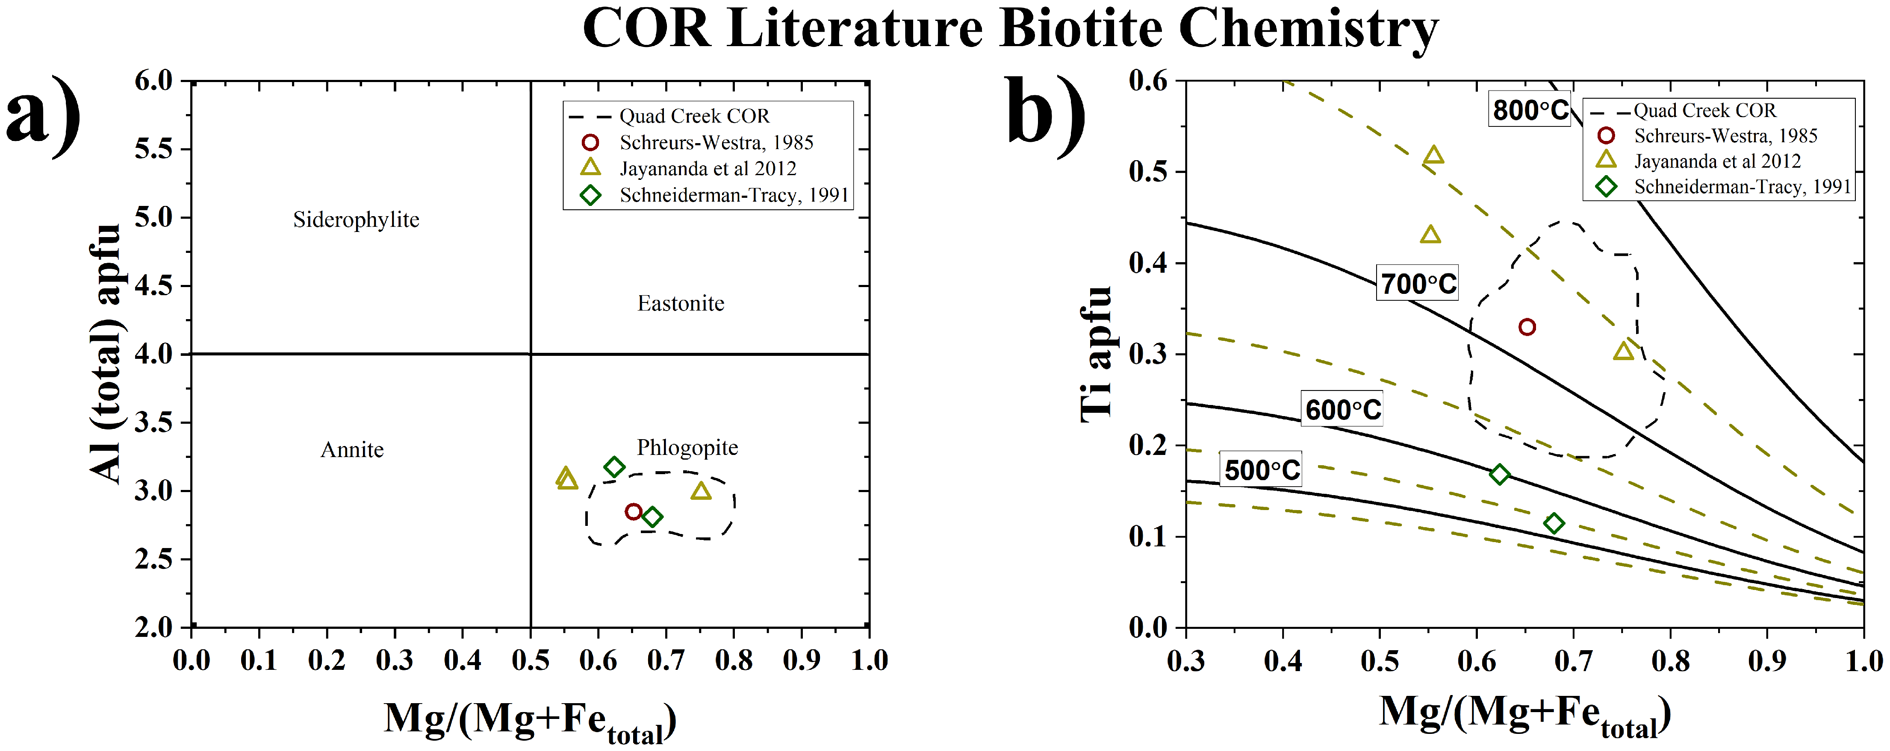
Biotite is phlogopite with relatively minor variability in total Al content (i.e. ∼2.70–3.00 apfu Al) and variable Mg# (i.e. ∼0.60–0.80 Mg#) (Fig. 8). The observed range in Ti content (i.e. ∼0.20–0.45 apfu) and the corresponding Mg#s yield COR TiB thermometry temperatures from ∼650°C to 775°C (Fig. 8b). The relatively significant variation of the biotite Ti within a given sample is consistent with the partial resetting patterns of TiB found by Henry et al. (Reference Henry, Guidotti and Thomson2005).
Biotite composition (a) Mg# vs Al content with biotite end-member fields shown; (b) Mg# vs Ti content shown relative to Henry et al. (Reference Henry, Guidotti and Thomson2005) TiB thermometry isotherms (alternating tan dashed lines and black solid lines) to indicate the resultant calculated TiB temperature for each biotite measurement shown.

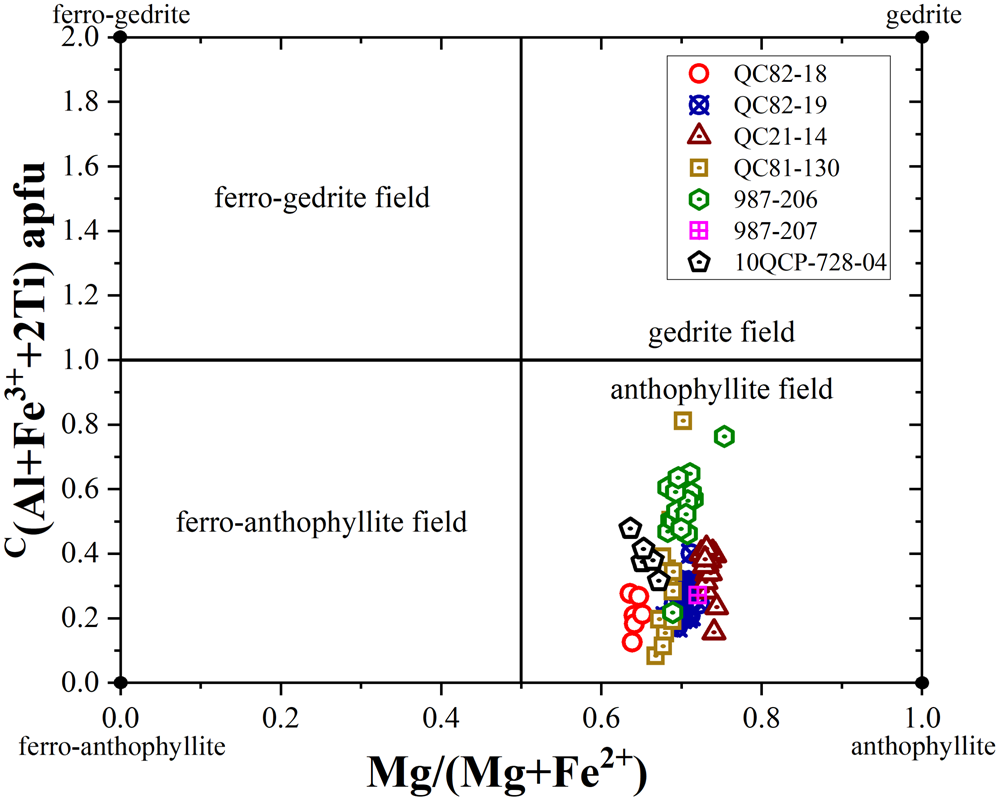
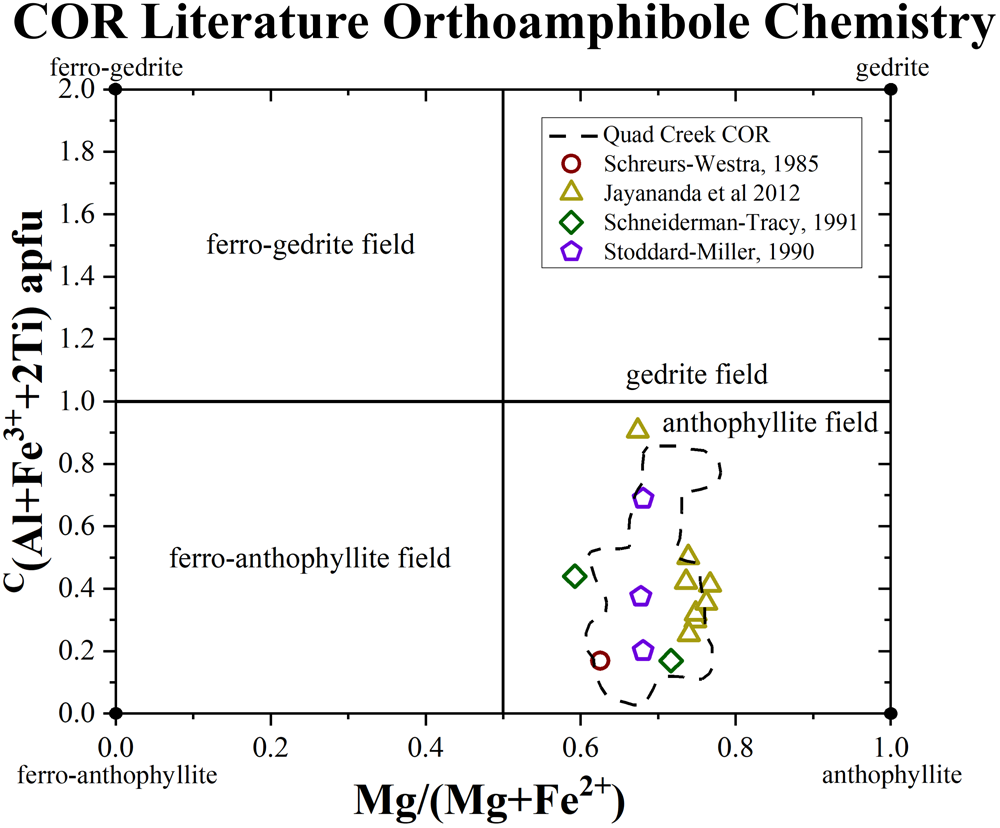
Orthoamphibole grains analysed are exclusively anthophyllite with a clustering of data points in the Mg# range of ∼0.60–0.75 (Fig. 9).
Orthoamphibole compositions plotted relative to the classification scheme of Hawthorne et al. (Reference Hawthorne, Oberti, Harlow, Maresch, Martin, Schumacher and Welch2012) that is based on Al+Fe3++Ti in the c crystallographic site and the Mg#.

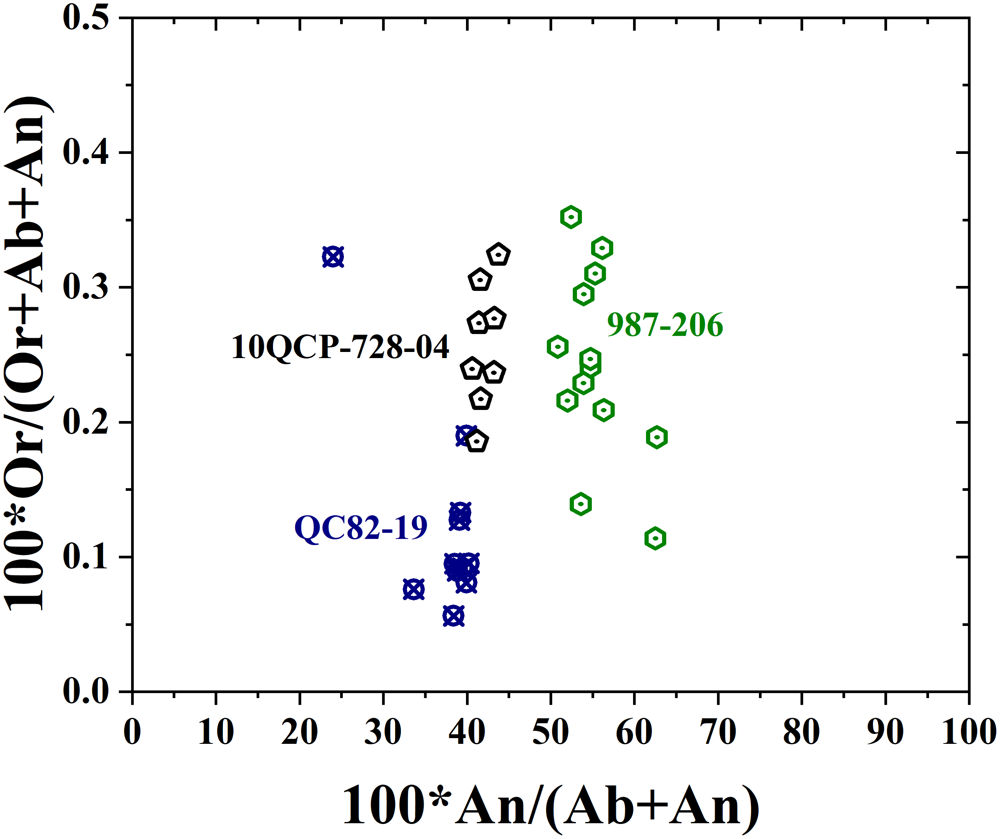
In the samples in which plagioclase compositions were measured, grains display an average composition of Ab62.50An37.37Or0.12 (sample QC 82-19), Ab45.17An54.58Or0.25 (sample 987-206) and Ab57.79An41.95Or0.26 (sample 10QCP 728-04) (Fig. 10). COR plagioclase grains are not compositionally zoned. Ilmenite grains have an average formula of (Ti0.98Fe2+0.96Fe3+0.02Mn0.02Al0.01V0.01)O3. The proportion of calculated ferric iron to total iron is small and ranges from ∼0.64 to 3.75% (see Supplementary material S8), consistent with minor amounts of ferric iron in the COR.
Plagioclase compositions expressed in terms of the feldspar ternary end-members: orthoclase (Or), albite (Ab) and anorthite (An).

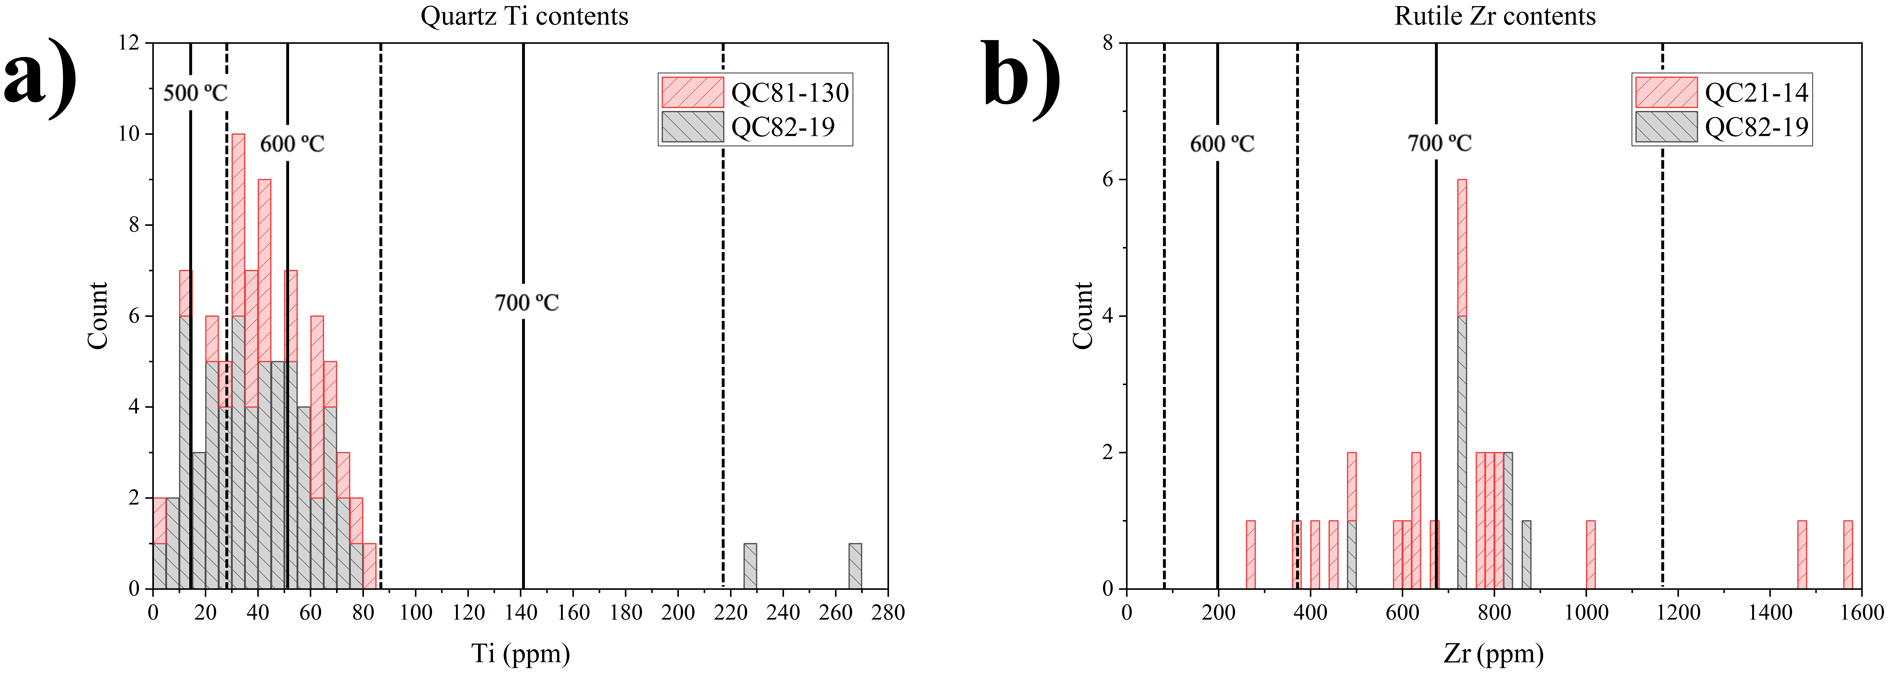
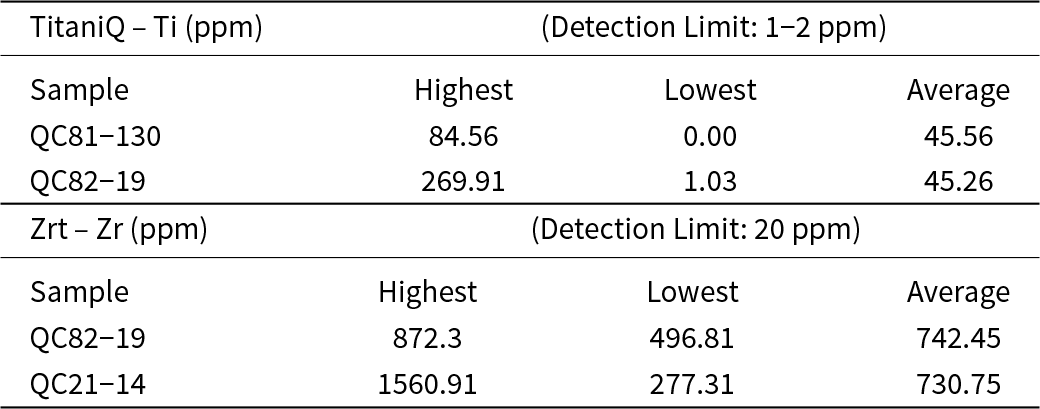
The largest and smallest Ti-in-quartz and Zr-in-rutile contents varied considerably among samples (Table 3). Assuming an equilibration pressure of 0.60 GPa, the majority of calculated TitaniQ and Zrt thermometry temperatures are within the respective ranges of ∼500–650°C and ∼650–750°C (Fig. 11).
Trace-element mineral compositions histograms: (a) Ti-in-quartz; (b) Zr-in-rutile. Overlain on each histogram are isotherms (alternating dashed and solid black lines) for the trace-element thermometer calibration used (i.e. Thomas et al., Reference Thomas, Watson, Spear, Shemella, Nayak and Lanzirotti2010, TitaniQ calibration and Tomkins et al., Reference Tomkins, Powell and Ellis2007, Zrt calibration) at an assumed equilibration pressure of 0.60 GPa.

Average, smallest and largest Ti-in-quartz (TitaniQ) and Zr-in-rutile (Zrt) trace-element contents for the samples analysed

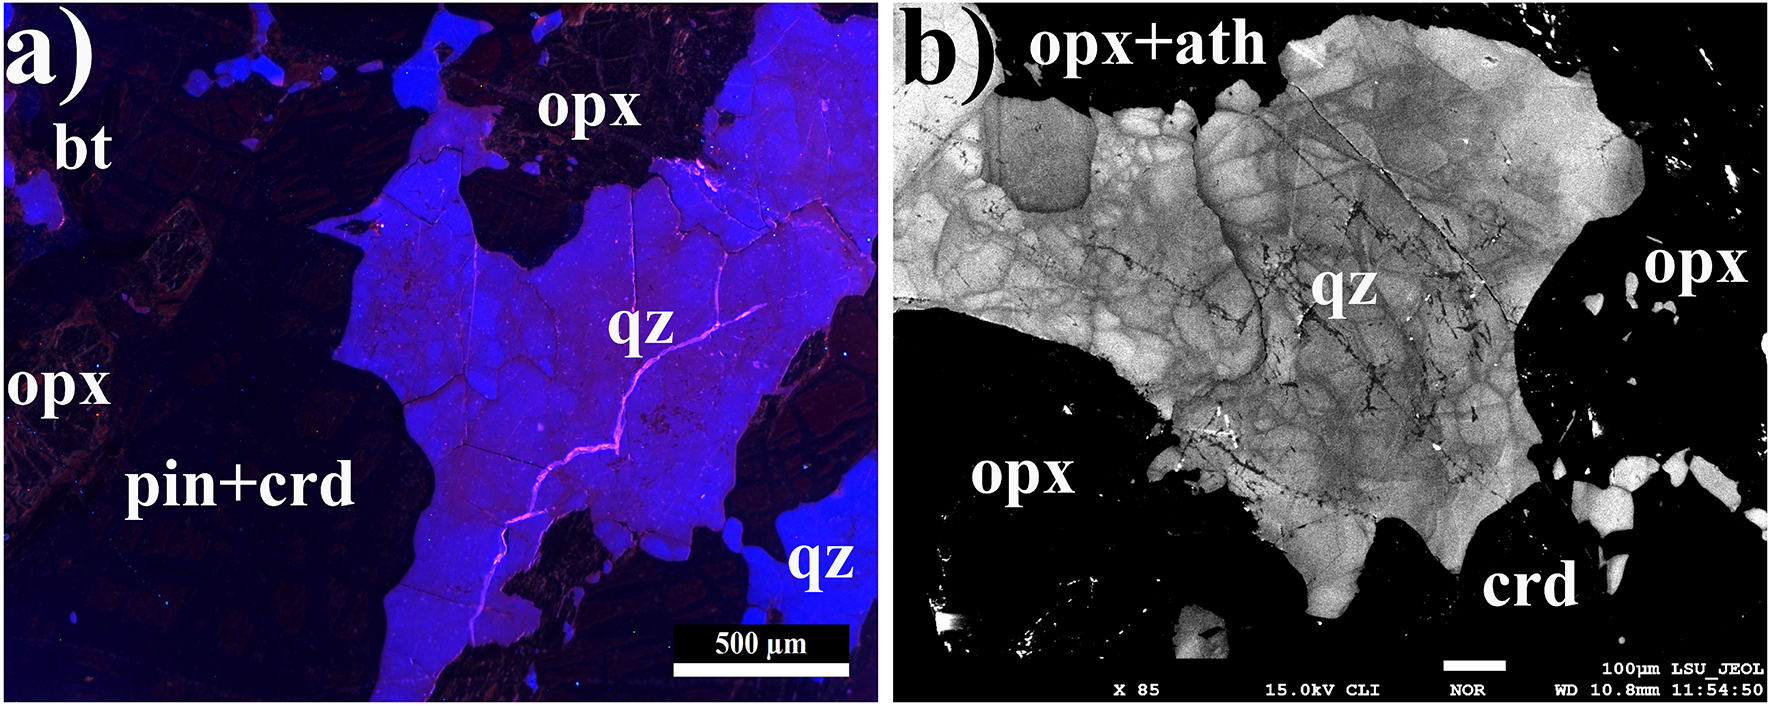
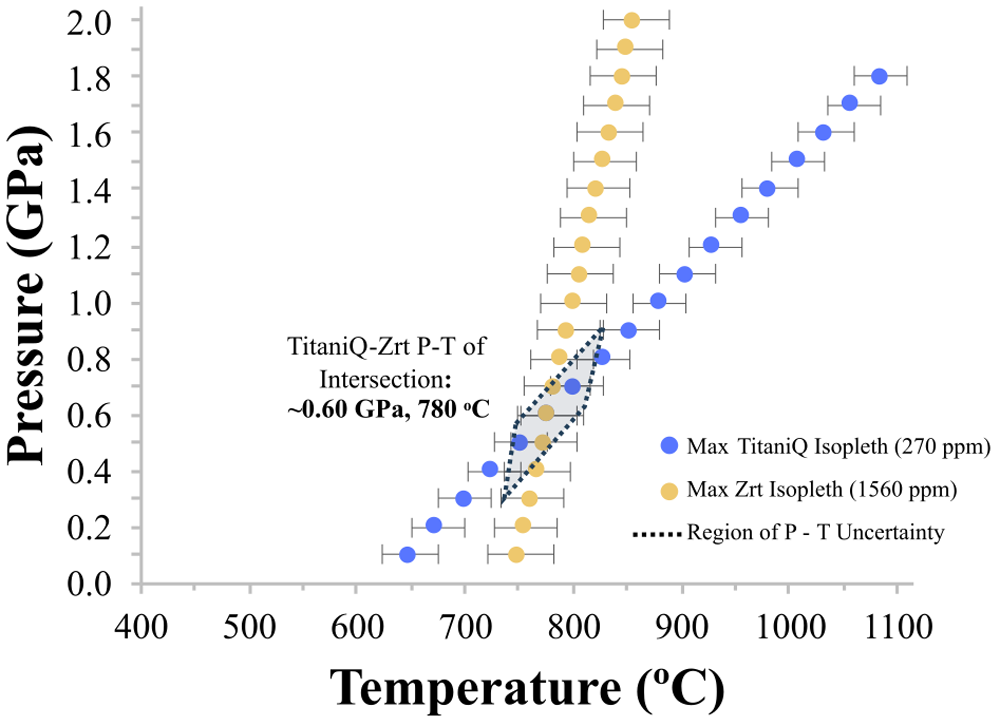
Matrix and inclusion grains of quartz Ti contents are heterogeneous. Texturally, this heterogeneity can be visualised by the patchy CL response given that grain brightness (blue intensity in optical cathodoluminescence (OM-CL) and lighter grey in scanning electron cathodoluminescence (SEM-CL) is proportional to Ti content (Fig. 12). Although some quartz grains display brighter rims and darker cores, the most common feature is intensity variations along subgrain boundaries and fractures. It is probable that these patchy intensity variations are due to variable resetting of Ti content among measured matrix quartz grains. In contrast to quartz, measured rutile grains do not preserve consistent trace-element zoning patterns, patchy or otherwise, with respect to Zr. Selected rutile grains were noted to have inclusions or rims of zircon in BSE imagery; these rutile grains were deliberately avoided for trace-element measurements of Zr. Similarly, deliberate placing of analytical points for Ti-in-quartz measurements with the help of BSE imagery do not indicate the presence of high-Ti, non-quartz grains in sampled volumes. With textural indications that quartz and rutile measurements do not reflect Ti or Zr input from surrounding phases, the maximum TitaniQ and Zrt thermometry isopleths among measured COR samples are plotted in Fig. 13, yielding a P-T region of intersection of ∼0.60 GPa and 780°C, ± ∼0.20 GPa and ∼50°C. Plotting of the highest Ti-in-quartz and Zr-in-rutile measurements in this manner, as opposed to the remaining data (shown in Fig. 11), is done in order to define more accurately peak metamorphic P-T conditions, instead of later P-T resetting conditions, for later P-T reconstructions.
Representative photomicrographs of various samples showing patchy subgrains typified by COR matrix quartz: (a) optical cathodoluminescence photomicrograph (OM-CL); (b) scanning electron cathodoluminescence (SEM-CL) photomicrograph. Red-pink grain patches in OM-CL imagery and dark grey patches in SEM-CL imagery correspond to lower Ti contents and thus lower calculated TitaniQ temperatures relative to blue OM-CL grain patches and light grey SEM-CL grain patches.

Trace-element isopleth thermobarometry results showing the maximum isopleths (and associated error bars) for the TitaniQ (blue) and Zrt (orange) thermometers that intersect in P-T space at ∼0.60 GPa and 780ºC. The P-T region of combined TitaniQ-Zrt uncertainty is also shown around the area of isopleth intersection.

Whole-rock compositions and thermodynamic modelling
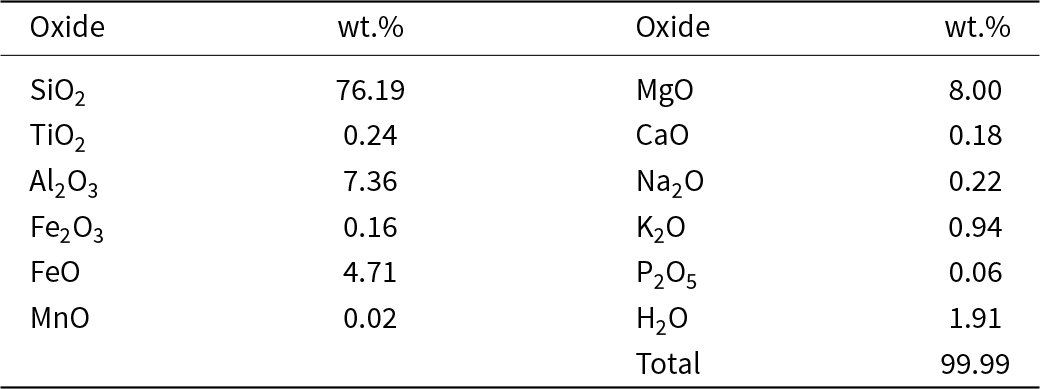
Whole-rock compositional data, acquired by wet chemistry methods, for the Quad Creek COR are from Eckelmann and Poldervaart (Reference Eckelmann and Poldervaart1957) (their sample ‘14/55’ referred to here as ‘EP-1957’) (Table 4). The observed mineral assemblage for sample EP-1957 was described by Eckelmann and Poldervaart to contain ilm-ath-opx-bt-crd-qz (their observation of magnetite is probably ilmenite). This investigation utilises updated petrographic observations from minimally altered COR samples (collected for this study) in addition to the original petrography work of Eckelmann and Poldervaart to interpret the calculated EP-1957 pseudosection (Fig. 14). These updates include trace-mineral constituents rutile, plagioclase and sillimanite as well as alteration phases talc and pinite (predominantly comprised of chlorite).
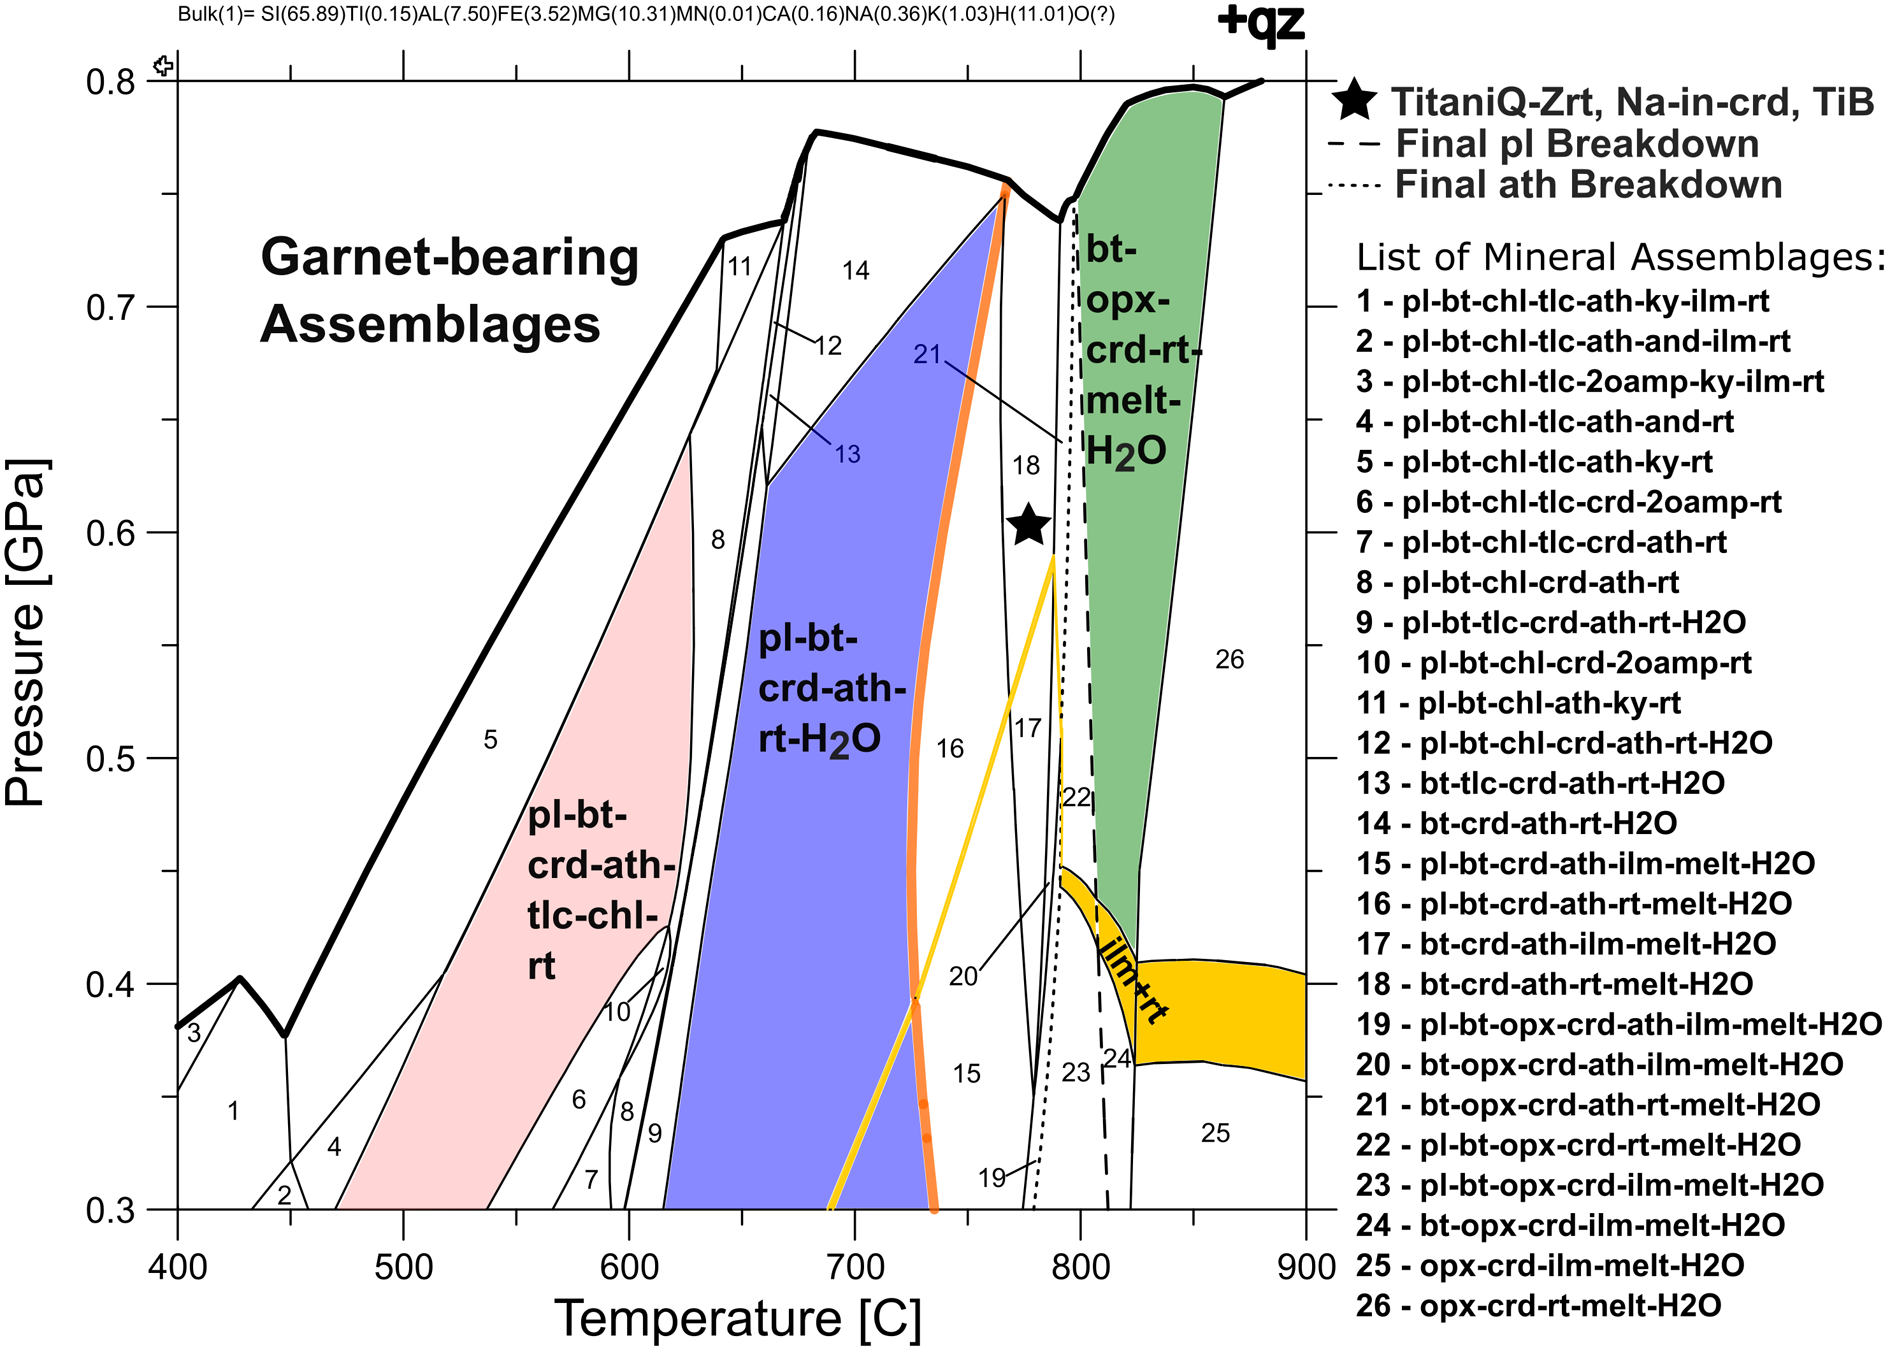
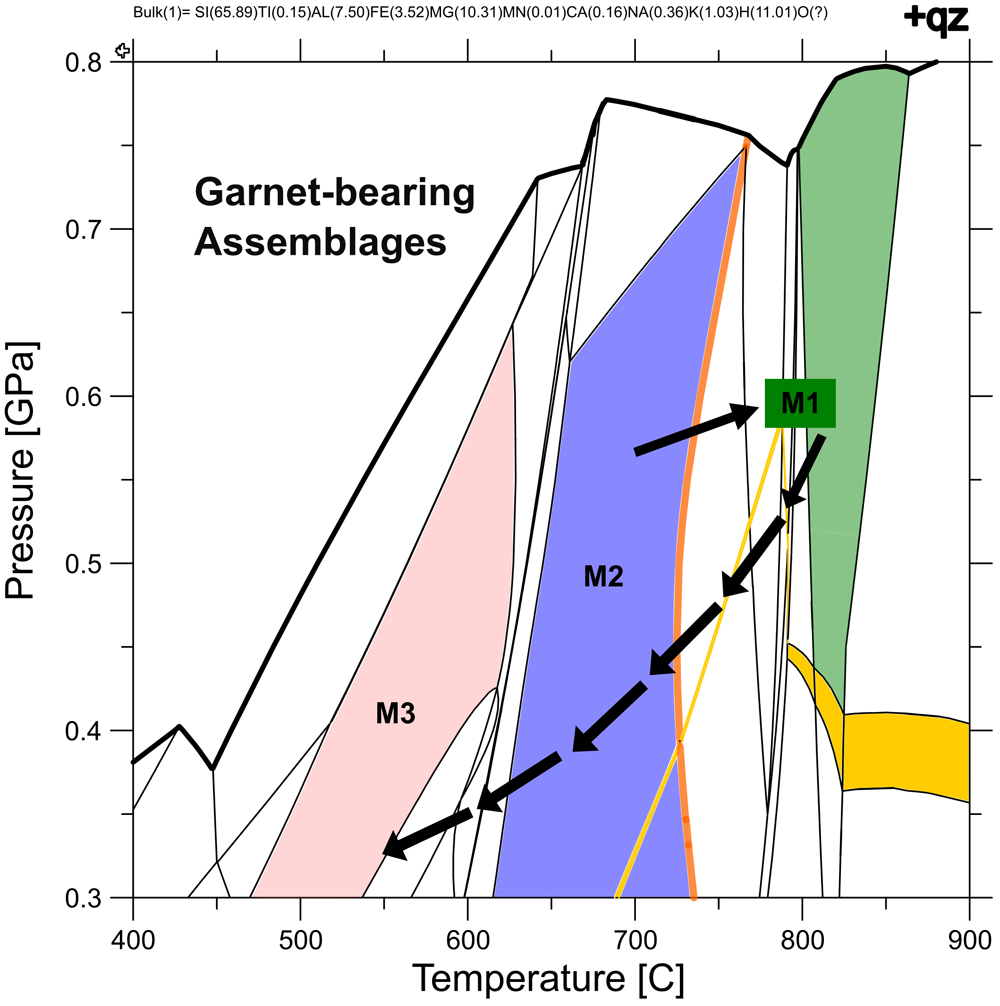
MnNCKFMASHTO pseudosection diagram for the EP-1957 bulk composition. Consistent with the published bulk composition of Eckelmann and Poldervaart (Reference Eckelmann and Poldervaart1957) pseudosection calculations utilised ∼6.50 moles of water and assumed all iron to be ferrous. The calculated pseudosection diagram is saturated with respect to quartz. Modelled mineral assemblage stability fields are numbered (assemblages corresponding to those numbers are given in the list of mineral assemblages to the right of the diagram) and mineral assemblages noted in petrography and discussed in the text are coloured. Additionally, the solidus is coloured in orange and the region of ilmenite–rutile co-stability is marked in gold. Mineral thermobarometry results are starred and the final breakdown reactions of both anthophyllite (dotted line) and plagioclase (dashed line) are highlighted. Garnet-bearing assemblages that are predicted at pressures above the bolded black line have been removed from the diagram. Mineral abbreviations are from Warr (Reference Warr2021).

Published Quad Creek COR whole-rock composition constraints (in wt.% oxide) for sample ‘14/55’ from Eckelmann and Poldervaart (Reference Eckelmann and Poldervaart1957)

Mineral thermobarometry results are starred on the EP-1957 pseudosection, specifically P-T constraints from: (1) the intersection between the highest measured TitaniQ and Zrt thermometry isopleths (i.e. ∼0.60 GPa and 780°C); (2) minimum Na values in cordierite (i.e. ∼770°C, ±10–15°C); and (3) maximum Ti values in biotite (i.e. ∼770°C, ±12°C). As with use of the highest trace-element isopleths, the maximum T values from TiB and Na-in-crd thermometry are utilised to identify the maximum/highest metamorphic temperatures recorded by constituent minerals in the COR. The independent temperature constraints from the Na-in-crd and TiB thermometers coupled with the TitaniQ-Zrt isopleth intersection method results in an error of ±0.12 GPa and 20°C for the starred point in P-T space on the pseudosection diagram. Garnet is not present in the Quad Creek COR nor is there evidence for its prior existence therefore hypothetical garnet-bearing assemblages are not shown. Given the apparent variability in the dominant oxide from sample to sample, the portion of the diagram with coexisting ilmenite and rutile is noted as a thin strip (in gold) generally below ∼0.60 GPa and above ∼650°C; rutile-only assemblages are predicted above this strip of P-T space and ilmenite-only assemblages are predicted below.
In the pseudosection for the EP-1957 bulk composition, the orthopyroxene-dominant mineral assemblage (i.e. bt-opx-crd-qz-rt-melt, highlighted in green) and the anthophyllite-dominant mineral assemblage (i.e. pl-bt-crd-ant-qz-rt, highlighted in blue) are found to be stable over a range of pressures above the predicted solidus (i.e. ∼800–850°C) and below the predicted solidus (i.e. ∼615–725°C), respectively. Conditions indicated by mineral thermobarometry results (i.e. ∼0.60 GPa and 770–780°C) fall above the solidus at temperatures between the highlighted orthopyroxene-only and anthophyllite-only mineral assemblages. It is further noted that mineral thermobarometry P-T results fall within the field of rutile stability yet near the modelled region of P-T space in which ilmenite and rutile are predicted to coexist. The region of P-T space in which the observed phases talc and pinite (i.e. chlorite) are found to coexist is predicted to occur at P-T below ∼0.65 GPa and 600°C (highlighted in pink).
Discussion
Metamorphic mineral assemblages and conditions of metamorphism
The Quad Creek COR preserves mineral textural information that is key for reconstructing its metamorphic history. Three discrete mineral assemblages are noted from petrography and mineral imaging. The first mineral assemblage consists of rt-bt-opx-crd-qz-melt (±sil). The presence of a prior melt phase is supported by both minor plagioclase pockets noted in optical cathodoluminescence images that are associated with select matrix phases (excluding anthophyllite) as an apparent wetting phase and pseudosection predictions of plagioclase breakdown alongside melt production near peak temperatures (e.g. Figs 4, 14). The second mineral assemblage, rt/ilm-pl-bt-crd-ant-qz, is more hydrous than the initial mineral assemblage with the addition of anthophyllite (partially) replacing orthopyroxene. The occurrence of anthophyllite replacing orthopyroxene along grain boundaries and fractures indicates that these two inosilicate phases are not in textural equilibrium (e.g. Fig. 3). Given the compositional similarity of orthopyroxene and anthophyllite (excluding the hydroxyl component), it is interpreted that anthophyllite stabilisation probably occurred at the expense of orthopyroxene by introduction of hydrous fluids. Although oxide mineral stability relationships between rutile and ilmenite in the Quad Creek COR are difficult to discern texturally, the predominance of ilmenite as inclusions in anthophyllite (and insights from pseudosection diagrams discussed below) suggests that ilmenite is primarily associated with the second mineral assemblage. The third mineral assemblage is the most hydrous, consisting of rt/ilm-tlc-chl-bt-crd-ath-pl-qz. The envelopment of inosilicate phases by talc and (partial-to-complete) replacement of cordierite by pinite/chlorite represents a second (and final) stage of hydration affecting the COR to varying degrees (e.g. Fig. 5). These three generations of mineral assemblages noted are interpreted to represent three successively lower grade, increasingly more hydrous metamorphic events: M1, M2 and M3.
Key mineral assemblages and textural features constrain the P-T conditions of each COR metamorphic event further. The absence of garnet, a potential COR phase, limits the upper pressure conditions for all three metamorphic events to be below the modelled garnet-in reaction throughout metamorphism i.e. < 0.70–0.80 GPa, for temperatures above 600°C, and <0.40–0.70 GPa, for temperatures below 600°C; indicated by the bold black line on the pseudosection diagram in Fig. 14. The geological conditions of prograde and peak metamorphism must have been within the sillimanite stability field as indicated by the presence of sillimanite in cordierite inclusions in orthopyroxene (an M1 phase). Peak metamorphism (M1) occurred at temperatures higher than the onset of melting given by the presence of plagioclase as a wetting phase/melt in the matrix. As noted, anthophyllite is not texturally associated with plagioclase/melt, suggesting that M2 temperatures were below the solidus. Conditions of the second metamorphic event (M2) (and thus the conditions of the preceding metamorphic event, M1) occurred at temperatures above the gedrite–anthophyllite orthoamphibole solvus (∼600°C; Spear, Reference Spear1980). This minimum temperature interpretation for the M1 and M2 metamorphic events is supported by the lack of co-existing gedrite and anthophyllite in thin section, a co-occurrence that is predicted to occur below 600°C in select mineral assemblages on the pseudosection diagram.
Mineral composition results coupled with pseudosection diagrams serve to place more specific quantitative constraints on the P-T conditions of COR metamorphism. Maximum P-T conditions from TitaniQ-Zrt thermobarometry as well as Na-in-Crd and TiB thermometry defines a granulite-facies P-T window of 770–780°C at ∼0.60 GPa (lower P-T values calculated using employed mineral thermobarometers probably reflect variable retrograde resetting). Pseudosection interpretations place the M1 event, represented by the assemblage rt-bt-opx-crd-qz-melt, at slightly higher temperatures (i.e. at least 800°C and up to 850°C). Given this relatively tight P-T window defined by mineral compositions and whole-rock chemistry modelling efforts, M1 granulite-facies conditions are reasonably inferred to be ∼0.60 GPa and 775–815°C. These conditions are consistent with dehydration of any prograde anthophyllite to orthopyroxene and the complete breakdown of the small amounts of modal plagioclase to produce melt that partially enveloped select matrix grains as a wetting phase. Regarding oxide mineral relationships at peak (M1) conditions, it is probable that rutile was the stable oxide phase as the M1 assemblage with both ilmenite and rutile is predicted to occur at pressures below 0.45 GPa (i.e. gold field immediately below the M1 assemblage highlighted in green on the pseudosection diagram), pressures that are not representative of M1 metamorphism in the study area. Importantly, the modelled field of ilmenite–rutile co-stability peaks at ∼0.60 GPa and 785°C, the same region of P-T space indicated by mineral thermobarometers and the modelled M1 assemblage. The observation of ilmenite and/or rutile as inclusions in orthopyroxene (i.e. ilmenite inclusions in the modelled EP-1957 COR sample and ilmenite and/or rutile inclusions in COR samples described in this study), an M1 phase that is only predicted to be stable above ∼785°C, suggests that the prograde metamorphic path probably traversed this narrow region of ilmenite–rutile co-stability during heating to peak conditions.
Geological conditions of the sub-solidus M2 and M3 metamorphic events are not as well defined as peak (M1) conditions. P-T of the modelled M2 assemblage (rt/ilm-pl-bt-crd-ant-qz) for sample EP–1957 are ∼615–750°C at pressures below ∼0.75 GPa. Though firm pressure constraints on the M2 event are elusive, it is probable that M2 metamorphism occurred at pressures below M1 pressures. This is based on the modelled ilmenite–rutile co-stability field shifting to lower pressures as temperature decreases. Given that ilmenite and rutile appear to be in textural equilibrium in the matrix and both exist as inclusions in anthophyllite (an M2 phase), it is probable that the COR retrograde P-T path followed and may have crossed, the modelled ilmenite–rutile co-stability field during decompression. Within the modelled M2 stability field, the P-T of ilmenite–rutile co-stability occurs at conditions below ∼0.40 GPa from 615–725°C. Compared to peak (M1) metamorphism, the mineral thermobarometers employed cannot be used readily to further narrow in on P-T conditions of M2 metamorphism. Specifically with respect to TitaniQ thermometry, calculated temperatures below granulite-facies conditions probably reflect multiple stages of matrix quartz recrystallisation during retrograde cooling and decompression. Evidence of post-peak quartz recrystallisation is apparent from the patchy CL response and sub-grain boundaries within matrix quartz observed in CL imagery where Ti values have been inconsistently reset at various retrograde temperatures, many below 600°C (e.g. Figs 11, 12). This retrograde recrystallisation of quartz and variable resetting of preserved Ti contents is similar to that observed in garnet-bearing migmatites in the study area (e.g. Tuttle and Henry, Reference Tuttle and Henry2023). Thus, without firm M2 thermobarometric constraints, amphibolite-facies overprinting is broadly constrained to have occurred below 0.40 GPa from 615–725°C. Firm P-T constraints on the M3 event are even more difficult to secure. However, modelled stability fields on the pseudosection diagram indicate that talc and pinite (chlorite) are stabilised at temperatures below ∼500–600°C. Therefore, assuming that M3 metamorphism occurred at lower pressures, P-T constraints for this final metamorphic event are below 0.40 GPa and 500–600°C.
Interpretive P-T path and Beartooth tectonic implications
The Quad Creek COR has preserved evidence of a multi-stage P-T history consisting of three metamorphic events: M1, M2 and M3. Preserved mineral textures and pseudosection models demonstrate that the M2 and M3 metamorphic overprints occurred at successively lower P-T conditions relative to M1 conditions. This reconstructed metamorphic history implies an overall clockwise metamorphic P-T path consisting of a peak granulite-facies assemblage (M1) that was subsequently overprinted/hydrated by an amphibolite-facies event (M2) followed by a later greenschist-facies event (M3) (Fig. 15). Interpreted P-T conditions for each episode of the COR metamorphism are generally consistent with the three main local metamorphic events M1, M2 and M3 established in multiple neighbouring xenolithic lithologies throughout the eastern Beartooth Mountains (Henry et al., Reference Henry, Mueller, Wooden, Warner and Lee-Berman1982; Will, Reference Will2013; Henry et al., Reference Henry, Will and Mueller2015). Similarly, the clockwise metamorphic P-T path inferred for the Quad Creek COR is consistent with modelled P-T paths for adjacent xenoliths of garnet-bearing migmatites and ironstones (Guevara et al., Reference Guevara, Caddick and Dragovic2017; Tuttle and Henry, Reference Tuttle and Henry2023).
Interpreted clockwise P-T path (black arrows) for the Quad Creek COR based on P-T modelling efforts relative to the calculated MnNCKFMASHTO pseudosection diagram for the EP-1957 bulk composition. Conditions for each interpreted metamorphic event (i.e. M1, M2 and M3) are noted. Given that M1 conditions are well-constrained, these P-T conditions are boxed in dark green.

Though the P-T conditions for each of the identified metamorphic events preserved by the COR lithology are generally constrained, determining the exact timing of each metamorphic event is more difficult. Based on xenolithic field relationships, it is likely that the protoliths for the COR lithology and the other granulite-facies rocks in the area (quartzites, migmatites, ironstones, and mafic granulites and amphibolites), all of which share the same general metamorphic history, predate the surrounding the 2.79–2.83 Ga Long Lake Magmatic Complex. Xenolithic rock protoliths probably formed between 3.00 Ga (youngest detrital zircon age in quartzite xenoliths) and the intrusion of the Long Lake Magmatic Complex. The Long Lake Magmatic Complex probably served as the heat source that drove granulite-facies metamorphism of the COR and adjacent xenolithic rocks (M1 event) and later amphibolite-facies overprinting and hydration (M2 event). However, the continuum of Long Lake Magmatic Complex ages obfuscates the exact timing of each metamorphic event thus the amount of time between these metamorphic events is not well-constrained. Unpublished monazite geochronology from a single COR monazite inclusion in anthophyllite yields a U–Pb radiometric age determination of 2.79 Ga suggesting that M2 metamorphism, the event that formed anthophyllite at the expense of orthopyroxene, might have occurred during the later stages of Long Lake Magmatic Complex intrusion, however additional COR geochronology data are required to confirm this interpretation. The timing of M3 greenschist-facies overprinting is the most difficult to determine. However, it probably occurred as a later-stage hydration event sometime between the end of Long Lake Magmatic Complex intrusion and the conclusion of the Archean given by the oldest K-Ar whole-rock ages in the study area that are ∼2.50 Ga (e.g. Baadsgaard and Mueller, Reference Baadsgaard and Mueller1973).
It is noteworthy that other studies in the area have proposed that granulite-facies metamorphism post-dated the intrusion of the Long Lake Magmatic Complex and instead occurred at ∼2.67–2.69 Ga (Dragovic et al., Reference Dragovic, Guevara, Caddick, Baxter and Kylander-Clark2016). This interpreted temporal history is based on monazite U–Pb and garnet Sm–Nd radiometric age determination from granulite-facies migmatites and ironstones in the study area. In this model, the granulite facies event was cryptic in that it did not result in pervasive recrystallisation of the adjacent Long Lake Magmatic Complex and is only preserved by select rocks in the study area. However, the present study does not favour this interpreted chronology based on field relationships (i.e. intrusive contacts by the Long Lake Magmatic Complex into granulite-facies xenolithic rocks and the lack of a heat source that could have produced granulite-facies conditions post-intrusion).
Regardless of the lack of well-defined age constraints for each metamorphic event, the resolved clockwise P-T path for the Quad Creek COR is interpreted to represent metamorphism in an Archean convergent margin setting similar to modern continental arc subduction zones. The deposition of the stable-margin sediments, that is the protoliths of adjacent metasedimentary xenolithic lithologies at ∼3.00–2.80, constrains the maximum age to the high-grade metamorphism (i.e. M1 metamorphism). Initial granulite-facies metamorphism (M1) probably resulted from tectonic burial of the COR protolith to mid-crustal depths (i.e. ∼18–24 km given metamorphic pressure constraints) and heating of xenolithic lithology protoliths associated with initial intrusion of the calc-alkaline Long Lake Magmatic Complex at ∼2.83 Ga. In contrast, the second and third hydrating overprint events (M2 and M3) probably resulted from multiple stages of hydration. It is interpreted that M2 fluids were probably associated with the Long Lake Magmatic Complex intrusion, however the origin of M3 fluids is not known. Metamorphic temporal constraints in the eastern Beartooth Mountains are difficult to secure regardless of the preferred chronological reconstruction. There are petrologically similar study areas in the Wyoming Province where the chronologies are better defined that may serve as potential analogues to the inferred COR temporal history. The late Archean metamorphic rocks of the Wind River Range of central Wyoming preserved in the adjacent Southern Accreted Terranes preserve a multi-stage metamorphic history similar to that presented here. This multi-stage metamorphic history consists of M1, granulite-facies metamorphism (∼0.70–0.80 GPa and >750°C) followed by lower-grade M2, amphibolite-facies metamorphism (M2, ∼0.40–0.55 GPa and 650–750°C) and still lower-grade M3, greenschist-facies metamorphism (M3, ∼0.20–0.30 GPa and ∼500°C) (Frost et al., Reference Frost, Chamberlain, Swapp, Frost and Hulsebosch2000). The Wind River Range metamorphic P-T history differs from the P-T history presented here mainly in the presence of a fourth metamorphic event (M4), an amphibolite- to granulite-facies contact metamorphic event, the P-T conditions of which vary depending on location in the range (i.e. ∼0.30 GPa and <700°C, in the southern portion of the range to ∼0.60 GPa and ∼800°C in the north). Though the exact timing of M1 metamorphism in the area is unclear (estimated to be prior to 2.83 Ga), timing of the proceeding metamorphic events is well-constrained: M2 – 2.67 Ga, M3 – 2.63–2.65 Ga, and M4 – 2.63 Ga (Frost et al., Reference Frost, Chamberlain, Swapp, Frost and Hulsebosch2000). The later interpreted metamorphic events, M2–M4, in the Wind River Range probably post-date the main stages of metamorphism in the eastern Beartooth Mountains (i.e. at least M1 and M2 metamorphism), however investigations into these rocks demonstrate the potential magnitude of the temporal gaps between the metamorphic events interpreted in this study. Though the overall P-T path in the Wind River Range is not clockwise, as is the COR P-T path presented here, the same tectonic setting is invoked for the Wind River Range rocks (i.e. Archean continental arc subduction zone).
At present, there are no trace-element or isotopic data for the Quad Creek COR that can be used to distinguish between sedimentary and igneous protoliths. However, given the tectonic setting inferred from the modelled metamorphic P-T path and the field context of neighbouring mafic amphibolite xenoliths, an igneous protolith is the favoured interpretation. Specifically, the protolith was probably a basaltic rock that was metasomatically altered prior to subsequent metamorphism and tectonic mixing with other xenolithic lithologies. This interpretation is preferred even though the high SiO2 content (76.19 wt.%) in the modelled EP-1957 bulk composition that exceeds most of the SiO2 contents commonly reported for both hydrothermally altered basalts (∼35–50 wt.% SiO2, e.g. Hernández-Uribe et al., Reference Hernández-Uribe, Palin, Cone and Cao2020) and COR lithologies (∼40–70 wt.% SiO2; Diener et al., Reference Diener, Powell and White2008). Eckelmann and Poldervaart (Reference Eckelmann and Poldervaart1957) noted this ‘siliceous’ bulk composition as uncharacteristic of previously reported COR bulk compositions and attributed these measurements to silica input from quartzites that are immediately adjacent to the outcrop in addition to mafic amphibolites. This hypothesis serves to explain the characteristic COR mineral assemblage paired with a high quartz mode in the EP-1957 sample (i.e. 56 vol.%). In contrast to the EP-1957 sample, COR samples in this investigation do not typically preserve quartz modes that exceed ∼15 vol.% of the total rock volume (see Supplementary material S2 for scans of representative COR thin sections and corresponding rock chips) thus it is likely that sample EP-1957 was collected near the contact between the COR and adjacent quartzite xenoliths.
The interpreted hydrothermally altered basaltic protolith coupled with the inferred continental arc subduction zone setting implies that the COR protolith originally comprised a (metasomatised) portion of the subducting Archean seafloor. Although the timing of initial protolith crystallisation and hydrothermal alteration are obscured by high-grade metamorphism, protolith (re)crystallisation probably occurred during deposition of metasedimentary protoliths in the general timeframe of ∼3.00 to ∼2.80 Ga. Relative to other Wyoming Province CORs, this proposed tectonometamorphic origin for the Quad Creek COR is in contrast to the demonstrably sedimentary origin of the COR in the Stillwater contact aureole (e.g. Labotka and Kath, Reference Labotka and Kath2001) and is instead more similar to the inferred tectonometamorphic origin of Wyoming Province CORs in ranges to the west within the Montana Metasedimentary terrane (e.g. Crenshaw, Reference Crenshaw2021).
Quad Creek COR in the context of global occurrences
The Quad Creek COR is unique among global localities in terms of its mineralogy and preserved rock textures. For example, many COR lithologies described worldwide display mineral assemblages that are emblematic of more Fe-rich and/or Al-rich bulk compositions with the presence of minerals such as corundum, cummingtonite, garnet, gedrite and/or sapphirine; all of which are absent in the present COR. More distinctive is that the Quad Creek COR is one of relatively few global COR localities that contain orthopyroxene. The vast majority of global CORs are orthopyroxene-absent and instead contain anthophyllite and/or gedrite as the inosilicate phase(s) present, including the Orijärvi CORs first described by Eskola. However, orthopyroxene-containing CORs (with or without orthorhombic amphiboles) are global in occurrence: Algeria (Guiraud et al., Reference Guiraud, Powell and Cottin1996); Canada (Arima and Barnett, Reference Arima and Barnett1984; Blein et al., Reference Blein, Corriveau, LafFleche, Tollo, Mclelland, Corriveau and Bartholomew2004); Finland (Schreurs and Westra, Reference Schreurs and Westra1985); India (Jayananda et al., Reference Jayananda, Banerjee, Pant, Dasgupta, Kano, Mahesha and Mahabaleswar2012); Norway (Beeson, Reference Beeson1978); and South Africa (van Reenen, Reference van Reenen1986; Moore and Waters, Reference Moore and Waters1990). Though many of these orthopyroxene-containing CORs are reported to have reached granulite-facies peak temperatures that were similar to, or greater than, peak temperatures reported here, the Quad Creek COR appears to be among few orthopyroxene-containing COR localities that clearly preserve the onset of melting.
Although the Quad Creek COR is demonstrably unique in terms of its preserved mineral assemblage and associated textures, the compositions of its main mineral constituents is essentially consistent with analogous CORs described elsewhere, such as CORs with anthophyllite and/or orthopyroxene as the sole inosilicates and the absence of more aluminous phases such as garnet. The Quad Creek COR ferromagnesian phases anthophyllite, biotite, cordierite and orthopyroxene, are in many cases more magnesian than their global analogues; generally with ∼0.05–0.15 Mg#. Analogous anthophyllite and biotite data are most abundant in the literature and comparisons are shown in Figs 16 and 17. For both anthophyllite and biotite, the Quad Creek COR data fall well within that described in the literature. Though there is a greater disparity in biotite Ti versus Mg–Fe data for the Quad Creek COR relative to those in the literature data, this disparity is attributable to differing grades of metamorphism experienced among the different CORs.
Orthoamphibole compositons of Quad Creek COR anthophyllite (represented by dashed black lines) and anthophyllite from analogous COR localities plotted relative to the classification scheme of Hawthorne et al. (Reference Hawthorne, Oberti, Harlow, Maresch, Martin, Schumacher and Welch2012) that is based on Al+Fe3++Ti in the c crystallographic site and the Mg#. The Quad Creek COR anthophyllite dataset falls neatly within the range defined by the datasets from the literature.

Comparisons between Quad Creek COR biotite and biotite from analogous global CORs: (a) Mg# vs Al content relative to compositional end-members; (b) Mg# vs Al content relative to Henry et al. (Reference Henry, Guidotti and Thomson2005) TiB thermometry isopleths that indicate the resultant calculated TiB temperature for each biotite measurement. Biotite data from the literature, such as biotite from the Quad Creek COR (represented by black dashed lines), all classify as phlogopite. Quad Creek COR biotite chemistry largely falls within Al content and Mg# ranges defined by the literature data, however Quad Creek COR biotite Ti contents vary more considerably relative to that of literature analogues.

The only cordierite and orthopyroxene electron microprobe mineral compositional datasets from the literature that are analogous to the present COR are from Schreurs and Westra (Reference Schreurs and Westra1985) and Jayananda et al. (Reference Jayananda, Banerjee, Pant, Dasgupta, Kano, Mahesha and Mahabaleswar2012). For cordierite, the Quad Creek COR Mg# values (i.e. 0.82–0.87) fall between the literature Mg# values (Mg# ranges of 0.76–0.78 for Schruers and Westra and 0.85–0.89 for Jayananda and others). Additionally, Quad Creek COR cordierite contains a little more Na (i.e. 0.06–0.08 apfu more Na relative to Schreurs and Westra cordierite and 0.02–0.05 apfu more Na than Jayananda and others cordierite). Quad Creek orthopyroxene is similarly aluminous and calcic as analogues in the literature (i.e. wollastonite contents are <0.3% and Al contents range from ∼0.08 to ∼0.14 apfu for all orthopyroxene reported). Orthopyroxene from this study displays a wider Mg# variability relative to literature analogues (∼0.60 to 0.80 Mg# versus ∼0.60 Mg# for orthopyroxene from Schreurs and Westra and ∼0.69 Mg# for Jayananda and others). Lastly, the only plagioclase literature analogue for the Quad Creek COR (i.e. Jayananda et al., Reference Jayananda, Banerjee, Pant, Dasgupta, Kano, Mahesha and Mahabaleswar2012, plagioclase) is similarly poor in K-feldspar end-member (i.e. <0.50% K-end-member for all feldspar reported) and displays a lower anorthite-component range relative to Quad Creek COR plagioclase (i.e. ∼35–40% anorthite content relative to 35–60% anorthite content). Although major-element mineral composition data for COR minerals cannot be used readily to determine protolith as trace-element mineral/rock chemistry or isotopic datasets can, all the Quad Creek-analogous COR literature data discussed originate from CORs interpreted to be derived from metamorphism of a metasomatically altered basaltic igneous rock.
Conclusions and implications
The Quad Creek COR preserves distinctive evidence for multi-stage metamorphism among the ∼2.80 Ga xenolithic lithologies in the eastern Beartooth Mountains of Montana during the late Archean. On the basis of detailed petrography and P-T modelling, the Quad Creek COR preserves evidence for three discrete episodes of metamorphism termed M1, M2 and M3. The M1 suprasolidus mineral assemblage is marked by the AFM minerals: cordierite, orthopyroxene and biotite (±sillimanite), that occurred at temperatures above the anthophyllite and plagioclase breakdown reactions; the presence of plagioclase as a partially enveloping phase around non-anthophyllite matrix grains (together with complementary pseudosection predictions) is consistent with its existence as a melt/wetting phase at peak conditions. The presence of orthopyroxene and evidence for a past melt phase are textural features that set the Quad Creek COR apart from many CORs described globally. Subsolidus overprinting events M2 and M3 are marked by: (1) the stabilisation of anthophyllite at the expense of orthopyroxene via hydration; and (2) the later hydration of inosilicates to talc and cordierite to pinite/chlorite, respectively. Peak granulite-facies (M1) conditions are well-constrained to ∼0.60 GPa and 775–815°C whereas P-T conditions of the proceeding lower-grade hydration events, M2 and M3, are not as well-resolved. Geological conditions of these retrograde hydration events are modelled to have occurred at <0.40 GPa and at temperatures of 615–725°C (M2) and <0.40 GPa and <500–600°C (M3).
Overall, the interpreted metamorphic history for the Quad Creek COR indicates a local metamorphic P-T path that is clockwise in shape. This modelled P-T path geometry agrees with P-T modelling efforts by multiple workers in adjacent garnet-bearing xenolithic lithologies. A clockwise P-T path is consistent with metamorphism in a continental arc subduction zone, the tectonometamorphic setting that is inferred to have metamorphosed xenolithic lithologies, including the COR of interest and emplaced the voluminous 2.79–2.83 Ga calc-alkaline, TTG plutonic rocks of the Long Lake Magmatic Complex that host xenolithic lithologies in the area. It is interpreted that xenolithic lithologies were first heated to granulite-facies peak temperatures during initial tectonic burial prior to later hydration/overprinting from plutonic fluids probably derived, in-part, from Long Lake Magmatic Complex intrusions. In this tectonic model, the protolith of the Quad Creek COR is inferred to have been a previously metasomatised basaltic protolith that probably comprised a portion of the subducting Archean seafloor prior to metamorphism. This mode of origin is consistent with an array of CORs worldwide as well as other Archean CORs in mountain ranges west of the Beartooth’s in the Montana Metasedimentary Terrane. Although firm chronological constraints for COR petrogenesis are elusive, the protolith was probably formed and hydrothermally altered between ∼3.00 Ga (youngest age of detrital zircon in adjacent metasedimentary xenolithic rocks) and intrusion of the Long Lake Magmatic Complex. The continuum of Long Lake Magmatic Complex ages (∼2.79–2.83 Ga) obscures the timing of initial M1 metamorphism and subsequent M2 overprinting, however based on comparisons with analogous rocks in the Wyoming Province (Wind River Range) and cursory monazite geochronology, it is possible that variable time (i.e. up to ∼0.40 Ga, age range of Long Lake Magmatic Complex) may have passed between the M1 and M2 events. The lowest-grade metamorphism of the COR (M3) probably occurred sometime between the end of Long Lake Magmatic Complex intrusions (∼2.79 Ga) and the end of the Archean (∼2.50 Ga, youngest K–Ar radiometric determined ages preserved in the study area). The results of this study are significant as they provide additional lines of evidence for the overall tectonometamorphic history of an important Archean terrane the P-T history of which is commonly difficult to model. Moreover, this investigation exemplifies the petrological usefulness of mineral assemblages in these cordierite-orthopyroxene and/or -orthoamphibole rocks (CORs) in investigating multi-staged metamorphic histories that are difficult to examine using other, comparatively more common metamorphic lithologies. Relative to the COR lithology, which preserves discrete mineral parageneses that are correlative to each of the three metamorphic events in the eastern Beartooth Mountains, the adjacent, more common metamorphic lithologies (i.e. migmatites, ironstones, quartzites and amphibolites) seldom contain mineral parageneses that are reflective of all three metamorphic events.
Supplementary material
The supplementary material for this article can be found at https://doi.org/10.1180/mgm.2025.10152.
Acknowledgements
This contribution is in honour of Ed Grew’s rich and varied geological research contributions as a petrological mineralogist. Specifically, this work celebrates the careful attention that Ed has devoted to understanding the complex evolution of Archean granulite-facies rocks. Matt Loocke and Peter Horvath are thanked for operation of the electron microprobe and for ensuring the quality of the data collected. Jay Thomas and Will Nachlas are thanked for providing quartz standards for Ti-in-quartz analysis. Jeff Vervoort, Chris Fisher, and Da Wang are thanked facilitating cursory COR monazite geochronology. Gwendy Stuart is acknowledged for hosting Beartooth workers while in Bozeman, Montana. Rachel Gnieski helped with collecting samples in the field and subsequent sample processing. The overall quality of this work benefited from conversations with Barb Dutrow and Kyle Tollefson. Petrographic observations of the Quad Creek COR by multiple Louisiana State University undergraduate igneous and metamorphic petrology students for their semester ‘Pet Rock’ project are also acknowledged. Finally, the editors (Roger Mitchell and Jesse Walters) are thanked for facilitating the publication of this work in Mineralogical Magazine and the reviewers (Ron Frost and an anonymous reviewer) are thanked for their constructive feedback on the initial version of the manuscript.
Financial statement
Funding for this work was provided through multiple organisations including the American Federation of Mineralogical Societies, Campanile Charities Incorporated, the LSU Chevron Student Analytical Research fund, the LSU Department of Geology and Geophysics, the National Science Foundation and the New Orleans Geological Society.
Competing interests
The authors declare none.