1. Introduction
There has been a dramatic expansion of direct democracy across the world in recent years.Footnote 1 In emerging countries, decisions at the local level are increasingly adopted in participatory meetings. These include the Gram Panchayat in India, the participatory budget (Conselho do Orçamento Participativo) in Brazil, and many others in countries such as Bolivia, Indonesia, Mexico, Peru, Uganda, and Venezuela. Direct democracy is also growing in developed countries. In the US, town hall meetings are widely used at the local level in New England, and voters have decided more than 1,600 state-wide ballot propositions in the 21st century.Footnote 2 In Europe, direct voter participation is a hallmark of Switzerland and has become increasingly popular at the local level in Germany. Its use also has been debated in Italy, the Netherlands, Spain, and in European Union's institutions.
It is therefore not surprising that increasing academic attention is devoted to direct democracy and, in particular, to how it affects economic policy. Most of the literature suggests that direct democracy reduces expenditures and revenues, but other work has found the opposite (Matsusaka Reference Matsusaka2017). The present paper makes an empirical contribution to this discussion, by providing quasi-experimental evidence from an unexplored setting. In addition, despite the growing attention to direct democracy in general, most work focuses on referendums and initiatives, while the evidence on participatory meetings is still scarce. This paper studies direct democracy in the form of town meetings.
Using a yearly panel dataset from the budgets of Spanish municipalities in the period 1988–2011, I test how direct democracy affects the size of government. In Spain, national law mandates that municipalities operate under a direct or representative democracy, depending on the size of their population. Municipalities with 100 or more inhabitants follow a representative-democracy system, while those with fewer than 100 inhabitants use direct democracy. Under representative democracy, citizens elect a city council every fourth year, and the council decides on policy. Under direct democracy, the role of the city council is played out in open town meetings held approximately four times a year.
This institutional framework presents several attractive features. First, the use of direct or representative democracy is determined by population size, as mandated by a national law, which reduces endogeneity concerns. Intuitively, the advantage of this context is that it allows to compare municipalities that differ in their government system but have almost the same size and hence are similar in other aspects that could affect their budgets. Second, no other rule changes at the threshold, unlike what is often the case for municipal population thresholds. I therefore can attribute the differences between municipalities at each side of the threshold to the government system and not to some other regulation. Third, the number of observations is large, leading to precise estimates. There are more than 8,000 municipalities in Spain, and, furthermore, many municipalities have a population size close to the threshold (around 2,000 municipalities with a population of 250 of fewer inhabitants—see Table A1). Fourth, Spanish municipalities have substantial autonomy in both expenditures and revenues and have considerable variation in fiscal policy across them. For example, the municipality in the 90th percentile of expenditures spends four times more than the one in the 10th percentile.
The main finding is that direct democracy reduces the size of government. In the preferred specification, direct democracy reduces spending per capita by almost 8 percent. Revenues per capita are decreased by a similar amount, and budget deficits are therefore equal under both systems.
As an illustration of a possible mechanism, in the appendix I present a model, adapted from Besley and Coate (Reference Besley and Coate2008). The intuition is that, in representative democracy, citizens have only one vote to cast for candidates who have responsibility for choosing a bundle of issues, and this may lead to policies that are incongruent with the position favored by the majority (Besley and Coate Reference Besley and Coate2008). In particular, if politicians are interested in increasing spending to favor special-interest groups, then representative democracy will result in overspending. In this sense, Besley and Case (Reference Besley and Case2003) argue that “there is a widespread belief that agency problems lead to a government that is too large” under representative democracy. One way to address this issue is to expand the use of direct democracy, in which people decide policy initiatives directly. By issue unbundling, direct democracy allows the median voter's preferences to prevail along different dimensions and, therefore, constrains politicians' ability to increase expenditures (Matsusaka Reference Matsusaka2005).
I also discuss other potential mechanisms. In particular, direct democracy could: (a) directly affect what policy individuals prefer, making citizens prefer a smaller government, (b) make it easier to obtain transfers from upper-level governments, (c) make it more difficult to engage in more ambitious and expensive policies due to the lack of professionalized representatives, and (d) be more easily captured by an elite who wants less spending. To shed light on their plausibility, I present four additional sets of results. First, against a hypothesis of gradual learning, the effect is stable over time—it appears in the first term a municipality works under direct democracy, and remains similar as it spends more time in direct democracy. Second, direct democracy does not affect subsequent elections' behavior (e.g., being exposed to participatory meetings does not lead to more voter turnout in subsequent elections). Third, direct-democracy municipalities do not obtain more transfers from upper-level governments. Fourth, against the hypothesis that the results are driven by direct democracy making it more difficult to engage in more ambitious and expensive projects, direct democracy does not reduce capital (infrastructure) spending. In light of this evidence, I conclude that, although it is not possible to rule out completely that some of the alternative mechanisms are at work, the weight of the evidence indicates that they do not drive the results.
An issue that requires careful attention is that some sorting is observed around the threshold, that is, there is a discontinuity in the density of population sizes at the threshold. To deal with this issue, I exploit switches in the government system of municipalities over time: the empirical strategy combines a regression discontinuity design with municipality and year fixed effects.Footnote 3 This identification leads to very good covariate balance. In addition, I show that the results are robust to dropping the observations in the domain of population sizes affected by the sorting, via “donut” regressions.
This paper contributes to the literature that analyzes how public budgets are affected by direct democracy, by providing quasi-experimental evidence from a novel setting.Footnote 4 Evidence from US States and Switzerland shows that referendums and initiatives reduce public spending and revenues (see Matsusaka Reference Matsusaka1995; Besley and Case Reference Besley and Case2003; Primo Reference Primo2006 for the US, and Feld and Matsusaka Reference Feld and Matsusaka2003; Freitag and Vatter Reference Freitag and Vatter2006; Funk and Gathmann Reference Funk and Gathmann2011 Reference Funk and Gathmann2013; Galletta and Jametti Reference Galletta and Jametti2015; Burret and Feld Reference Burret and Feld2018 for Switzerland).Footnote 5 The evidence for cities, however, seems to go in the opposite direction—(Blume et al. Reference Blume, Döring and Voigt2011; Asatryan Reference Asatryan2016; Asatryan et al. Reference Asatryan, Baskaran, Grigoriadis and Heinemann2017), have found that initiatives increase expenditures in Germany, and (Zax Reference Zax1989; Farnham Reference Farnham1990; Primo Reference Primo2010) in US cities. Other work has studied the effects on budget deficits—(Feld and Kirchgässner Reference Feld and Kirchgässner2001; Feld et al. Reference Feld, Kirchgässner and Schaltegger2011) have found that referendums reduce public deficits and debt in Switzerland.
All of the works summarized so far focus on the effects of direct democracy in the form of referendums or initiatives, while the present paper studies town meetings. One paper that specifically studies the effects of participatory meetings is Hinnerich and Pettersson-Lidbom (Reference Hinnerich and Pettersson-Lidbom2014). Unlike the present paper, they study a historical setting—Sweden in the 1920s and 30s—and focus on welfare spending. They find that town meetings reduced welfare expenditures by 40–60 percent. Finally, other work has studied the effects of town meetings on other outcomes. For example, Besley et al. (Reference Besley, Pande and Rao2005) find that village meetings in South India improved the targeting of welfare programs for the poor; and Olken (Reference Olken2010) finds that the use of plebiscites improved voter satisfaction with public policy in Indonesian villages.
2. Theoretical framework
Social scientists have long been interested in how switching from representative to direct democracy might change policy. One strand of the literature argues that, in representative democracy, an agency problem exists between voters and their elected representatives due to free-rider problems in monitoring and disciplining officeholders (Matsusaka Reference Matsusaka2005). This gives elected officials leeway to pursue costly policies that are not in the interests of their constituents, resulting in overspending (Wagschal Reference Wagschal1997). Frey (Reference Frey1994) argues that a model that pictures politicians as forming a coalition against taxpayers and voters seems to be an apt illustration of representative democracy. In this view, the elected representatives are a well-defined group that jointly reaps rents or cartelizes against the interests of citizens. Besley and Case (Reference Besley and Case2003), in summarizing this literature, conclude that “there is a widespread belief that agency problems lead to a government that is too large” under representative democracy. The use of direct-democracy institutions is a way to address this issue. By allowing people to vote directly on policy, direct democracy gives them a way to circumvent representative institutions that may have been captured by elites or other special interests and aligns policy with the preferences of the median voter (Matsusaka Reference Matsusaka2005).
Another strand of the literature emphasizes that, under representative democracy, citizens have only one vote to cast for candidates who have responsibility for choosing a bundle of issues (Besley and Coate Reference Besley and Coate2008). This may lead to policies that are incongruent with the position favored by the median voter in some of the dimensions. By unbundling issues, direct democracy allows the median voter's preferences to prevail along different dimensions.Footnote 6
I formalize these ideas in a simple model, adapted from Besley and Coate (Reference Besley and Coate2008), that I summarize here and present in full in Appendix A. The model should be seen as a way to illustrate a possible mechanism through which direct democracy may reduce spending—it is not intended to be a structural model to be directly tested in the data. While other models may yield similar empirical predictions, the one presented here has the advantage that it highlights features of direct democracy (issue unbundling, special-interest spending) that are shared by town meetings and referendums/initiatives—in other types of models, the predictions depend on which specific form of direct democracy is employed.
In the model, the policy is two-dimensional. There is a main ideological issue (henceforth, ideology) and a secondary issue (special-interest spending). Although the majority of individuals prefer low (possibly zero) special-interest spending, there exists a minority that prefers high spending, perhaps because they will benefit directly from it. The majority care more about ideology but the minority care more about spending. Under representative democracy, the policy is implemented by a representative elected in an election between two candidates, proposed by two political parties. Assuming the minority is sufficiently large, in the unique equilibrium, both parties propose high special-interest spending, against the wishes of the majority. Intuitively, both parties compete to attract the votes of the special interests, and this results in high spending. Under direct democracy, by contrast, individuals vote separately on the ideological issue and on special-interest spending, and the position favored by the median voter in each dimension is chosen. Direct democracy, therefore, results in low special-interest spending, unlike what happens under representative democracy.
The model is consistent with ethnographic work on the Spanish direct-democracy system. García-Espín (Reference García-Espín2016) has studied in depth the dynamics of the meetings, and has found that conflict avoidance plays a large role. In particular, participants in the meetings believe that politics may increase confrontation among neighbors. As she puts it, when private interests become public in the meetings, it causes bitter arguments. For this reason, people stay away from bringing up contentious issues. In this sense, consistent with the model, special interests can better promote their agenda in representative than in direct democracy. Suppose that there is a group of citizens with a particular interest in some spending item (e.g., they want more spending on festivities). In representative democracy, councilors have an incentive to increase expenditures on this item in order to attract the votes of those citizens in the next election. In direct democracy, by contrast, those citizens would have to bring up the issue at a meeting, which poses the risk of creating conflict. For this reason, they will (in most cases) refrain from doing so. Hence, particular-interest spending is more likely to be approved in representative than in direct democracy.
The model, in sum, blends the points made by two different strands of the literature: that direct democracy curbs special interest spending, and that it aligns policy with the preferences of the median voter through the unbundling of issues. This way, the model provides a way to rationalize the findings of the paper. In Section 7, I discuss in detail other possible mechanisms at play.
3. Institutional background
In this section, I provide some institutional background and describe the two government systems that are used by Spanish municipalities. Spain is a very decentralized country. It is politically divided into 17 regions, 50 provinces, and more than 8,000 municipalities, which are administered by local governments. Local governments spend 13 percent of the overall spending of the country and have substantial autonomy. National law (Local Government Regulatory Law, Ley de Bases del Régimen Local) requires them to provide a variety of services, including public lighting, waste collection, street cleaning, road paving, household water supply, sewerage, access to villages, and food and beverage control. In addition, they usually provide other services useful to the municipality, such as organizing local festivities or providing tourist information. Local governments can decide how much to spend on the required goods and services and whether to provide additional goods and services. There is considerable variation in expenditures across municipalities: The 90–10 ratio is 4.6.Footnote 7
Local governments obtain their own revenues from taxes and fees: they can set the tax rates—within certain limits imposed by national law—and the prices and user fees of the goods and services that they provide. According to national law, municipalities can impose five different taxes: property tax (impuesto de bienes inmuebles), a tax on economic activities (impuesto de actividades económicas), a motor vehicle tax (impuesto sobre los vehículos de tracción mecánica), a tax on improvements to real property (impuesto de instalaciones, construcciones y obras), and a tax on the increased value of urban land (impuesto sobre el incremento de valor de los terrenos de naturaleza urbana).Footnote 8 As happens with expenditures, there is substantial variation in revenues across municipalities: The 90–10 ratio is 4.5.
In addition to these own expenditures and revenues, some expenditures are financed through transfers from upper-level governments.Footnote 9 Throughout the paper, I focus on the municipalities' own expenditures and revenues (i.e., overall revenues and expenditures net of transfers), as they are the ones that can be controlled by local governments. In Section 7, I study if the amount of received transfers can drive the results of the paper.
The Law on Budget Stability (Ley de Estabilidad Presupuestaria) states that municipalities must have a balanced budget.Footnote 10 However, no penalty is stipulated for municipalities that fail to comply with the law. Indeed, there was a deficit in 39 percent of the budgets in the sample, and in many cases a sizable one: for example, in 14 percent of the budgets I observe a deficit of more than 3 percent of revenues (see the histogram of deficits in Figure A1).Footnote 11 For this reason, it makes sense to test whether direct democracy has an effect on deficits.
Municipalities must follow a government system that is determined by their population size one year before the local elections, which are held simultaneously in all municipalities in the country every four years. Therefore, municipalities change the government system at most once every four years. During the sample period (1988–2011), municipalities with 100 or more inhabitants followed a representative-democracy system, while those with fewer than 100 inhabitants followed a direct-democracy system (called “open council”, or concejo abierto). Table A1 shows the number of direct-democracy municipalities covered in the sample, by term. Between 603 and 827 municipalities operated under direct democracy, with the number increasing over time as a consequence of the declining population of small municipalities.
In the representative-democracy system, individuals elect a city council every four years on local election day. The council elects a mayor among its members and is entitled to approve the budget, decide on expenditures in various fields, control the governing bodies, and to decide on the roll-call vote of confidence on the mayor. The mayor chairs the meetings of the council, casts the decisive vote in the event of a tie, heads the local police, and appoints mayoral deputies and cabinet members, among other responsibilities. The size of the city council and the electoral rules differ according to the population of the municipality. In particular, there is a change in the electoral system at 250 inhabitants (Sanz Reference Sanz2017). Municipalities below that population size elect a council of five members in an open-list, plurality-at-large election, while those above follow a proportional representation system. To avoid dealing with multiple thresholds, and given that the estimation will exploit municipalities with a population size close to the 100-inhabitant threshold, I restrict the sample to municipalities with 250 or fewer inhabitants.Footnote 12 City councilors of these municipalities do not receive a wage or salary—hence, the differences in spending between direct- and representative-democracy municipalities cannot be driven by wages paid to city councilors in representative democracy.
In the direct-democracy system, the role of the city council is played through open town meetings, so most relevant decisions, including the budget, must be approved directly by individuals in a pure direct democracy framework. (In Appendix B, I describe the origins and the evolution in the application of this system.) The specific working rules of the meetings may differ across municipalities, as the law states that municipalities can work according to the local traditions. However, national law (Real Decreto 2568/1986) provides some guidelines. Any individual eligible to vote (age 18+) may attend the meetings. The meetings are chaired by the mayor, who is elected by first-past-the-post on local election day. Town meetings are to be called on a Sunday or a holiday at least once every three months. A quorum of one-third of the population is required. Citizens can delegate their vote to any other citizen of the municipality, but no citizen can represent more than a third of all individuals.Footnote 13 Decisions are adopted by simple plurality rule. Data for attendance are not publicly available, but I have collected data by hand from the minutes of the meetings in one Spanish province.Footnote 14 Average attendance in the sample was 11.6 percent. Taking vote delegation into account, the average share of represented voters was 43.7 percent.
One could think that, given that average participation at meetings is low, the two systems are in fact not so different—in the direct democracy system, the citizens that attend the meetings could be seen as acting, in practice, as the “councilors” of those towns. There are, however, important differences. First, in the direct democracy system citizens can always decide to attend a meeting—even if they usually do not turn out, the mere possibility that they do imposes an important constraint on the behavior of their delegates. Second, in the direct democracy system one can revoke the delegation at any time during the term (even if the delegation were permanent), while in the representative democracy system city councilors cannot be removed from office. This makes it much easier for citizens to affect the behavior of town-meeting delegates than that of city councilors. Third, in the direct democracy system one can delegate his/her vote to any person in the municipality, while in the representative democracy system one can only choose among those who run in the election party-lists. Given that running for election implies a significant commitment in terms of time and visibility, few people are willing to run, and hence the options for vote delegation are much more limited than in the direct democracy system. And fourth, while in the representative democracy system the same city councilors act during the whole four-year term, in direct democracy there can be substantial variation from some meetings to others.
4. Data
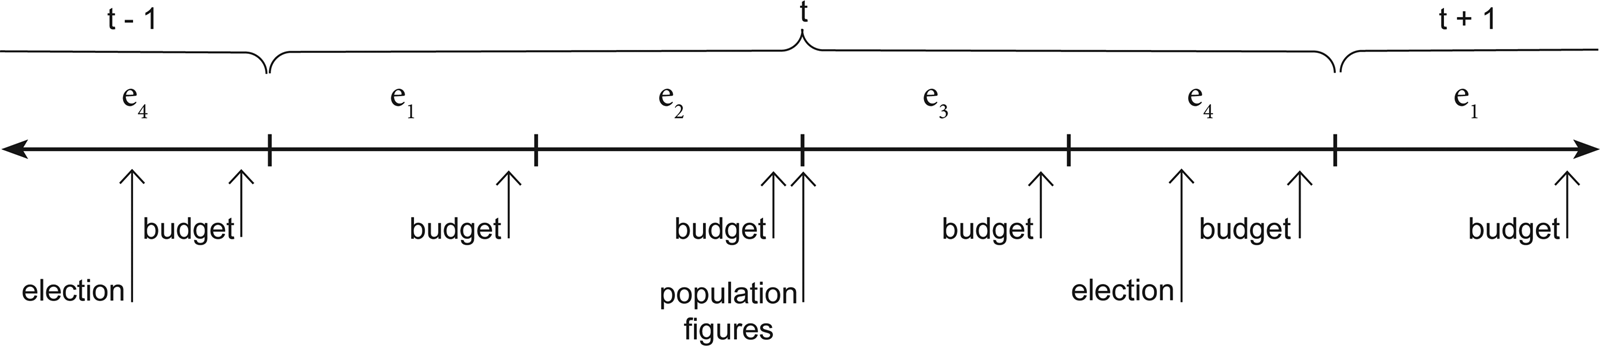
Data for the public budgets and population size of municipalities are from the Spanish Ministry of Finance (Ministerio de Hacienda) and are publicly available for 73.6 percent of annual budgets.Footnote 15 During the sample period, local elections were held every four years from 1987 to 2011, so the data set covers six terms. Because local elections are in May or June, the (possible) change in the government system happens halfway through the year. As spending and revenues are determined by the budget approved at the end of the previous year, I assign election-year observations to the previous term.Footnote 16 Figure 1 provides a graphical representation of this information.Footnote 17
Timeline: each unit represents a year y.

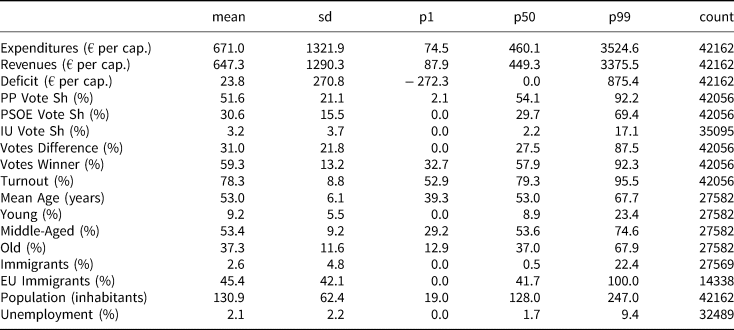
Table 1 shows the summary statistics. The first three variables are the main outcomes: real expenditures per capita (Expenditures), real revenues per capita (Revenues), and budget deficit (Deficit).Footnote 18 To obtain the variables in real terms, I divide the nominal variables by the GDP deflator.Footnote 19 The deficit is the difference between expenditures and revenues. The average municipality collects €647 per capita per year in taxes and fees, and spends €671. Therefore, the average deficit is €24 per capita per year. Figure A1 shows the histograms for these variables. I use the rest of the variables in the table to study covariate balance around the threshold—that is, to test if municipalities using direct and representative democracy are similar in these characteristics. The first six variables are from national Congress electoral results. They are the shares of votes for the three main parties in Spain—the right-wing Partido Popular (PPVoteSh), the left-wing Partido Socialista (PSOEVoteSh), and the far-left-wing Izquierda Unida (IUVoteSh)—, the difference in the share of votes for the two most-voted parties (Votes Difference), the percentage of votes for the most-voted party (Votes Winner), and voter turnout (Turnout).Footnote 20 The next six variables are demographic variables, and are provided by the National Statistics Institute (Instituto Nacional de Estadística). They are the mean age in the municipality (Mean Age); the share of young (Young), middle-aged (Middle-Aged), and old (Old) individuals; the share of immigrants (Immigrants); and the share of EU immigrants over total immigrants (EU Immigrants).Footnote 21 The final variable is the unemployment rate in the municipality (as a fraction of population size), obtained from the Ministry of Employment.Footnote 22
Summary Statistics

The unit of observation is a municipality-year. The sample size is smaller for election variables because some data are missing from the official files. The sample is even smaller for IUVoteSh because the United Left party did not run in every election. For the demographic variables, data are available only from 1996. For unemployment, data are available from 1993. Also note that, in municipalities with no immigrants, EU Immigrants is missing by construction. See Appendix C for a precise definition of the variables.
5. Empirical strategy
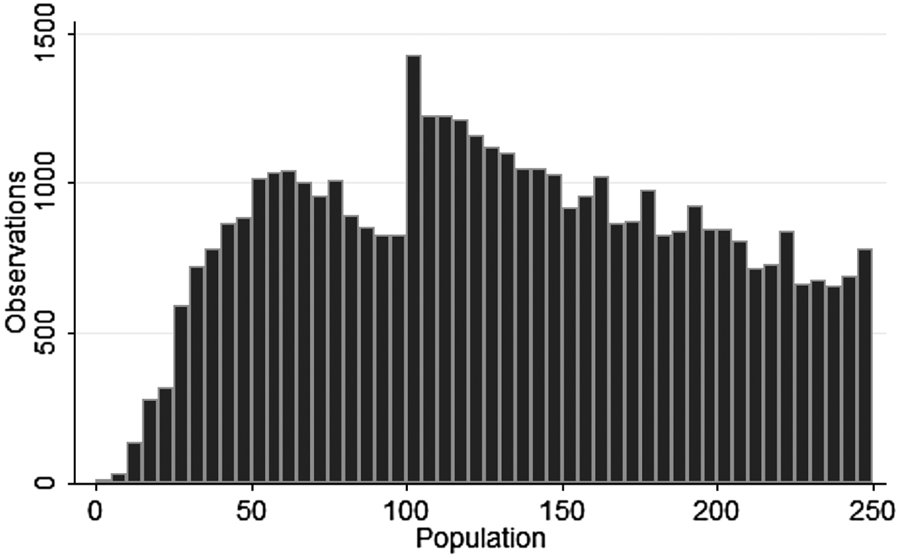
A discontinuity in the density of population sizes is observed at the threshold (see Figure 2, and Appendix D for a discussion on why this discontinuity arises).Footnote 23 In particular, the shape of the discontinuity raises the concern that some municipalities self-select into representative democracy. If municipalities at both sides of the threshold differ in other characteristics that affect policy, then a pure regression discontinuity may lead to biased estimates.Footnote 24
Histogram of population sizes. An observation is a municipality-year. Bins are 5-inhabitant wide.

To deal with this issue, in the main specification I exploit switches in government system over time, and consider a regression discontinuity design extended with fixed effects. Studies that combine a regression discontinuity with across-time variation are increasingly popular: a fixed-effect regression discontinuity is also employed by Pettersson-Lidbom (Reference Pettersson-Lidbom2012); Corbi et al. (Reference Corbi, Papaioannou and Surico2017); Sanz (Reference Sanz2017), and other papers that use related strategies include Lemieux and Milligan (Reference Lemieux and Milligan2008); Cellini et al. (Reference Cellini, Ferreira and Rothstein2010); Casas-Arce and Saiz (Reference Casas-Arce and Saiz2015); Deshpande (Reference Deshpande2016); Grembi et al. (Reference Grembi, Nannicini and Troiano2016); Asatryan et al. (Reference Asatryan, Baskaran, Grigoriadis and Heinemann2017). In the context of this paper, I find that this strategy yields credible estimates of the treatment effects. The interested reader can also see the results of a pure regression discontinuity design, with no fixed effects (see Table A2). This strategy also leads to a significant reduction in expenditures and revenues in direct democracy.Footnote 25
More specifically, I consider the following estimating equation:
 $$ Outcome_{myt} = \alpha_m + \gamma_y + \beta DirDem_{mt} + f\,(Population_{mt} - 100)+ u_{myt}, $$
where Outcome myt is the outcome of interest in municipality m at year y in term t, αm is a municipality fixed effect, γy is a year fixed effect, DirDem mt is the treatment dummy variable that takes the value of 1 if municipality m follows direct democracy in term t and 0 otherwise, Population mt is the assignment variable (population one year before the local elections), f is a smooth function of the assignment variable, and u myt is an error term. The parameter of interest is β.
The identification assumption is that there are no factors that simultaneously affect the outcomes and whether a municipality's population is just above or just below the threshold, conditional on municipality and year fixed effects. The identification is therefore based on switches in government system, of which there are 513 in the sample (see Table A1).Footnote 26 Intuitively, the regressions compare municipalities that are close to the threshold and switch from one system to another with those that remain in the same system.
I assess the validity of this empirical approach by conducting multiple additional tests, which are presented in Appendix E. In particular, I show covariate balance around the threshold and that the results are robust to donut regressions, which drop the observations in the domain of population sizes that is affected by the sorting.
I use nonparametric local linear regressions to estimate Equation (1), as suggested by Gelman and Imbens (Reference Gelman and Imbens2018). A key ingredient to this approach is the bandwidth, that is, the window of observations around the threshold used in the regressions.Footnote 27 A larger bandwidth increases the efficiency of the estimation at the cost of more bias. I choose a baseline bandwidth according to the procedure suggested by Imbens and Kalyanaraman (Reference Imbens and Kalyanaraman2012) and provide the results at different fractions of that bandwidth.Footnote 28 I use a rectangular kernel, as recommended by Lee and Lemieux (Reference Lee and Lemieux2010). This is equivalent to estimating standard linear regressions over the interval of the selected bandwidth on both sides of the cutoff point. I cluster standard errors at the municipality level. Because the running variable is discrete, I also cluster standard errors at the running variable, as recommended by Lee and Card (Reference Lee and Card2008). Therefore, I follow a multi-clustering approach (Cameron et al. Reference Cameron, Gelbach and Miller2011).Footnote 29
6. Main results: the effect of direct democracy on the size of government
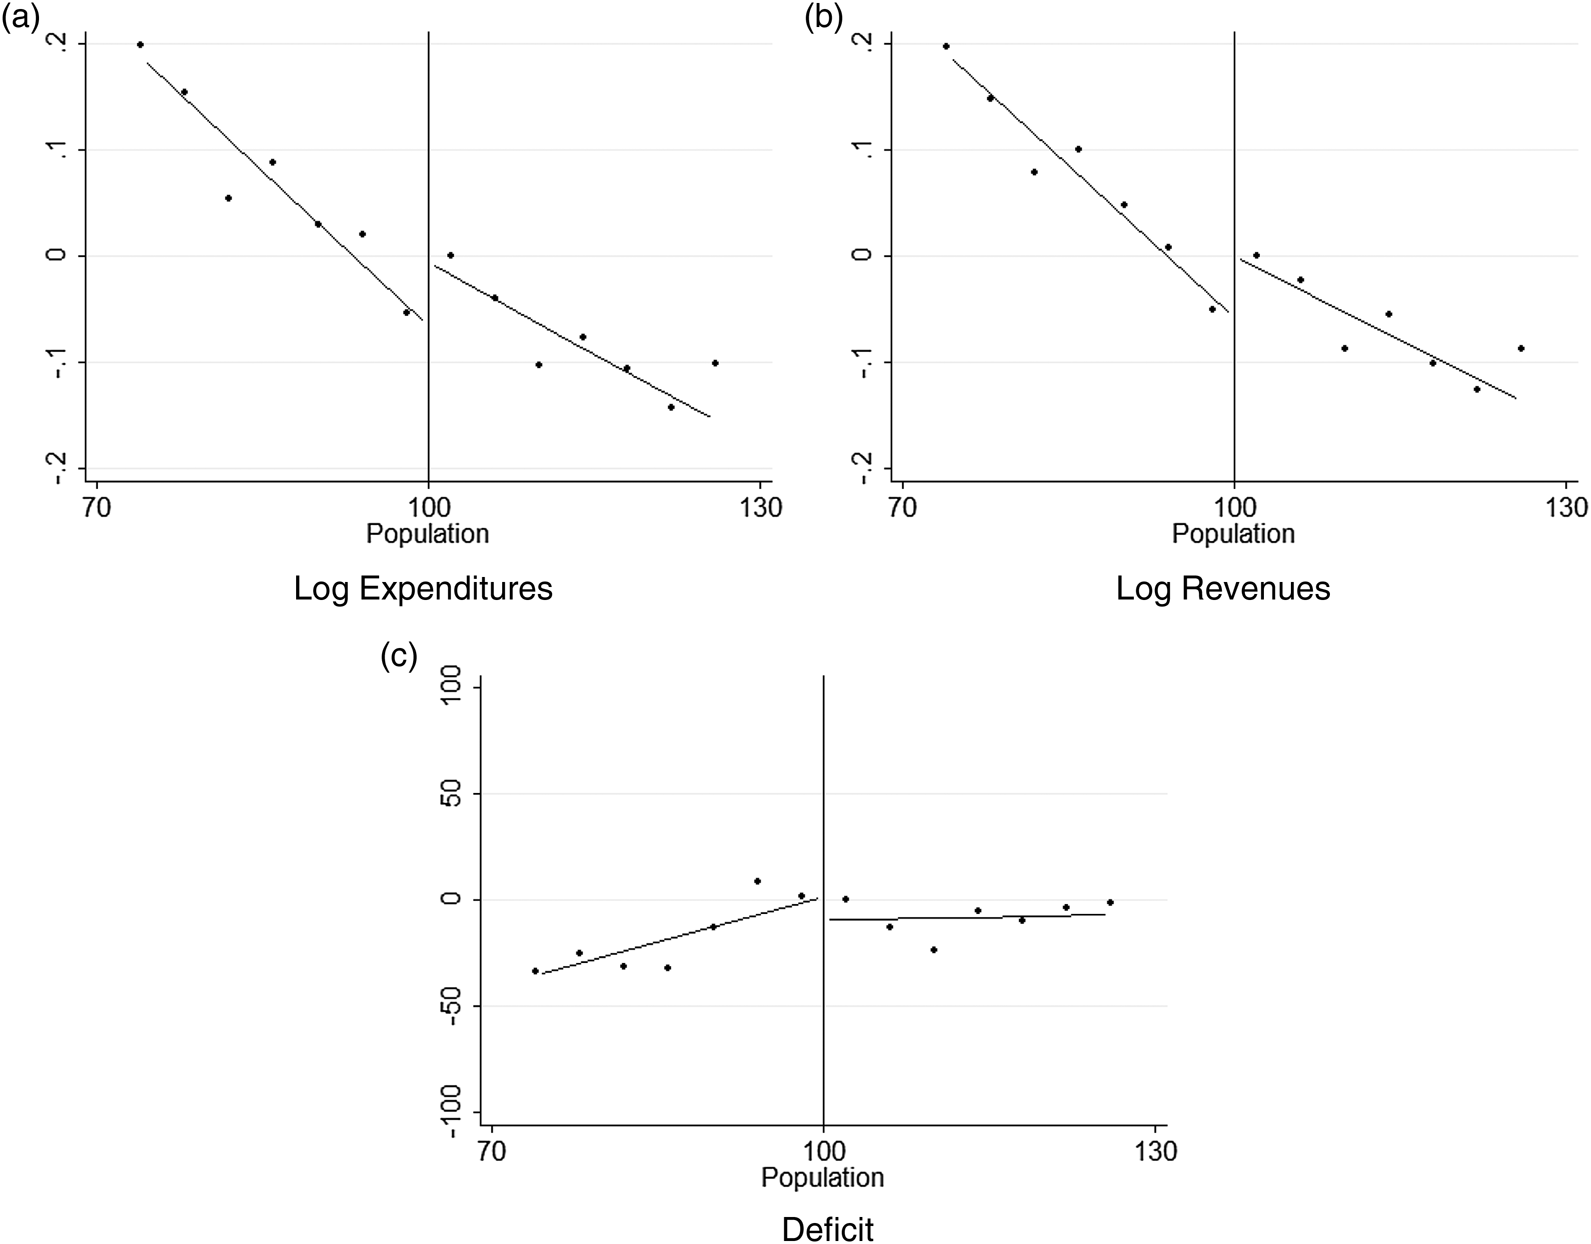
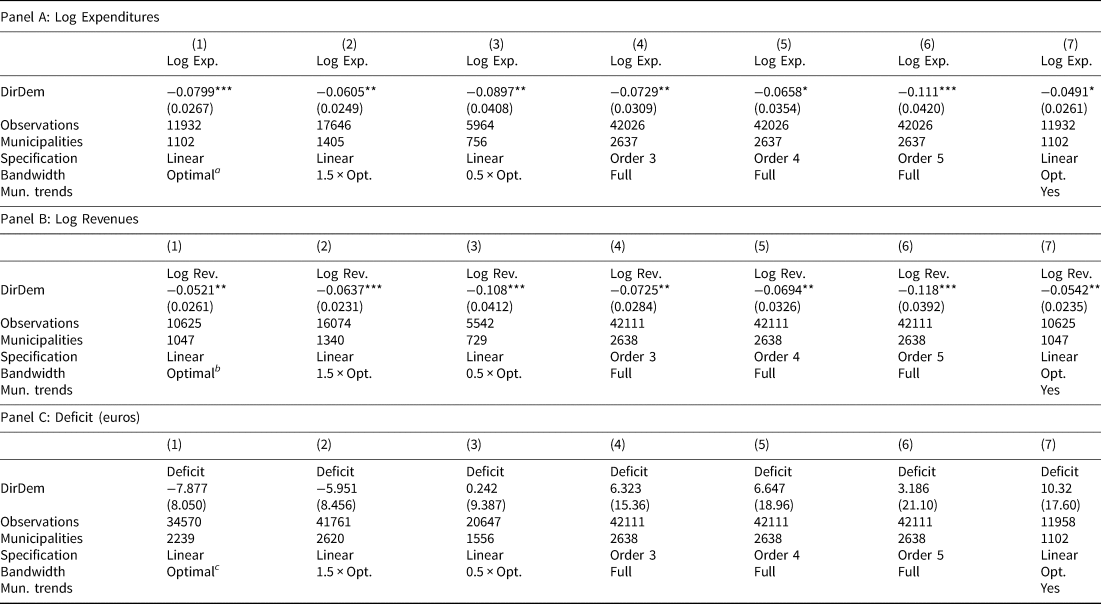
This section presents the main results of the paper. Additional results will be discussed in Section 7 to shed light on the mechanisms. Table 2 presents the estimates of the impact of direct democracy on the public finances of local governments. The table shows the results of estimating Equation (1), with the log of Expenditures, the log of Revenues, and Deficit as the outcomes. A graphical representation of the results is shown in Figure 3.Footnote 30
Effect of direct democracy on expenditures, revenues, and deficit. I estimate  $ {Outcome_{myt}} =\alpha _m + \gamma _y + \sum \nolimits _{j=100-OBW}^{100+OBW} \delta _j {Population_{j, mt}} + u_{myt}$, where Population j,mt is a dummy that indicates whether municipality m has population size j at term t. In the y-axis, I plot the estimated coefficients
 ${\hat \delta}_j$, averaged to 4-inhabitant-wide bins. I normalize the coefficients so that the average bin immediately to the right of the threshold takes the value of zero. The lines are linear fits on
 ${\hat \delta}_j$, fitted separately for observations above and below the threshold. I use the observations within the optimal bandwidth for Log Expenditures myt, so that all graphs show the same range in the x-axis.

Effect of Direct Democracy on Public Finances

Results from estimating Equation (1) (columns 1 to 6) and Equation (2) (column 7). Each column is a separate regression with a uniform kernel. All regressions include municipality and year fixed effects, and the last column also includes municipality-specific trends. Standard errors, clustered at both municipality and the running variable, are in parentheses. I calculate the optimal bandwidth following Imbens and Kalyanaraman (Reference Imbens and Kalyanaraman2012)'s procedure.  ${\rm}^{a}$ Optimal BW = 27,
 ${\rm }^{b}$ Optimal BW = 25,
 ${\rm }^{c}$ Optimal BW = 98. *p < 0.10, **p < 0.05, ***p < 0.01.
I find evidence of an effect of direct democracy on public expenditures (Panel A of Table 2). Under the preferred specification (Column 1), which uses the bandwidth from Imbens and Kalyanaraman (Reference Imbens and Kalyanaraman2012), direct democracy reduces public spending by almost 8 percent, and the effect is significant at the 1 percent level. On average, municipalities just to the right of the threshold (100 inhabitants) spend €709 per capita; thus, the effect is equivalent to a decrease of €57 per capita.Footnote 31 Next, I study robustness to bandwidth choice and alternative specifications. Columns 2 and 3 show the results for 50 and 150 percent of the optimal bandwidth (Figure A2 displays the results for a wide range of bandwidths). Columns 4--6 show that the results are robust to fitting high-order polynomials to the whole sample. Given that all the observations are employed in a model with municipality and year fixed effects, this is in fact a difference-in-difference estimation. Finally, as shown in Column 7, the results are also robust to an alternative specification that includes municipality-specific linear time trends.Footnote 32
Panels B and C of Table 2 study whether the differences in public spending go together with a change in revenues or whether they are created by different deficits. According to the preferred specification (Column 2), direct democracy reduces revenues by 5 percent, and the effect is statistically significant at the 1 percent level. The rest of the columns and Figure A2 show that the results are robust to different bandwidths and specifications, as we saw for expenditures. Finally, the results for deficits (Panel C) are close to zero and not significant under any specification. The evidence therefore indicates that direct democracy reduces expenditures and revenues by a similar amount, without affecting budget deficits.
Before turning to the next section, which will discuss some possible alternative mechanisms behind the main findings, the interested reader can go to Appendix E to see seven robustness checks on the results presented in this section: covariate balance around the threshold, pretrends in the outcomes of interest, donut regressions, switches into and out of direct democracy, placebo tests at other population thresholds, top-coding outliers, and a test of whether the number of missing observations changes at the threshold.
7. Alternative mechanisms
In Section 2, I laid out one possible mechanism that can explain the main findings of the paper. In this section, I examine four other potential mechanisms, and discuss their plausibility in light of several additional results and the political and social circumstances in Spain.
(a) Direct democracy may affect the policy that individuals prefer. For example, the deliberative nature of the meetings may allow citizens to learn by aggregating information, or it may make the drawbacks of some public expenditures more salient.Footnote 33
Although it is not possible to provide a definitive test for this mechanism, I conduct two tests that can be helpful in assessing its plausibility. First, if the effects of direct democracy on policy were driven by citizens' gradual learning from participating in town meetings, we should observe that the effects grow over time as municipalities spend more time under direct democracy. In Appendix F, I show that this is not the case.
Second, I ask if being in a direct-democracy system affects voter behavior in subsequent elections. For example, if the frequent deliberation in town meetings makes individuals more engaged in the democratic process, we should expect that voter turnout increases in elections after a municipality switches into direct democracy.Footnote 34 In addition to being an important question itself, it can indirectly shed light on whether being under direct democracy affects individuals' preferences. The evidence, presented in Appendix F, indicates that direct democracy does not affect voting behavior in subsequent elections.
(b) The differences may be driven by the amount of transfers received from upper-level governments. In particular, if municipalities in direct democracy have more projects financed through these transfers, that could explain why they decide to set lower taxes and fees and spend less. Although some transfers are determined as a smooth function of population and therefore cannot “jump” at the threshold, others are freely determined by provincial and regional governments, so it is in theory possible that they do jump.Footnote 35 If direct-democracy municipalities are better at “lobbying” for these transfers, or if upper-level governments prefer to fund direct-democracy municipalities, then this could lead to more transfers under direct democracy. Although it is not clear why we should expect either of these things to happen, I can directly test this hypothesis in the data, by estimating whether direct democracy has an effect on transfers. In Table A3, I show the results of estimating Equation (1) with the log of Transfers as the dependent variable. All the estimates are insignificant and very close to zero, indicating that there is no effect of direct democracy on transfers. Hence, it is unlikely that this mechanism drives the results.
(c) The differences may arise because direct democracy makes it more difficult to engage in some projects. In particular, suppose that some ambitious and expensive policies require the presence of more “professionalized” political entrepreneurs that might be able to design, monitor, and implement these policies through time. For these types of policies, assemblies are less well-suited than city councils, in which there is a more professional and stable representation as councilors remain in office for (at least) four years. While this mechanism could in principle explain the results, there are two reasons why it is unlikely to do so. First, it is rare in practice that small municipalities in Spain incur in such types of ambitious expenditures. They mostly engage in current expenditures (street cleaning, local festivities) and, while they might spend on infrastructure, it is usually on short-term projects. And second, to (indirectly) test this mechanism, I estimate whether the reduction of public expenditures brought about by direct democracy is larger in the capital (infrastructure) expenditures chapter of the budget, as would be predicted by this mechanism. In Table A4, we see that there is no evidence that direct democracy decreases capital expenditures. This suggests that this mechanism does not drive the results.
(d) Direct democracy may be more prone to elite capture, as was proposed by Hinnerich and Pettersson-Lidbom (Reference Hinnerich and Pettersson-Lidbom2014). An elite who prefers low spending may exert more influence under direct democracy than in a representative democracy setting. These authors provide three arguments that may show that this was a likely situation in the case studied (Sweden at the beginning of the 20th century). First, the lack of political parties in direct democracy made it more difficult for the citizens to solve their collective action problems. Second, the chairman of the town meeting, often a member of the elite, had substantial power to set the agenda. Third, many decisions at meetings were taken by an open vote, and there was the potential for intimidation by the elite.
Although Hinnerich and Pettersson-Lidbom (Reference Hinnerich and Pettersson-Lidbom2014) present compelling evidence in favor of this mechanism in the case that they study, there are three reasons that suggest that it is not the driver of the results in our context. First, their argument is based on a context with a conflict between the landed local elite (e.g., farmers) and citizens (e.g., the agricultural workers) at the time when Sweden was still a poor, mostly agrarian society. Thus, the landed elite would like to keep the old labor-repressive economic system, while the citizens would like to have an economic system based on wage labor. This or similar types of situation are not at all present in contemporary Spain.
Second, it is difficult to see why the elite may want a smaller local government. Gobernado Rebaque (Reference Gobernado Rebaque2003) shows that fiscal policy is only very slightly progressive at the local level; even though some expenditures are progressive, this is almost totally offset by the regressivity of local taxes.Footnote 36 Alternatively, if we think of the elite that would want to capture the meetings as the special interests of the model, then the elite would prefer a larger government, which is not consistent with the results.
Third, it is not obvious how the elite could capture the meetings in the Spanish setting. The first two reasons that Hinnerich and Pettersson-Lidbom (Reference Hinnerich and Pettersson-Lidbom2014) provided for Sweden do not apply: There are political parties underdirect democracy, and the meetings are mostly deliberative, and, therefore, the agenda-setting power of the mayor is limited. The last reason could, in principle, apply, as decisions are taken by an open vote, but the analysis of the meetings by García-Espín (Reference García-Espín2016) does not indicate the presence of intimidation. In fact, García-Espín (Reference García-Espín2016) shows that the elite may have a hard time in imposing their views. Her description is that, when some group of citizens try to “capture” the meetings and impose their views, this generates bitter arguments and, for this reason, citizens shy away from contentious issues.
In sum, although it cannot be completely ruled out, these three reasons suggest that this mechanism does not drive the results.
8. Conclusion
This paper has provided empirical evidence on the effects of direct democracy, in the form of town meetings, on policy. Using a regression discontinuity design in the context of Spanish local governments, I have shown that direct democracy results in smaller governments. Compared with a standard representative-democracy system, direct democracy reduces public spending by around 8 percent. Revenues are reduced by a similar amount, thus leaving budget deficits unchanged.
One important issue is that of the external validity of the findings. Although regression discontinuity designs are well known for providing very credible internal estimates, a recurring question is about the external application of the findings—what the effects would be in other contexts. In this regard, the findings in this paper are probably more directly applicable to settings of (relatively small) town meetings, as opposed to other forms of direct democracy. However, note that the suggested mechanism—that direct-democracy reduces special-interest spending through the unbundling of issues—would also apply to (a) larger assemblies, and (b) other types of direct democracy such as referendums and initiatives. In this sense, it is remarkable that the direction and size of the effects found in this paper coincide with those in a substantial part of the literature on referendums and initiatives, which suggests that the mechanisms at play may not be so different. Nonetheless, more research from other contexts will certainly be helpful to further broaden our knowledge about the effects of direct democracy on policy.
Supplementary Material
The supplementary material for this article can be found at https://doi.org/10.1017/psrm.2018.65
Acknowledgments
I gratefully acknowledge financial support from the Princeton Research Program in Political Economy. I am very thankful to Thomas Fujiwara for his guidance and support. I thank Alfonso Gordaliza for numerous conversations and detailed information on the direct-democracy system, José Miguel Rodríguez for his help in managing and understanding the data, and Samuel Suskind for outstanding research assistance. I also thank two anonymous referees, Jorge Álvarez, Manuel Bagues, Marco Battaglini, Angus Deaton, Bo Honoré, Federico Huneeus, Martín Gonzalez-Eiras, Matias Iaryczower, John Klopfer, Ilyana Kuziemko, John Londregan, Fernanda Márquez-Padilla, Eduardo Morales, Thomas Romer, Vera Troeger, Tom Vogl, and seminar participants in Princeton University, the Spanish Economic Association Symposium, Universidad Carlos III de Madrid, Bank of Spain, Universitat de Barcelona, CaixaBank Research, the Royal Economic Society Conference, and the Science Conference on Direct Democracy-Technischen Universität Dresden for their comments and suggestions. I am solely responsible for any remaining errors.