Over recent years, there has been a quickening of the debate over the nature and causes of climate change, its potential impacts on the livelihoods of people living in Scotland and concern over how Scotland's climate might change in the future (Adaptation Scotland 2011). Following the most recent report (Pachauri & Reisinger Reference Pachauri and Reisinger2007) by the Intergovernmental Panel on Climate Change (IPPC), leading scientific academies across the world re-affirmed their earlier call to world leaders for “prompt action to deal with causes of climate change and cautioned that some climate impacts are inevitable” (Royal Society 2008, p. 1). By contrast, very confused opinions on climate science are reported in attitude and behaviour surveys on the views held by the general public (Davidson et al. Reference Davidson, Martin and Treanor2009; Webb Reference Webb2012 (this volume)), possibly reflecting increasingly sceptical reporting of the debate in much of the UK media (Carvalho & Burgess Reference Carvalho and Burgess2005; Hulme Reference Hulme2009).
Given such a contested framing of the debate, in this paper we summarise some of the key findings in global climate science, and recent trends in Scotland's climate and sea-level, before examining projections of future climate and sea-level change with their potential impacts. We conclude with some reflections on the policy implications of the earlier findings.
1. Global climate change
The Physical Science Basis report by Working Group 1 of the IPPC (Solomon et al. Reference Solomon, Qin, Manning, Chen, Marquis, Averyt, Tignor and Miller2007) remains the most authoritative and widely-accepted statement that climate is changing, that human activities are contributing to the rise in CO2 in the atmosphere, and that this is a major cause of the global warming of the last 50 years.
1.1. Ice cores
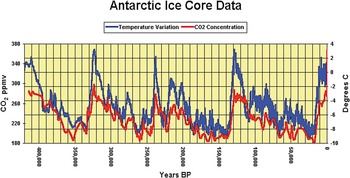
Pivotal to this statement is evidence from Antarctic and Greenland ice cores, which unambiguously demonstrate humankind's contribution to the recent enhanced atmospheric concentrations of greenhouse gases. The 420,000 year-long record (Petit et al. Reference Petit, Jouzel, Reynaud, Barkov, Barnola, Basile, Bender, Chappellaz, Davis, Delaygue, Delmotte, Kotyakov, Legrand, Lipenkov, Lorius, Pepin, Ritz, Salzman and Stievenard1999) from the Vostok ice core, with its familiar ‘saw-tooth’ pattern of temperature fluctuations of about 8°C, reveals four glacial periods, each terminated abruptly by an interglacial, such as the present one which spans the last 10,000 years (Fig. 1). This pattern is replicated in both hemispheres, demonstrating that this record is representative of the globe as a whole, although the variations in average global temperature were nearer to 5°C. The main cause of such large-scale fluctuations in climate is variability in the receipt of solar energy on the Earth's surface as a result of Croll/Milankovitch orbital cycles, on timescales varying from 20,000 to 100,000 years. However, on their own, these solar variations are insufficient to account for the 5°C global temperature change. They need to be amplified by CO2 released from or dissolved in the oceans as the Croll/Milankovitch cycles initiate warming or cooling trends. As a result, CO2 in the atmosphere varies broadly in line with temperature, concentrations falling during glacials and rising in interglacials (Fig. 1). This well-attested link between global temperature and atmospheric CO2 has been widely reported since the 19th Century (Tyndall Reference Tyndall1863; Arrhenius Reference Arrhenius1896).
Temperature and CO2 variations over the last 420,000 years from the initial Vostok Antarctic ice core, showing the amplitude of temperature and CO2 changes during four Ice Age cycles. There is a match between temperature and CO2 variations, although moderated by feedback mechanisms within the Earth's system. Present levels of CO2 are higher than has occurred during the course of most human evolution. Vertical axis (CO2): ppmv=parts per million by volume; temperature in degrees Celsius. Horizontal axis: years BP=years before present. After Petit et al. (Reference Petit, Jouzel, Reynaud, Barkov, Barnola, Basile, Bender, Chappellaz, Davis, Delaygue, Delmotte, Kotyakov, Legrand, Lipenkov, Lorius, Pepin, Ritz, Salzman and Stievenard1999)

Because solar cycles and the relationship between CO2 and temperature are both involved, the precise pattern of global temperature fluctuations is complex. During warming parts of the record, the rise in temperature leads that of CO2 by about 800 years. One reason this occurs is because when Croll/Milankovitch warming is initiated, the oceans take several centuries to respond fully and only as they warm is CO2 released which, in turn, warms the rest of the Earth. In such a complex coupled atmosphere–ocean–land system, it is to be expected that there will be leads and lags between different components and feedback effects amplifying or suppressing changes. Finally, the ice core records demonstrate that September 2011 levels of CO2 (389 ppmv; National Oceanic and Atmospheric Administration 2011) are higher than in previous interglacials.
These ice core results raise two significant points. First, current levels of atmospheric CO2 are higher than they have been for 740,000 years (EPICA Community Members 2004), which means that we face CO2 levels never experienced by humankind before. Secondly, some short-term fluctuations begin and end abruptly. Thus, the North Greenland Ice Core Project includes two warming episodes with temperature fluctuations of 2–4°C over 1–3 years at the beginning of the present interglacial (Steffensen et al. Reference Steffensen, Andersen, Bigler, Clausen, Dahl-Jensen, Fischer, Goto-Azuma, Hansson, Johnsen, Jouzel, Masson-Delmotte, Popp, Rasmussen, Röthlisberger, Ruth, Stauffer, Siggaard-Andersen, Sveinbjörnsdóttir, Svensson and White2008). Such striking changes, often regional in extent, provide evidence of potential tipping points activated by the climate system crossing a key threshold (Lenton et al. Reference Lenton, Held, Kriegler, Hall, Lucht, Rahmstorf and Schellnhuber2008). However, at present, the nature and level of such thresholds is poorly understood and current climate change models struggle to incorporate them.
1.2. Direct measurement of CO2 and global temperatures
Annual measurements of atmospheric CO2 in Hawaii since 1958 (Sugden et al. Reference Sugden, Webb and Kerr2012 (this volume), fig. 1a) show a year-on-year rise, averaging 2.0 ppmv per year over the period 2005–10 (National Oceanic and Atmospheric Administration 2011). Much of the rise in CO2 can be directly linked to human activity, with isotope analysis revealing that the carbon source is from fossil fuels. Based on statistics of production and deforestation (Le Quéré et al. Reference Le Quéré, Raupach, Canadell, Marland, Bopp, Ciais, Conway, Doney, Feely, Foster, Friedlingstein, Gurney, Houghton, House, Huntingford, Levy, Lomas, Majkut, Metzl, Ometto, Peters, Prentice, Randerson, Running, Sarmiento, Schuster, Sitch, Takahashi, Viovy, van der Werf and Woodward2009), the rising trend since 1960 is mainly caused by burning fossil fuels and cement manufacture, with the contribution of land-use change fluctuating between decades (Sugden et al. Reference Sugden, Webb and Kerr2012 (this volume), fig. 1b). Given the rising trend of both CO2 in the atmosphere and the production of CO2, it is difficult to escape the conclusion that human activity is involved in changing the recent composition of the atmosphere.
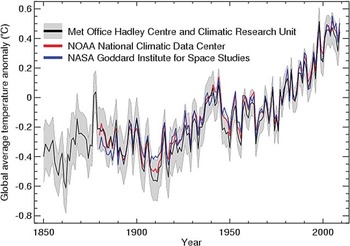
Measurements of global temperature, based on observations at numerous sites and assembled by different organisations, show an overall increase since 1850 most sustained in the last half century (Fig. 2; Meteorological Office 2011). The major oscillations that punctuate this rising trend, on time scales of 5–11 years, are probably ocean driven and linked to ocean/atmosphere phenomena such as the El Niño Southern Oscillation.
The close agreement between three different temperature records of global temperature rise from the UK Meteorological Office (HadCRUT3), NASA (GISS) and NOAA (NCDC). Also shown is the 95% confidence level. Such records are assembled from data from 5,000 land stations and 1200 freely floating buoys, ships and moored buoys.

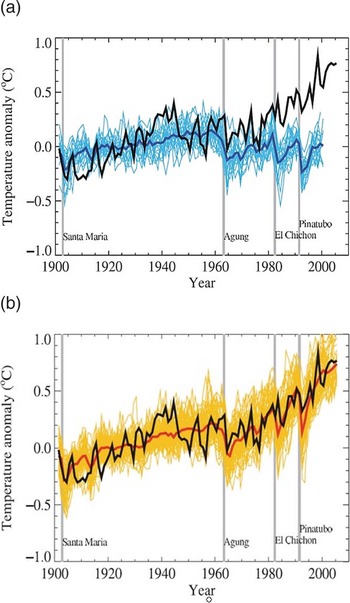
The nature of the link between the rise in atmospheric CO2 and temperature is well illustrated by comparing the observations of climate change in the 20th Century with predictions based on an ensemble of theoretical models (Hegerl et al. Reference Hegerl, Zwiers, Branconnot, Gillet, Luo, Marengo Orsini, Nicholls, Penner, Stott, Solomon, Qin, Manning, Chen, Marquis, Averyt, Tignor and Miller2007). In one scenario, the models are forced by natural factors alone, such as insolation (solar energy) and volcanic eruptions (affecting the transparency of the atmosphere); in the other, the effect of rising CO2 is also included. The range of predictions of the different models is shown along with the mean trend (Fig. 3). In the uppermost graph (Fig. 3a) the models driven by natural factors match the trend of the early 20th Century well, but after 1960 they diverge from observations and predict a decline. However, global temperature continued to rise. In the lower graph (Fig. 3b), the rise in CO2 is also included in the models and in this case the predictions closely simulate the observed rise in global temperature to the present day. The important implication is that both natural forcing and human forcing are necessary to explain the rise in global temperature in the last half century. This match between models and observations suggests considerable progress in understanding how the world's climate works. It implies that human activities are involved in the rise in CO2 and the consequent warming of the atmosphere.
Observations of global temperature rise and theory agree and demonstrate the role of CO2 in raising global temperatures: (a) the observed rise in global temperature since 1900 (black) compared with the range of different model predictions of climate change due to natural variations, including insolation and volcanic eruptions (blue). Natural forces predicted a decline in global temperature since 1960, whereas temperature has continued to climb; (b) the same comparison, but with the effect of rising atmospheric CO2 also taken into account (red). In this case the models simulate the rise in observed temperatures closely. (Hegerl et al.

1.3. Credibility of climate change science
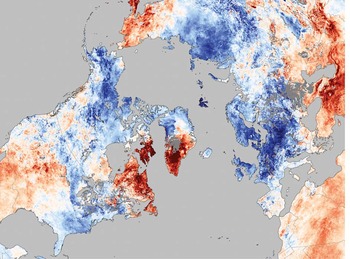
The confused state of public understanding of climate science has recently been exacerbated by the media's reporting of two high-profile episodes: the hacked emails at the University of East Anglia in 2009 and an error in the IPPC 2007 Report on future rates of glacier retreat in the Himalayas. In light of these episodes, it is important to stress that the scientific basis for accepting anthropogenic climate change has survived unprecedented scrutiny in 2009–2010. Reviews of the case of the hacked emails by scientists from the Climate Research Unit at the University of East Anglia by the House of Commons Science and Technology Committee (2009), the Independent Climate Change Emails Review (Russell Reference Russell2010) and an International Science Assessment Panel (Oxburgh Reference Oxburgh2010) revealed that the data showing trends in climate change remain substantiated. Indeed, as already noted earlier, they are duplicated by other organisations (Fig. 2). The incorrect statement about Himalayan glaciers in the IPCC 2007 Report was corrected by peers within the scientific community and it remains a fact that the glaciers are in retreat (Lemke et al. Reference Lemke, Ren, Alley, Allison, Carrasco, Flato, Fujii, Kaser, Mote, Thomas, Zhang, Solomon, Qin, Manning, Chen, Marquis, Averyt, Tignor and Miller2007). Finally, the cold winters of 2009/10 and 2010/11 in Scotland, northwest Europe and northeastern USA, which rekindled doubts about the science case, occurred whilst the Arctic, and indeed the rest of the world, experienced warmer than usual temperatures (see NASA 2011b, fig. 8).
The overall conclusion to be drawn from climate science is that the rise in atmospheric CO2 to unprecedented levels in human experience presents risks for the world. The strongest conclusion with minimal uncertainty is that the rise in CO2 will cause global warming, and that it is related to human activity. Further conclusions such as the rate of change, the probability or otherwise of breaching a threshold of abrupt change, and the way climate change will play out on a regional scale, involve greater uncertainty. The nub of the latter problem is that science has made good progress in understanding how the climate system works and in identifying the complexity of factors that are involved. However, science is not yet able to predict the future behaviour of a complex and chaotic system like the atmosphere with sufficient confidence and resolution to be convincing to wider society. A further problem is that, whereas the science case is persuasive at a global scale, individuals are influenced by climate and weather at the local scale, where the models are least certain. Both these difficulties need to be borne in mind in discussion about the causes of climate change.
How society chooses to use the outputs from climate science to frame mitigation and adaptation strategies takes the debate well beyond the confines of physical science. Value judgements by policy makers, stakeholders and civil society (Royal Society of Edinburgh 2011) become involved as the science becomes socially constructed. This in turn poses a new set of challenges for, as Hulme (Reference Hulme2009, p. xxviii) has explored at length, “not only is climate change altering our physical world, but the idea of climate change is altering our social worlds”.
2. Recent trends in the climate of Scotland
As a result of its location in the northern temperate belt and on the northwestern margins of Europe, Scotland's day-to-day weather is highly variable. However, when averaged over months and years, this highly variable weather gives rise to a maritime climate that avoids the extremes in temperature, rainfall and seasonality found in more continental climates. Of course, extremes such as the prolonged sub-zero temperatures experienced in the winters of 2009/10 and 2010/11 do occur, but these average out to give Scotland a mean temperature of 4–9°C and a mean annual rainfall of between 600 mm and 3000 mm (Barnett et al. Reference Barnett, Hossell, Perry, Procter and Hughes2006b).
Alongside many other parts of the world, Scotland's climate has been subject to recent latitudinal warming trends and changes in rainfall, reflecting the frequency with which storms are driven in from the Atlantic (Trenberth et al. Reference Trenberth, Jones, Ambenje, Bojariu, Easterling, Klein Tank, Parker, Rahimzadeh, Renwick, Rusticucci, Soden, Zhai, Solomon, Qin, Manning, Chen, Marquis, Averyt, Tignor and Miller2007) and the long-term behaviour of the pressure difference between Iceland and either Gibraltar, Lisbon or the Azores (the North Atlantic Oscillation, NOA). When this registers a strong positive anomaly with respect to its long-term average, zonal or westerly circulation dominates with increased rainfall in the north and west of Scotland. When this pressure difference weakens, generating a negative anomaly, high pressure has often built over Europe, with Scotland experiencing azonal circulation (winds typically from the north and east), resulting in colder and drier conditions (Hurrell Reference Hurrell1995). During the last 30 years or so, positive anomalies have steadily increased from the early 1960s and peaked in the early 1990s, since when they have steadily declined to slightly above average in 2004 and fell to the lowest value in 190 years in the winter of 2009/2010 (Osborn Reference Osborn2006, Reference Osborn2011). The trends in rainfall reported below mirror these changes in atmospheric circulation and Figure 8 records strongly azonal circulation over much of northwest Europe in December 2010.
Given that weather can be highly variable over timescales spanning days to years, it is often difficult to separate out climate change from natural variability. The most recent and authoritative attempt to characterise recent trends in Scotland's climate is A handbook of climate trends cross Scotland (Barnett et al. Reference Barnett, Hossell, Perry, Procter and Hughes2006b), in part updated by The climate of the UK and recent trends (Jenkins et al. Reference Jenkins, Perry and Prior2008) and Marine and coastal projections (Lowe et al. Reference Lowe, Howard, Pardaens, Tinker, Holt, Wakelin, Milne, Leake, Wolf, Horsburgh, Reeder, Jenkins, Ridley, Dye and Bradley2009), both outputs of Defra's UK Climate Projections project (Brown et al. Reference Brown, Clark, Collins, Harris, Kendon, Betts, Brown, Howard, Humphrey, McCarthy, McDonald, Stephens, Wallace, Warren, Wilby and Wood2009; Murphy et al. Reference Murphy, Sexton, Jenkins, Boorman, Booth, Brown, Clark, Collins, Harris, Kendon, Betts, Brown, Howard, Humphrey, McCarthy, McDonald, Stephens, Wallace, Warren, Wilby and Wood2009). Recent trends within Scotland's climate reported below must, of course, be seen in relation to planet-wide patterns in which global temperatures have risen by 0.8°C since the late 19th Century and sea levels have risen by 1.8 mm per year since 1961 and by around 3 mm per year since 1993 (Solomon et al. Reference Solomon, Qin, Manning, Chen, Marquis, Averyt, Tignor and Miller2007).
2.1. Temperature
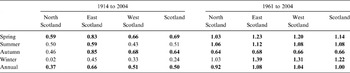
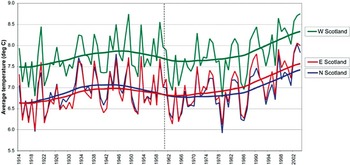
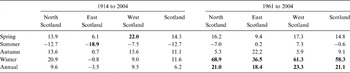
Since 1914, the Scottish regional temperature curve has broadly followed global trends, with an increase in the first half of the century, followed by a decrease in the 1950s and 1960s, and then a steady increase to 2004 (Fig. 4). For the purposes of the report by Barnett et al. (Reference Barnett, Hossell, Perry, Procter and Hughes2006b), Scotland is divided into three regions: west, east and north (see Fig. 11 for boundaries). Throughout this period, west Scotland has been consistently milder than the other two regions, but all three regions report marked year-on-year variation. When broken down by season and by region, the trends become more complex, with east Scotland's average temperature rising from approximately 6.7°C to 7.5°C and west Scotland's from 7.8°C to 8.3°C over the period 1914–2004 (Table 1). These statistics confirm the significance of the rising temperature trends revealed by 30-year moving averages in all three regions in the period 1961–2004 (Fig. 4). Analysis of the longer average annual temperature record for Scotland for the period 1800–2006 confirms the above findings and emphasises the significance of the upward trend since the early 1970s (Jenkins et al. Reference Jenkins, Perry and Prior2008). This increase in temperature has resulted in a lengthening of the growing season across Scotland over the period 1961–2004 by 33 days (Barnett et al. Reference Barnett, Hossell, Perry, Procter and Hughes2006b), which is already impacting on agriculture both in terms of choice of crops and their seasonal management (Newton et al. Reference Newton, Johnson, Lyon, Hopkins and Gregory2008).
Changes in average temperature in °C 1914–2004 (left) and 1961–2004 (right). Values in bold show a 95% confidence (statistically) that the change is part of a measureable trend (Barnett et al. Reference Barnett, Hossell, Perry, Procter and Hughes2006b)

The average temperature (in °C) each year for Scottish regions 1914–2004, with smoothed curves showing a running average across a record with marked year-on-year variation. The vertical dashed line marks 1961.

2.2. Rainfall and snow
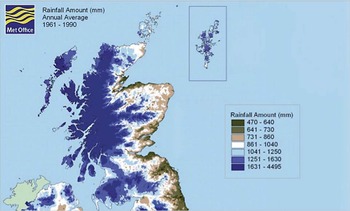
Scotland's rainfall displays a strong spatial pattern, with the highest annual values locally exceeding 3000 mm in the mountainous areas of the west, declining rapidly to around 500–800 mm in the south and east (Fig. 5). The most remarkable rainfall trend since 1961 has been the significant increase in winter rainfall of 68.9% in west Scotland and 21.1% for the whole of Scotland (Table 2), equivalent in the latter to an increase of 240 mm of rainfall a year. However, for summer rainfall there has been little change, apart from a slight increase in west Scotland and a similar decrease in north Scotland (neither of which is significant).
Annual rainfall Scotland: 1961–90

Changes in average rainfall totals (as %) 1961–2004 and 1914–2004. Values in bold show a 95% confidence (statistically) that the change is part of a measureable trend (Barnett et al. Reference Barnett, Hossell, Perry, Procter and Hughes2006b)

Extending the record back to 1914 highlights the potential pitfalls of trend analysis applied to short records (Fig. 6). As is evident from Table 2, many of the 1914–2004 trends are less well-established, a pattern already noted in an earlier assessment of long-term trends in Scottish annual rainfall (Werritty Reference Werritty2002). In part, this reflects the high level of statistical significance set: in this case p<0.05 using the non-parametric Mann–Kendall tau test (Barnett et al. Reference Barnett, Hossell, Perry, Procter and Hughes2006a). Relaxing this threshold to a p<0.1 probability would almost certainly strengthen the 1914–2004 trends. Given this qualification, the only significant long terms trends are the 19% reduction in summer rainfall in east Scotland and the 22% increase in spring rainfall in west Scotland. The increases in winter rainfall in both west and north Scotland, whilst still apparent, are much weaker than over the period 1961–2004. The conclusion drawn by Barnett et al. (Reference Barnett, Hossell, Perry, Procter and Hughes2006a, p. 25) is suitably cautious – “It is not possible to say definitively at this time whether there is a trend of long-term drying in east Scotland and wetting over the rest of Scotland”. These more equivocal trends over the long term do not necessarily undermine the robust trends over the period 1961–2004. But they do highlight the need to locate short-term trends within longer-term natural variability, and to be clear on specifying appropriate probability levels and the risk of getting the trend wrong.
Rainfall total in mm for each year for Scottish regions 1914–2000, with smoothed curves to show a running average across a record with marked year-on-year variation. The vertical dashed line marks 1961

The strong increase in rainfall, especially pronounced in west and north Scotland from the early 1960s to the early 1990s, mirrors the period during which the NAO index was strongly positive, bringing frequent rain-bearing storms from the Atlantic. The reduction in rainfall in these two regions since the early 1990s reflects a reduction in the NAO index, bringing more rain-bearing winds from the north and east and resulting in a small increase in rainfall to east Scotland (Fig. 6).
However, turning to changes in heavy rainfall (number of days with more than 10 mm) over the period 1961–2004, there has been a consistent and significant increase in the number of days with heavy rainfall across all Scottish regions in the winter (Table 3). Both north and west Scotland over this period register an eight-day increase for days of heavy winter rain. The spatial pattern in changes in the number of heavy rainfall days is broadly similar to that for total rainfall across Scotland (Fig. 5), with a strong west–east gradient in the winter months. However, in reporting this finding, Barnett et al. (Reference Barnett, Hossell, Perry, Procter and Hughes2006a, p. 28) again add a cautionary note: “this would imply that although recent winters have seen significantly more days of heavy rainfall, in a longer time series of data the change may not be significant, given that the longer record also shows no significant increase in winter rainfall since 1914. This shows that interpreting trends in relatively short records must be done with caution”; advice that should be heeded.
Changes in days of heavy rain (equal to or more than 10 mm) in days, 1961–2004. Values in bold show a 95% confidence (statistically) that the change is part of a measureable trend (Barnett et al. Reference Barnett, Hossell, Perry, Procter and Hughes2006b)

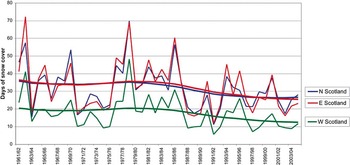
Recent changes in snow cover over Scotland are even more difficult to assess, reflecting uneven cover of high altitude sites and gaps in many of the records. Noting these qualifications, Harrison et al. (Reference Harrison, Winterbottom and Johnson2001) reported no significant trend in the number of days with snow lying over the period 1960/61 to 1999/2000. However, from the late 1970s a significant decrease was found in the number of days with snow lying between 100 m and 400 m, at an average rate of 12 days per decade. Using a slightly longer record and a different methodology, Barnett et al. (Reference Barnett, Hossell, Perry, Procter and Hughes2006b) updated these findings and concluded that the number of days of snow cover over the period 1961/62 to 2004/05 had reduced in all seasons and across the whole of Scotland (Fig. 7), significantly so for north and west Scotland and for Scotland as a whole (Table 4). But set against this overall decline is a marked year-on-year variation, with extremes of 72 and 12 days of snow cover (1962/63 and 1991/92 respectively) in east Scotland. The winter decreases of more than 25% are equivalent to the loss of seven snow days. Significant decreases in spring and autumn point to a reduction in the length of the snow season.
Days of snow cover each year for Scottish regions, from 1961/62 to 2004/05, with smoothed curves showing a running average

Changes in days of snow cover (as a percentage), from 1961/62 to 2004/05. Statistically significant trends are shown in bold (significant at the p<0.05 level), (Barnett et al. Reference Barnett, Hossell, Perry, Procter and Hughes2006b).

2.3. Cold winters across Europe
The winters of 2005/06, 2009/10 and 2010/11 included severe cold spells that appear to add weight to the arguments of the climate sceptics and contradict the above summary of recent trends in temperature and snowfall. Once such cold spell was that in December 2010, when Greenland and the eastern Canadian Arctic were unusually warm and Scotland usually cold (Fig. 8). When, as on this occasion, the jet stream in the upper atmosphere displays a highly sinuous pattern, a blocking anticyclone develops across northern Europe, deflecting the normal sequence of Atlantic cyclonic storms around the British Isles. During such a period, the westerly zonal flow of warm, wet maritime air is replaced by a strongly azonal easterly and northerly flow of cold, dry Continental air, resulting in temperatures below 0°C.
Temperature anomalies for 3–10 December 2010 (red up to 15°C warmer and blue up to 15°C colder than usual).

It is important to note that NASA (2011a) also reported that 2010 tied with 2005 as globally the warmest years on record. Accordingly, the recent cold winters across Europe do not conflict with global warming, but rather point to the importance of regional variability.
2.4. Wind and gales
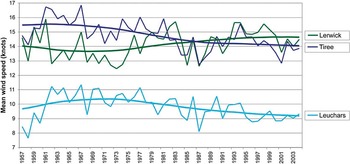
Data on winds and gales are only reported at few locations across Scotland, making the resultant data much less representative than those for temperature and rainfall. With these reservations, over the last 40 years there has been a weak trend of decreasing average wind speed for Leuchars and Tiree and an increase for Lerwick (Barnett et al. Reference Barnett, Hossell, Perry, Procter and Hughes2006b; Fig. 9). Unlike the findings for wind speed, there are no clear trends in the number of days with gales. This lack of trend is confirmed in a decadal analysis of storminess around the UK. Whereas the 1920s and 1990s recorded more than 12 severe storms per decade, this was reduced to less than eight severe storms in all the intevening decades (Jenkins et al. Reference Jenkins, Perry and Prior2008). This reduction in storminess is independently confirmed by a decline in significant wave heights in the North Atlantic over the last 30 years.
Average wind speed (in knots) for each year for three Scottish stations – Lerwick, Tiree and Leuchars (values estimated from Turnhouse before 1969) – from 1957 to 2004, with smoothed curves showing a running average

2.5. Summary
The key findings in terms of recent trends in Scotland's climate are:
• increase in average temperature since 1914 of 0.5°C, with north Scotland warming at a slower rate;
• average spring, summer and winter temperatures increased by more than 1°C since 1961;
• average summer rainfall little changed since 1961, apart from north and west Scotland where up to a 45% reduction in some areas;
• frequency of heavy rainfalls increased since 1961, especially in north and west Scotland;
• snow season shortened since 1961, especially in north and west Scotland, number of days with frost reduced by 25% and growing season lengthened;
• average wind speed slightly declined since 1957 for inland sites and increased in island sites;
• no clear trend in number of days with gales since 1957 and the high frequency of severe storms in the 1990s not consistent with earlier decades other than the 1920s.
As already noted, the very high inter-annual and decadal variability in climate data sets make it difficult to distinguish long-term trends from natural variation. On the one hand, short-terms trends (such as the marked recent increase in rainfall in west Scotland) are already having an impact on society in terms of changing flood risk. But on the other hand, natural variation and the incidence of high and low extremes must be taken into account as discrete elements within climatic series, alongside trends and moving averages. Each time a temperature or rainfall record is broken, it reminds us of what is physically possible in terms of Scotland's weather and, in terms of a risk assessment, due regard should be given to such extremes. Policy makers should bear in mind the possibility of these extreme values alongside their necessary focus on trend lines and moving averages.
3. Recent trends in sea-level rise
Since 1961, the overall global rate of sea-level rise during the 20th Century has been around 1.8 mm yr–1, increasing to 3.1 mm yr–1 since 1992 (Bindoff & Willebrand Reference Bindoff, Willebrand, Solomon, Qin, Manning, Chen, Marquis, Averyt, Tignor and Miller2007). Following melting of the Loch Lomond Stadial Icesheet centred on Loch Lomond and Rannoch Moor (11.7 k calibrated years BP; Golledge et al. Reference Golledge, Fabel, Everest, Freeman and Binnie2007), isostatic recovery of Scotland's land mass has moderated this rate around Scotland's coasts (Shennan et al. Reference Shennan, Milne and Bradley2009), with an average uplift between 1000 BP and AD 1950 of 1.3 mm yr–1 (Millport, upper Firth of Clyde), declining to 0.7 mm yr–1 (Aberdeen) and 0.2 mm yr–1 (Kirkwall) and subsidence at Lerwick (−0.9 mm yr–1). The resulting map reports uplift of >1.0 mm yr–1 for much of the Grampians and Central Lowlands, 0.5–1.0 mm yr–1 for the northeast, Sutherland and Caithness, the Borders and Dumfries and Galloway, and 0.0–0.5 mm yr–1 for the Outer Hebrides and Orkney. Recent direct measurements of vertical land movement using absolute gravity and continuous GPS data (Bingley et al. Reference Bingley, Teferle, Orliac, Dodson, Williams, Blackman, Baker, Riedmann, Haynes, Aldiss, Burke, Chacksfield and Tragheim2007, table 5.10) imply almost no uplift at Aberdeen (0.11 mm yr–1±0.68) and subsidence at Lerwick (−0.63 yr–1±0.82). These updated long-term and short-term estimates of relative land movement are included in UKCP09's Marine and coastal projections report (Lowe et al. Reference Lowe, Howard, Pardaens, Tinker, Holt, Wakelin, Milne, Leake, Wolf, Horsburgh, Reeder, Jenkins, Ridley, Dye and Bradley2009), resulting in much lower values than previous estimates reported in UKCIP02 (Hulme et al. Reference Hulme, Jenkins, Lu, Turnpenny, Mitchell, Jones, Lowe, Murphy, Hassell, Boorman, McDonald and Hill2002) and Ball et al. (Reference Ball, Werritty, Duck, Edwards, Booth and Black2008), which relied on earlier reconstructions of Holocene rates (Shennan & Horton Reference Shennan and Horton2002).
Present-day relative sea-level rise (RSL) is the sum of isostatic uplift and the regional estimate of eustatic change in UK waters. Tidal records provide the only reliable instrumental record for determining RSL over decadal timescales, with Woodworth et al. (Reference Woodworth, Teferle, Bingley, Shennan and Williams2009, table 1) reporting RSLs of 1.20 mm yr–1±0.53 (Millport, 1969–2006), 0.87 mm yr–1±0.1 (Aberdeen 1901–2006) and 0.47 mm yr–1±0.31 (Dunbar 1914–50) for the longest and most complete records. Ball et al. (Reference Ball, Werritty, Duck, Edwards, Booth and Black2008) sub-divided the Aberdeen record (1946–2007) into a period of minimal change (1946–80) followed by 2 mm yr–1 from 1980, giving an overall average of 1.2 mm yr–1. Trends derived from other Scottish tidal gauges are problematic, due to short or incomplete records. Despite this, Rennie & Hansom (Reference Rennie and Hansom2011) have controversially derived RSL estimates for 11 sites over the period 1992–2007 which range from 6.03 mm yr–1±2.15 (Aberdeen) to 2.98 mm yr–1±4.90 (Fort William).
In addition to the tidal cycle, water levels around the coast can also be affected by surges (initiated by storms) which produce significant elevation of levels at the head of an estuary, and by wave height. There is no evidence over the recent past that surges have become more frequent in response to changes in storm frequency (Dawson et al. Reference Dawson, Hickey, McKenna and Foster1997), or that wave heights have increased as a result of changes in storminess (Ball et al. Reference Ball, Werritty, Duck, Edwards, Booth and Black2008). Even after incorporating an improved model of surge risk to the end of the 21st Century (Lowe et al. Reference Lowe, Howard, Pardaens, Tinker, Holt, Wakelin, Milne, Leake, Wolf, Horsburgh, Reeder, Jenkins, Ridley, Dye and Bradley2009), Dixon & Tawn's (Reference Dixon and Tawn1997) recommendation is still current; only trends in sea-level rise need to be taken into account when assessing future coastal flood risk.
4. Future climates
Defra's 2009 UK Climate Projections programme (UKCP09) is the latest in a series dating back to 1998. One output from UKCP09, based on the Met Office regional climate model HadCM3, provides probabilistic projections of a range of climate variables for Scotland over seven overlapping 30-year time periods spanning 2010–2099 on a 25 km grid across the UK (Murphy et al. Reference Murphy, Sexton, Jenkins, Boorman, Booth, Brown, Clark, Collins, Harris, Kendon, Betts, Brown, Howard, Humphrey, McCarthy, McDonald, Stephens, Wallace, Warren, Wilby and Wood2009). The projections are based on three of the IPCC's (2000) Special Report on Emissions Scenarios – A1FI (High), A1B (Medium) and B1 (Low) – which enable the impacts of different emission pathways on climate to be assessed. UKCPO9 is the first UK report that attaches probabilities to different climate change outcomes based on ensembles of the HadCM3 model plus climate models from other centres around the world. These ensembles enable major known uncertainties arising from the representation of climate processes, and the effects of natural internal variability of the climate system, to be incorporated in the projections. As with previous models of this kind, the emission scenarios are each potential futures and not a prediction to which probabilities can be attached. It is also important to note that, as with other global circulation models, HadCM3 cannot provide robust predictions of future climate at regional levels finer than the 25 km grid and a temporal resolution of less than 24 hours. However, sub-daily estimates can be obtained via a Weather Generator (Jones et al. Reference Jones, Kilsby, Harpham, Glenis and Burton2009), also available from UKCP09.
4.1. Temperature, rainfall, wind speed and snow fall
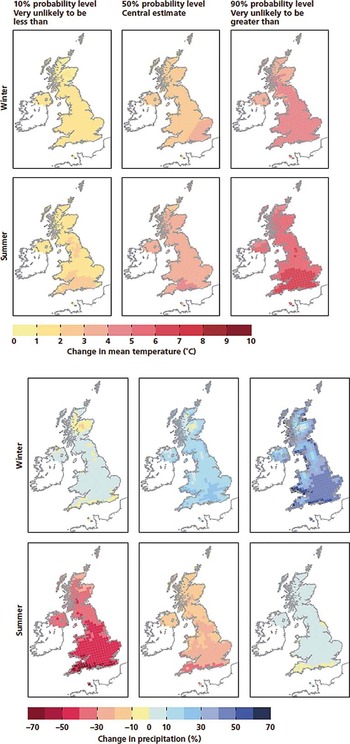
A representative output from the UKCP09 Climate change projections report (Murphy et al. Reference Murphy, Sexton, Jenkins, Boorman, Booth, Brown, Clark, Collins, Harris, Kendon, Betts, Brown, Howard, Humphrey, McCarthy, McDonald, Stephens, Wallace, Warren, Wilby and Wood2009) under the Medium emissions scenario for the 2080s is reproduced in Figure 10. The central estimate for mean winter temperature is +2°C for the whole of Scotland and +3°C for summer temperatures across the whole of Scotland except the far north. For most of Scotland, the central estimate for winter rainfall is +0–10%, rising to +10–20% along the coasts, but −10% in the central Grampians. In the summer, rainfall will generally be lower, at −10% and, in a few places at least, −20%. Predictions at the 10% (‘very unlikely to be less than’) and 90% (‘very unlikely to be more than’) levels quantify the uncertainties associated with the central estimate. The change in direction of summer rainfall at the 90% level – an increase of +10% in contrast with a decrease of −10% at the 50% probability level – is especially noteworthy. In sum, by the 2080s, Scotland is set on average to become much wetter in the winters (especially in western coastal areas), slightly drier in the summers and warmer by +2°C in the winter and +3°C in the summer. But in any risk assessment, due regard should also be given to the possible extremes at the 10% and 90% probability levels.
10%, 50% and 90% probability levels of changes to the average daily mean temperature (°C) of the winter (first row of maps) and summer (second row of maps), and annual mean rainfall (mm) in winter (third row of maps) and summer (fourth row of maps) by the 2080s under the Medium emissions scenario

The report Adapting to Climate Change: A Guide for Businesses in Scotland (SCCIP 2010) provides a very useful regional summary derived from UKCP09 outputs. Scotland is divided into three regions for which, under the Medium emissions scenario, by the 2050s mean temperatures and mean winter rainfall increases are projected to be highest in the west and mean summer rainfall decreases highest in the east (Fig. 11). The ranges based on 10% and 90% probabilities are also shown.
Regional estimates of future temperature and rainfall across Scotland 2050 under the Medium emissions scenario. 10% probability (very unlikely to be less than), mean (50% probability – central value), 90% probability (very unlikely to be more than). Based on Scottish Climate Change Impacts Partnership report. (SCCIP 2010).

Other climatic variables with especially significant impacts include maximum summer daily temperature, winter wind speed and snow fall. By the 2080s, under the Medium emissions scenario, it is very unlikely that the maximum daily summer temperate in Scotland will be less than +1.5°C, and very unlikely more than +7°C (90%). Winter wind speed is predicted to fall slightly when compared with 1961–90; counter to the recent trend of a slight increase for inland sites. Snow fall is predicted to fall dramatically by more than 60% across the whole of Scotland and by more than 80% across most of Scotland. This accelerates the recent trend of a steady reduction in snow fall but, as recent winters have demonstrated, should not rule out individual years with markedly higher snow falls.
4.2. Future sea levels
UKCP09's Marine and coastal projections report (Lowe et al. Reference Lowe, Howard, Pardaens, Tinker, Holt, Wakelin, Milne, Leake, Wolf, Horsburgh, Reeder, Jenkins, Ridley, Dye and Bradley2009) provides the most authoritative predictions of changes in sea-level, surge heights and wave heights around the UK during the 21st Century. In terms of sea-level rise by 2095, the latest estimate for the whole of the UK based on the Medium emissions scenario reveals values for Scotland which, as a result of continued isostatic recovery, are much lower than for the rest of the UK (Fig. 12). Sea-level rise of only 23–30 cm is projected at the centre of an ellipse centred over Rannoch Moor (close to the area of maximum uplift). Radiating away from this centre point, the Clyde estuary reports values of 25–30 cm, increasing to 30–35 cm for Inverness, Aberdeen, Edinburgh and Dumfries, and to 40–45 cm for the Outer Hebrides and the Orkney Isles. Shetland, reflecting its recent subsidence, reports the highest values of 50–55 cm, akin to those for much of the UK. Operating outside this suite of models, and in response to user demand, Lowe et al. (Reference Lowe, Howard, Pardaens, Tinker, Holt, Wakelin, Milne, Leake, Wolf, Horsburgh, Reeder, Jenkins, Ridley, Dye and Bradley2009) have also produced an H++ model based on the worst-case predictions of ice sheet melting (mainly Greenland) in the 21st Century, which predicts sea-level rise in the range 80–190 cm. However, this prediction is currently seen as extremely unlikely.
Relative sea level change (cm) around the UK by 2095 based on absolute sea level change, adjusted for vertical land movement under the Medium emissions scenario.

Post-dating the Marine and coastal projections report (Lowe et al. Reference Lowe, Howard, Pardaens, Tinker, Holt, Wakelin, Milne, Leake, Wolf, Horsburgh, Reeder, Jenkins, Ridley, Dye and Bradley2009) and qualifying some of its RSL findings, Rennie & Hansom (Reference Rennie and Hansom2011, p. 201) claim that current “projections based on Low or Medium greenhouse gas Emission Scenarios as a planning guide are underestimates and have already been overtaken by current rates of RSL”. However, their conclusion that “a High Emissions Scenario should be used as the minimum baseline for coastal planning”, relies heavily on extrapolating findings from very short tidal gauge records which many will question (Dawson et al. Reference Dawson, Powell, Duck and McGlashan2012).
As already noted, modelling future surge risk (Lowe et al. Reference Lowe, Howard, Pardaens, Tinker, Holt, Wakelin, Milne, Leake, Wolf, Horsburgh, Reeder, Jenkins, Ridley, Dye and Bradley2009) suggests only a slight increase well within the range of natural variability. Future wave energy and wave heights may increase in spring and autumn, but still water levels could decline in winter, resulting in lower wave heights near the coast. These findings have been incorporated into an updated version of the SNIFFER 2008 report Coastal Flooding in Scotland: A Scoping Study (see Ball Reference Ball2009). Given minimal change in surge behaviour and wave heights, the dominant determinant for future coastal flood risk in Scotland will be sea level rise.
4.3. Commentary on trend analysis and the use of UKCP09 climate models
The uncertainties embedded in the climate change projections are integral to their use. By providing the projections in a probabilistic format, UKCP09 both acknowledges the levels of uncertainty surrounding each central estimate and, for the first time, provides policy makers and stakeholders with better tools for managing the associated risks. Accordingly, stakeholders should use the full range of projections provided and not default to the 50% probability level which is directly comparable to previous climate change projections with which they will already be familiar (Hulme & Jenkins Reference Hulme and Jenkins1998; Hulme et al. Reference Hulme, Jenkins, Lu, Turnpenny, Mitchell, Jones, Lowe, Murphy, Hassell, Boorman, McDonald and Hill2002). Estimates of extreme events are especially important, as often they have impacts disproportionate to their frequency. Thus farmers concerned about drought should focus on 10% seasonal rainfall probabilities; whereas engineers concerned about flooding will use the 90% probabilities (Fig. 10), coupled with more localised Weather Generator outputs. Each organisation making use of these projections should determine what level of risk is appropriate for their activities and operations.
The projections in UKCP09 and, in particular, those of wetter winters and increases in the frequency and intensity of rainfall, confirm the short-term trends in Scottish rainfall since 1961. This has lead many policy makers to assume that, in the short to medium term, there will be an enhanced flood risk across Scotland (Scottish Government 2011). But until recently, most climate scientists have been reluctant to attribute any individual rainfall event and associated flooding to climate change. In part, this reflects high levels of natural variability in most rainfall records, plus the large uncertainty in the rainfall component of climate models. But this view is now being challenged. Thus Pall et al. (Reference Pall, Aina, Stone, Stott, Nozawa, Arno, Hilberts and Myers2011, p. 382), reporting the findings from a seasonal–forecast–resolution climate model, concluded that “it is very likely that global anthropogenic greenhouse gas emissions substantially increased the risk of flood occurrence in England and Wales in Autumn 2000”. This claim has been endorsed by Allan (Reference Allan2011), who also commends the study by Min et al. (Reference Min, Zhang, Zweiers and Hegerl2011), who found that increased rainfall intensity across two-thirds of the Northern Hemisphere in the latter half of the 20th Century cannot be attributed to natural variability. It is too early to claim a robust link between climate change, extreme rainfall and flooding, but wise flood risk managers might adopt a ‘no regrets’ strategy and factor these studies into their risk assessment.
Decision making using the products of UKCP09 raises issues thoughtfully explored in Hulme's (Reference Hulme2009) masterly critique of how the outputs of climate science should be used to address pressing societal agendas. As with all science, UKCP09 is socially constructed and the uses to which it is put is highly dependent on contested value systems. The handling of uncertainty in climate science is especially important, as this will involve value judgements, societal priorities and finely-balanced decisions. At this point in the decision-making process, technical debates over model specification and performance give way to informed expert judgement, coupled with effective knowledge transfer grounded in public accountability.
5. Potential impacts and consequences of climate change for key sectors in Scotland's economy, society and environment
Climate change will have profound impacts on Scotland's economy, its society and its environment. Whilst some of these impacts will be negative and costly, others will be positive and, if appropriately harnessed, beneficial to Scotland. In the rest of this section, the potential impacts and consequences for key sectors in Scotland's economy, society and environment are outlined and commented upon.
Defra's Climate Change Risk Assessment programme (CCRA) provides the most complete assessment of the likely impacts of climate change across the UK. The resulting reports cover the whole of the UK (Defra 2012a, b) with separate reports also available for Scotland (HR Wallingford et al. 2012) and the other Devolved Administrations. The CCRA identified 100 risks arising from climate change across 11 sectors: Agriculture, Biodiversity, Built Environment, Business/Industry/Services, Energy, Forestry, Floods and Coastal Erosion, Health, Marine and Fisheries, Transport and Water. Projections of future population growth were included in the assessment. Excluded from the analysis were other societal changes arising from economic growth, development of new technologies or future Government policies or private adaptation investments. Whilst accepting that Government and key organisations are already developing adaptation plans, it was thought that this approach provided a robust ‘baseline’ against which future plans and policies could be developed in both the public and private sectors. On the basis of 11 sector workshops, 10% of the total risks (or opportunities) were selected for more detailed analysis, using single factor projections based on UKCP09 such as temperature or rainfall. The Scotland report follows the same methodology as the UK-wide reports, with some editing of the risks and opportunities. We now comment on the most significant findings from the report on Scotland noting that, in some key details, it differs from the rest of the UK.
5.1. Key findings
5.1.1. The natural environment
Biodiversity
In general, the impacts on biodiversity are likely to be negative. Most significant may be the inability of species to track climate change as habitats evolve (some, such as alpine montane habitats may completely disappear), resulting in a loss of key species and reduction in ecosystem services. Also nationally important could be increasing non-synchrony between breeding cycles and food supplies and the increased risk from pests and diseases. Changes in migration patterns may affect species populations and question existing protected areas (SSSIs, NNRs, SACs and SPAs). This in turn would trigger debate on the need for new sites in anticipation of habitat change. More localised impacts from severe droughts and increased drying of soils in the summer could include a heightened risk of wild fires, changes in soil organic carbon and damage to peatlands. Sea-level rise may result in the loss of machair habitat in the Hebrides and, more generally, a reduction in the inter-tidal zone (eg grazing marshes for migrant birds). More generally, changes in coastal erosion and accretion could lead to the loss of important habitats, especially along inner and developed Firths which are often developed in soft sediments.
Marine and coastal waters
Sea surface temperatures around Scotland may increase, with associated changes in the stratification of ocean waters which may also become more acidic, adversely impacting on commercial shellfish species. In shallow marine and near-shore zones, cultivated fisheries (especially salmonids) could be threatened and shorelines physically damaged by rising sea levels and storm surges. As sea levels rise, saline intrusion may affect priority habitats and economically important coastal resources. The number of dead coastal zones may increase due to increased eutrophication. Warmer seas could lead to changes in the numbers of commonly caught fish as species move north.
Freshwaters
Both water quality and water quantity may alter given climate change. Flow regimes in rivers may adjust, with higher flows in winter and lower flows in summer. This could result in higher sediment loads in winter and higher dissolved loads in summer – both yielding an overall reduction in water quality. More intense summer storms in urban areas may increase the frequency of sewer flooding and spills from combined sewer outflows, with locally-severe water quality impacts. Higher temperatures may increase the risk of eutrophication of rivers, lakes and estuaries, with attendant health hazards. Major droughts could reduce recharge of groundwater and impact on licensed abstractions for public water supply, agriculture and industry. Increasing demands for water, especially in the summer, may stress water supply systems and question the use of environmental flows to protect freshwater biodiversity.
5.1.2. Agriculture and forestry
Agriculture
Positive changes within the agricultural sector are likely to include a lengthened growing season, leading to a greater potential range of land use and increased productivity. The proportion of land suitable for arable farming may significantly increase, especially in the northeast. Over the coming century, wheat yields could double and, by the 2050s, grassland productivity could increase by more than a half. But this may be offset by a greater prevalence in indigenous and exotic pests and diseases affecting both crops and livestock. Increased flood risk by up to 100% by the 2050s and 170% by the 2080s, relative to a 1961–90 baseline, could reduce the productivity of both arable and grassland farming. New areas available for arable farming may have negative impacts on biodiversity.
Forestry
Timber productivity, especially for Sitka spruce, is likely to increase as a result of higher temperatures and levels of CO2. But this could be offset by increased risk of droughts, with adverse impacts on timber yields. Increased temperatures may add to the risk of pests and diseases, with optimal conditions for many pathogens likely to be reached by the end of the century. Wildfires may increase by as much as 30% to 40% by the 2080s (relative to the 1980s), with negative impacts on both timber yield and biodiversity.
5.1.3. Business and services
Flooding
A major concern for the business and services sector is the risk of increased flooding from overtopped rivers, sea-level rise and surges round the coast and failures in urban drainage. For non-residential properties, flood risk is likely to increase by at least 40% by the 2050s and by at least 60% by the 2080s. Smaller firms may not be sufficiently resilient to recover from repeated flooding, and even larger companies could have their supply chains affected and additional losses caused by failure or disruption of key infrastructure. Financial services are likely to be affected, initially via the insurance and mortgage markets which may struggle to adjust to more frequent extreme events. The overall mortgage fund at risk, should property insurance become either unaffordable or unavailable, could be of the order of £100 million to £800 million by the 2050s. More generally, if the financial services sector failed adequately to address the likely impacts of climate change, the ripple effect on the wider business and service sector would be very costly. Pressures on the emergency services, both during and immediately after floods, may lead to a tripling of effort by the 2080s.
Tourism and rural areas
Tourism is likely to register positive effects, with numbers increasing as a result of warmer and drier summers. But this may be offset by the impacts of coastal erosion on links golf courses (most notably St Andrews), up to 10,000 archaeological sites (including Skara Brae in Orkney) and the loss of beach areas of 3–12% by the 2080s. Limited transport links and fragile power supplies may make rural areas more vulnerable to the impacts of extreme events.
5.1.4. Infrastructure and buildings
Transport
Extreme events may increase disruption to transport links, especially in rural areas, affecting 10–20% of the length of the road and rail network (flooding) and up to 330 km of the road network (landslides) by the 2050s. But this might be partly offset by less disruption due to ice and snow. Northern Arctic sea routes may open up earlier in the year and remain open for longer, providing opportunities for increased traffic for Scottish ports.
Buildings
As already noted for non-residential properties, increased flooding may substantially increase the number of residential properties at risk. By contrast, during the summer months, domestic, business and industrial customers could see reductions in water availability. Energy demand for heating in the winter is likely to reduce, whereas energy demand in the summer for cooling is likely to rise. The net effect may be a reduction in household consumption of between 6,000 GWh/yr (east Scotland), 3,000 GWhr/yr (north Scotland) and 8,000 GWhr/yr (west Scotland). Green spaces in major urban areas are likely to become less effective at providing cooling, and existing urban drainage systems may more often fail when subject to extreme rainfall.
5.1.5. Health and Wellbeing
Weather-related injury and deaths
The projected increase in physical injury or deaths due to flooding is small (by five and 100 respectively by the 2080s), but many more are likely to suffer from mental health injuries (around 800 people by the 2080s). Heat-related deaths in the summer may also rise (around 100 by the 2050s and by around a further 100 by the 2080s) as may related hospital admissions. By contrast cold-related deaths in the winter may be reduced (by around 550–890 by the 2050s and 800–1,300 by the 2080s), along with associated hospital admissions.
General wellbeing
Fuel poverty may be reduced as a result of warmer winters. But wetter winters may lead to increased algal and fungal growths in buildings, with adverse health impacts on those vulnerable to respiratory diseases
5.2. Discussion on Scotland's CCRA
As already noted, Scotland's CCRA is the first attempt at a challenging task and is best viewed in terms of setting an agenda, establishing some benchmarks and highlighting key issues. But in using the report, practitioners should be aware of two major sources of uncertainty. The first refers to climate science, with key challenges on the potential impacts of a rapid loss of Arctic sea ice and the need to downscale GCM outputs to a grid finer than 25 km. The emerging discourse on the current state of climate science by Hulme (Reference Hulme2009) and others also points to radically new ways of assessing future risks. Secondly, the metrics underpinning many of the projected impacts are less well developed for Scotland than for many other parts of the UK. As a result, many of the impacts for Scotland (e.g., the increase in fatalities and injuries associated with future flooding; susceptibility of reedbeds and lowland raised bogs to damage from saline intrusion; size of mortgage funded needed if flood insurance is withdrawn) are inferred from analogous conditions in other parts of the UK. These and other evidence gaps for Scotland urgently need to be filled. Much better environmental monitoring and auditing is needed for future Climate Change Risk Assessments.
On a more positive note, Scotland may enjoy some advantages over the rest the UK, given climate change. These include the opportunity for higher carbon sequestration in soils, with significant impacts for priority habitats and ecosystems services alongside increased forest productivity. The agricultural sector should also preferentially benefit from higher crop yields, more arable land and a longer growing season.
6. Conclusions
In this paper we have laid out the scientific case for taking climate change seriously in Scotland, but have also stressed the uncertainty attached to projections of possible future climates. Although this is likely to persist for the foreseeable future, some model uncertainty has been captured in the probabilistic outputs of the UK Climate Projections programme (Defra 2009). And, for the first time, this will enable stakeholders to make more informed risk assessments than hitherto. Managing uncertainty both in terms of scientific outputs and, more problematically, in terms of public understanding will continue to be a major challenge. Consensus on the most likely impacts of climate change on Scotland is in its infancy and a more robust methodology is needed to sharpen up current findings. Many of the key metrics for assessing the likely impacts of climate change are either missing or very crude. In conclusion, it is important that Scotland takes climate change seriously and, over coming decades, develops an Adaptation Strategy that both rises to the challenges and seizes the new opportunities.