1. Introduction
Precession has long been considered as a plausible power source to drive flows in planetary fluid layers (Poincaré Reference Poincaré1910; Bullard Reference Bullard1949; Le Bars, Cébron & Le Gal Reference Le Bars, Cébron and Le Gal2015). Precession-driven flows can lead to instabilities, turbulence and even magnetic field generation through dynamo action (Malkus Reference Malkus1968). Motivated by understanding the dynamics of planetary fluid cores, precession-driven flows have been studied for over a century. The primary response of the fluid to precession is the so-called spin-over mode, which corresponds to a tilt of the rotation axis of the fluid with respect to the rotation axis of the container (Poincaré Reference Poincaré1910; Busse Reference Busse1968; Noir et al. Reference Noir, Cardin, Jault and Masson2003; Noir & Cébron Reference Noir and Cébron2013). Precession-driven flows can become unstable through several possible mechanisms. One of the widely considered mechanisms is the parametric instability, which arises from a resonant interaction of the deformation or shear of the uniform vorticity with a pair of inertial waves (Kerswell Reference Kerswell1993b ; Lorenzani & Tilgner Reference Lorenzani and Tilgner2001; Lin, Marti & Noir Reference Lin, Marti and Noir2015). However, other instabilities may also be important, notably the centrifugal instability (Giesecke et al. Reference Giesecke, Vogt, Gundrum and Stefani2018) and boundary-layer instabilities (Kong et al. Reference Kong, Cui, Liao and Zhang2015), which have been suggested as a key source of instability in precessing cylinders. Precession-driven instabilities and turbulence can lead to the formation of large-scale vortices at low viscosity, which favour the magnetic field generation through dynamo action (Lin et al. Reference Lin, Marti, Noir and Jackson2016; Cébron et al. Reference Cébron, Laguerre, Noir and Schaeffer2019). Therefore, precession provides an alternative or supplementary power source for the long-lived lunar dynamo (Dwyer, Stevenson & Nimmo Reference Dwyer, Stevenson and Nimmo2011; Weiss & Tikoo Reference Weiss and Tikoo2014).
Previous studies have focused primarily on precession-driven flows in neutrally stratified fluids (Le Bars et al. Reference Le Bars, Cébron and Le Gal2015). However, planetary cores, particularly in smaller bodies such as the Moon, would have rapidly developed thermal stable stratification due to secular cooling (Weiss & Tikoo Reference Weiss and Tikoo2014). Therefore, it is of great interest to investigate the precessional instability in a stably stratified fluid. Wei & Tilgner (Reference Wei and Tilgner2013) showed that stable stratification suppresses the precessional instability in a spherical shell at relatively large Ekman numbers. Recent linear stability analysis in a cylinder also found that the stable stratification makes the precessional instability less efficient (Benkacem et al. Reference Benkacem, Salhi, Khlifi, Nasraoui and Cambon2022). If this is the case for planetary interiors, the efficiency of energy injection into stably stratified liquid cores via precession would be reduced, potentially limiting their dynamo capability.
In a closely related problem involving elliptical instability driven by tidal forcing, linear stability analysis has shown that stable stratification can either enhance or suppress the growth rate of the instability, depending on the strength of the stratification and the unstable modes that are excited (Kerswell Reference Kerswell1993a ; Miyazaki Reference Miyazaki1993; Le Bars & Le Dizès Reference Le Bars and Le Dizès2006; Aspden & Vanneste Reference Aspden and Vanneste2009; Guimbard et al. Reference Guimbard, Le Dizès, Le Bars, Le Gal and Leblanc2010; Vidal et al. Reference Vidal, Cébron, ud Doula and Alecian2019). Numerical simulations in the nonlinear regime have shown that stable stratification promotes the tidal instability (Cébron et al. Reference Cébron, Maubert and Le Bars2010), leading to mixing and self-sustained magnetic fields in stably stratified layers (Vidal et al. Reference Vidal, Cébron, Schaeffer and Hollerbach2018). In a rotating stably stratified fluid, gravito-inertial waves can be excited (Dintrans, Rieutord & Valdettaro Reference Dintrans, Rieutord and Valdettaro1999), and may become unstable via triadic resonant interactions (Maurer, Joubaud & Odier Reference Maurer, Joubaud and Odier2016), offering a plausible mechanism for mixing and angular momentum transport in oceans and stellar radiative zones (Rogers et al. Reference Rogers, Lin, McElwaine and Lau2013). When the Brunt–Väisälä frequency is comparable to the rotation frequency, precession can also excite gravito-inertial waves in principle. This raises the question of whether stable stratification could enhance the instability of precession-driven flows due to the excitation of gravito-inertial waves in certain parameter regimes.
In this study, we investigate the instability of precessional flows in a stably stratified spherical shell using direct numerical simulations at a lower Ekman number. By systematically varying the strength of the stratification and the precession amplitude, we show that, in contrast to the result of Wei & Tilgner (Reference Wei and Tilgner2013) with relatively weak stratification and large Ekman numbers, stable stratification can lead to the precessional flows being more unstable compared with the neutrally buoyant case when the Brunt–Väisälä frequency in the bulk is comparable to the rotation frequency. This enhanced instability is attributed to triadic resonances between the basic precessional flow and a pair of gravito-inertial waves.
This paper is structured as follows. In § 2, we describe the governing equations and numerical set-up. In § 3, we present the results of our simulations, focusing on the interplay between stratification and precessional instability. Section 4 concludes with a summary and discussion.
2. Numerical models
We consider a spherical shell with an inner-to-outer radius ratio
 $r_i/r_o=0.1$
, filled with a homogeneous, incompressible fluid. The shell rotates about its spin axis with angular velocity
 $ \boldsymbol{\varOmega }_s = \varOmega _s \boldsymbol{\hat {k}}_s$
, where
 $\Omega_s$
is the spin rate and
 $\hat{\boldsymbol{k}}_s$
denotes the unit vector along the spin axis. Simultaneously, the spin axis precesses about a fixed precession axis with an angular velocity
 $ \boldsymbol{\varOmega }_p = \varOmega _p \boldsymbol{\hat {k}}_p$
, where
 $\Omega_p$
is the precession rate and
 $ \boldsymbol{\hat {k}}_p$
is the unit vector along the precession axis. The angle between the spin and precession axes is set to
 $\alpha _p=120^\circ$
, corresponding to a retrograde precession. The gravitational acceleration (neglecting the centrifugal force) varies linearly with radius
 $\boldsymbol{g} = -g_o \boldsymbol{r}/{r_o}$
, where
 $\boldsymbol{r}$
is the position vector and
 $g_o$
the gravitational acceleration at the outer boundary.
The stable stratification is imposed by fixing the temperature
 $ T_i$
at the inner boundary and
 $ T_o$
at the outer boundary, with a temperature difference
 $ \Delta T = T_o - T_i\gt 0$
. In the absence of internal heating, the corresponding stable temperature profile
 $ T_b$
is then given by
 \begin{equation} T_b = -\frac {\Delta T}{D}\frac {r_o r_i}{r} + C, \end{equation}
where
 $r$
is the radial coordinate,
 $D = r_o - r_i$
and
 $C = (r_o T_o - r_i T_i)/(r_o - r_i)$
. The strength of the stable stratification is characterised by the square of the Brunt–Väisälä frequency, defined as
 \begin{equation} N^2(r) = \frac { \alpha g_o r}{r_o} \frac {\textrm{d}T_b}{\textrm{d}r} = \frac {\alpha g_o \Delta T}{D} \frac {r_i}{r}, \end{equation}
where
 $ \alpha$
is the thermal expansion coefficient. In our model,
 $N^2(r)$
is inversely proportional to the radius
 $r$
, with the maximum value at the inner boundary. A schematic of the numerical model is shown in figure 1.
We adopt the shell thickness
 $ D = r_o - r_i$
as the characteristic length scale,
 $ \varOmega _s^{-1}$
as the time scale, and the temperature difference
 $ \Delta T$
as the temperature unit. Under the Boussinesq approximation, the dimensionless governing equations in the reference frame attached to the precessing and rotating shell (hereinafter referred to as the mantle frame) take the following form:
 \begin{align}\frac {\partial \boldsymbol{u}}{\partial t} + \boldsymbol{u} \boldsymbol{\cdot }\boldsymbol{\nabla }\boldsymbol{u} + 2 \big ( \boldsymbol{\hat {k}}_{s} + Po\, \boldsymbol{\hat {k}}_p \big) \times \boldsymbol{u} &= -\boldsymbol{\nabla }p + E {\nabla} ^2 \boldsymbol{u} - \textit{Po}\big(\boldsymbol{\hat {k}}_p \times \boldsymbol{\hat {k}}_s\big) \times \boldsymbol{r} + \textit{Bu} \varTheta \frac {\boldsymbol{r}}{r_o},\end{align}
 \begin{align}\boldsymbol{\nabla }\boldsymbol{\cdot }\boldsymbol{u} = 0,\end{align}
 \begin{align}\frac {\partial \mathit{\varTheta }}{\partial t}+\boldsymbol{u} \boldsymbol{\cdot }\boldsymbol{\nabla }\mathit{\varTheta }+u_r \frac {r_ir_o}{r^2}&=\frac {E}{Pr} {\nabla} ^{2}\mathit{\varTheta },\end{align}
where
 $ \boldsymbol{u}$
is the velocity field,
 $u_r$
is its radial component,
 $p$
is pressure, and
 $\varTheta$
represents the temperature perturbations relative to the background profile. In the mantle frame, the spin axis
 $\boldsymbol{\hat {k}}_s$
is steady, whereas the precession axis
 $\boldsymbol{\hat {k}}_p$
is time-dependent:
 \begin{equation} \boldsymbol{\hat {k}}_p = \left ( \boldsymbol{\hat {x}} \cos t - \boldsymbol{\hat {y}} \sin t \right ) \sin \alpha _p + \boldsymbol{\hat {z}} \cos \alpha _p, \end{equation}
where
 $\boldsymbol{\hat {x}}, \boldsymbol{\hat {y}}, \boldsymbol{\hat {z}}$
are the unit vectors of the Cartesian coordinate system
 $(x, y, z)$
. The
 $z$
-axis is aligned with the rotation vector
 $\boldsymbol{\hat {k}}_s$
and
 $\alpha _p$
is the tilt angle between the spin and precession axes.
Schematic of the numerical model. A fluid-filled spherical shell rotates with angular velocity
 $\boldsymbol{\varOmega} _s$
about the spin axis
 $\boldsymbol{\hat{k}}_s$
, which in turn precesses about the precession axis
 $\boldsymbol{\hat{k}}_p$
with angular velocity
 $\boldsymbol{\varOmega}_p$
. The colour map represents the radial profile of the squared Brunt–Väisälä frequency
 $N^2(r)$
, normalised by its value at the inner boundary.

The dimensionless parameters appearing in the governing equations are defined as follows. The Ekman number,
 $ E = \nu / (\varOmega _s D^2)$
, characterises the ratio of viscous to Coriolis forces. The Prandtl number,
 $ Pr = \nu / \kappa$
, represents the ratio of viscous to thermal diffusivity. The Poincaré number,
 $ Po = \varOmega _p / \varOmega _s$
, measures the relative strength of the precessional forcing. Following the convention in geophysical fluid dynamics (Pedlosky Reference Pedlosky2013), we adopt the Burger number (
 ${\textit{Bu}}$
) to characterise the ratio of stratification to rotation:
 \begin{equation} \textit{Bu}=\frac {\alpha g_o \Delta T}{\varOmega _s^2 D} = \frac {N^2(r_i)}{\varOmega _s^2}, \end{equation}
which corresponds to the squared ratio of the Brunt–Väisälä frequency at the inner boundary to the rotation frequency.
The temperature perturbation is set to zero at both inner and outer boundaries, corresponding to fixed temperature boundary conditions. We also performed additional test simulations with fixed-flux boundary conditions to confirm that our main findings are robust with respect to the choice of thermal boundary condition. For the velocity field, we impose a stress-free condition at the inner boundary to approximate a fully liquid core, and a no-slip condition at the outer boundary.
Equations (2.3) to (2.5), together with the boundary conditions, are solved using the open-source magnetohydrodynamic code MagIC (https://magic-sph.github.io/), which is based on a pseudo-spectral method (Wicht Reference Wicht2002). The velocity field is decomposed into toroidal and poloidal components in a spherical coordinate system:
 \begin{equation} \boldsymbol{u}=\boldsymbol{\nabla }\times (\mathcal{T}{\hat {\boldsymbol{r}}})+\boldsymbol{\nabla }\times \boldsymbol{\nabla }\times (\mathcal{P}{\hat {\boldsymbol{r}}}), \end{equation}
where
 $\mathcal{T}$
and
 $\mathcal{P}$
are the toroidal and poloidal scalar potentials, respectively, and
 $\boldsymbol{\hat {r}}$
is the unit vector in the radial direction. These scalar potentials are expanded in spherical harmonics
 $P_l^m(\cos \theta ) {\textrm{e}}^{{\textrm{i}} m\phi }$
in the angular directions and Chebyshev polynomials in the radial direction, where
 $P_l^m$
is the associated Legendre polynomial of degree
 $l$
and azimuthal wavenumber
 $m$
,
 $\theta$
is the colatitude, and
 $\phi$
is the longitude. For the spherical harmonic transforms, the code uses the open-source library SHTns (Schaeffer Reference Schaeffer2013). The spectral expansion is truncated at spherical harmonic degree
 $L$
and Chebyshev polynomial degree
 $N$
. In simulations with strong precession forcing (
 ${\textit{Po}} = 3 \times 10^{-3}$
) and strong stable stratification (
 ${\textit{Bu}} = 10$
), the highest resolution of
 $L = 170$
and
 $N = 289$
is used to ensure the numerical convergence. In addition to resolution tests, we performed some benchmark tests based on the models presented in Wei & Tilgner (Reference Wei and Tilgner2013). We successfully reproduced their simulations with the Ekman number
 $E=2\times 10^{-4}$
and the Burger number in the range of
 ${\textit{Bu}} \in [0, 1]$
, serving as a validation of our numerical models.
Previous studies have shown that precession-driven laminar flows are centrally symmetric about the origin (
 $\boldsymbol{r}=0$
), satisfying
 $\boldsymbol{u}(-\boldsymbol{r}) = -\boldsymbol{u}(\boldsymbol{r})$
(Lorenzani & Tilgner Reference Lorenzani and Tilgner2001; Lin et al. Reference Lin, Marti, Noir and Jackson2016). However, this symmetry can be broken by flow instabilities. To better characterise the onset of instability, we decompose the velocity field into symmetric and antisymmetric components as
 \begin{equation} \boldsymbol{u}_s = \frac {1}{2} \left ( \boldsymbol{u}(\boldsymbol{r}) - \boldsymbol{u}(-\boldsymbol{r}) \right ), \quad \boldsymbol{u}_a = \frac {1}{2} \left ( \boldsymbol{u}(\boldsymbol{r}) + \boldsymbol{u}(-\boldsymbol{r}) \right ), \end{equation}
where
 $\boldsymbol{u}_s$
and
 $\boldsymbol{u}_a$
denote the symmetric and antisymmetric parts, respectively.
The corresponding total kinetic energy, symmetric kinetic energy, and antisymmetric kinetic energy were defined as follows:
 \begin{equation} \textit{Ek}=\frac {1}{2} \int _V|\boldsymbol{u}(\boldsymbol{r})|^2{\textrm d}V, \quad Ek_s=\frac {1}{2} \int _V|\boldsymbol{u}_s(\boldsymbol{r})|^2{\textrm d}V, \quad Ek_a=\frac {1}{2} \int _V|\boldsymbol{u}_a(\boldsymbol{r})|^2{\textrm d}V, \end{equation}
where
 $V$
denotes the volume of the fluid shell. The stability of the flow is assessed by monitoring the growth of the antisymmetric kinetic energy
 ${\textit{Ek}}_a$
.
To quantify the heat transport by precession-driven flows, we calculate the Nusselt number (
 $Nu$
), defined as the ratio of the total heat transfer to the thermal conduction in the fluid at rest. At the outer boundary (
 $r=r_o$
), it is given by
 \begin{equation} \textit{Nu} = \frac {\langle \partial T / \partial r \rangle _{r_o}}{\partial T_b / \partial r |_{r_o}}, \end{equation}
where
 $\langle \ldots \rangle$
denotes the average over the spherical surface and time,
 $T$
is the total temperature field, and
 $T_b$
is the conductive background temperature profile. Since
 $Nu=1$
corresponds to the purely conductive state, the quantity
 $Nu-1$
represents the net enhancement of heat transport due to the precession-driven flows.
All simulations are performed in the mantle frame of reference, in which the primary precession-driven flow corresponds to a solid-body rotation. The solid-body-rotation component of the fluid in the precession frame can be extracted from the toroidal spectral coefficients
 $\mathcal{T}_1^0$
and
 $\mathcal{T}_1^1$
(Lorenzani & Tilgner Reference Lorenzani and Tilgner2001):
 \begin{equation} \boldsymbol{\omega }(r) = -\frac {2}{r^2} \sqrt {\frac {3}{8\pi }}\, {\textrm{Re}}\left \{ \mathcal{T}_1^1(r) \right \} \boldsymbol{\hat {x}} + \frac {2}{r^2} \sqrt {\frac {3}{8\pi }}\, {\textrm{Im}}\left \{ \mathcal{T}_1^1(r) \right \} \boldsymbol{\hat {y}} + \left ( \frac {1}{r^2} \sqrt {\frac {3}{4\pi }}\, \mathcal{T}_1^0(r) + 1 \right ) \boldsymbol{\hat {z}}, \end{equation}
where
 $\textrm{Re}\{\}$
and
 $\textrm{Im}\{\}$
represent the real and imaginary parts, respectively. The mean rotation of the fluid is then defined as
 $\boldsymbol{\omega _F}=(1 / V') \int \boldsymbol{\omega }(r) \textrm{d} V'$
, with
 $V'$
being the volume of the region where the axial component of the angular velocity,
 $\omega_z$
, remains nearly constant along the radius.
3. Results
3.1. Stability diagram
In this study, the Ekman number is fixed at
 $ E = 10^{-5}$
, and the Prandtl number is set to
 $ Pr = 1$
. The Burger number
 ${\textit{Bu}}$
is varied from 0 to 10, while the Poincaré number
 ${\textit{Po}}$
ranges from
 $10^{-4}$
to
 $3\times 10^{-3}$
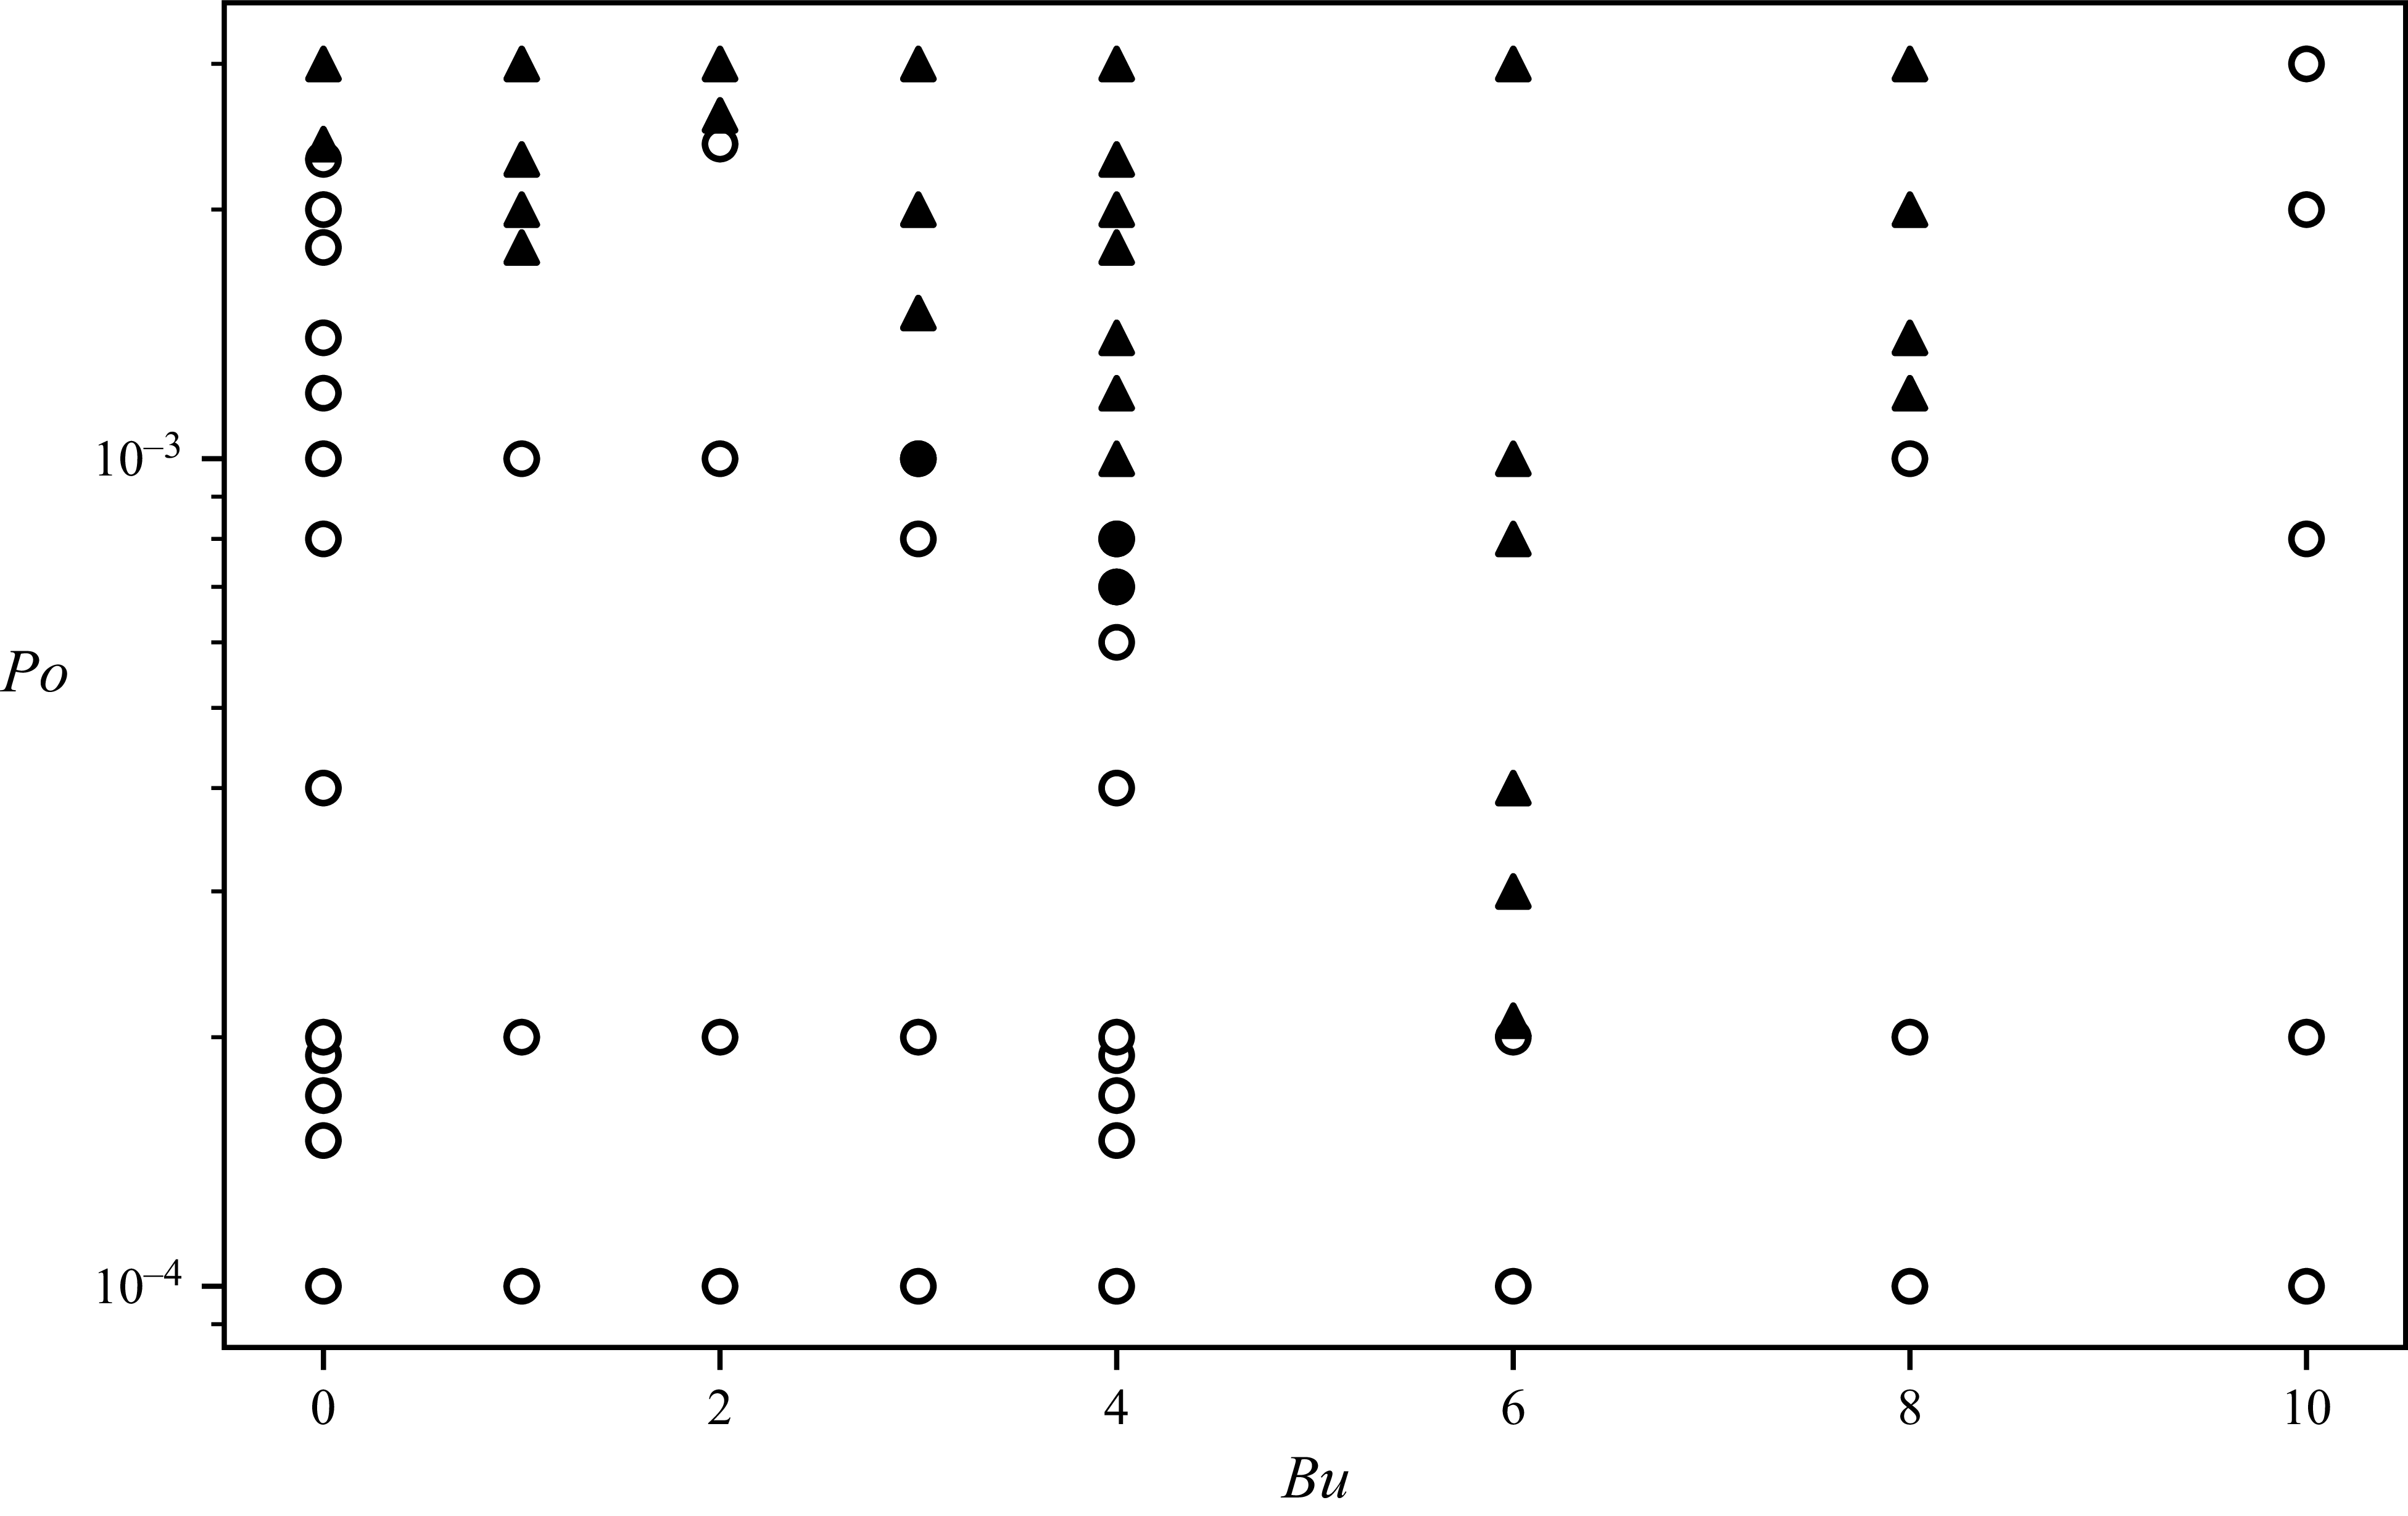
. Figure 2 shows the stability diagram of all simulations in the parameter space of
 $(Po, Bu)$
. Our simulations are classified into three categories based on the time evolution of different components of the kinetic energy. The stable cases (open circles) are characterised by the central symmetry and steady kinetic energy after the transient stage. The rise of instabilities typically leads to time-dependent flows and the break of central symmetry (filled triangles). In a few cases, the flows remain centrally symmetric but exhibit persistent oscillations in the kinetic energy (filled circles), suggesting the unstable modes are also centrally symmetric (Lin et al. Reference Lin, Marti and Noir2015).
Stability diagram in the parameter space of
 $(Po,Bu)$
. Open circles indicate flows that maintain central symmetry and a constant total energy; filled circles represent flows that preserve central symmetry but exhibit time-dependent variations in total energy; filled triangles correspond to flows where central symmetry is broken.

Time evolution of (
 $a$
) toroidal kinetic energy (
 ${\textit{Ek}}_{tor}$
), (
 $b$
) poloidal kinetic energy (
 ${\textit{Ek}}_{pol}$
) and (
 $c$
) antisymmetric kinetic energy (
 ${\textit{Ek}}_{a}$
) for three representative cases at
 ${\textit{Bu}}=4$
:
 ${\textit{Po}}=6\times 10^{-4}$
(stable, blue),
 ${\textit{Po}}=8\times 10^{-4}$
(time-dependent symmetric, orange) and
 ${\textit{Po}}=1\times 10^{-3}$
(symmetry-broken unstable, green). The insets in (
 $a$
) and (
 $b$
) provide magnified views of the fluctuations for the time-dependent symmetric and unstable cases during the saturated state (
 $t/2\pi \in [1480, 1500]$
). To facilitate visual comparison, the values in the insets are normalised by the time-averaged energy of the unstable case (
 ${\textit{Po}}=1\times 10^{-3}$
) within this interval.

To illustrate these classifications, figure 3 shows the time evolution of the toroidal energy
 ${\textit{Ek}}_{tor}$
, the poloidal energy
 ${\textit{Ek}}_{pol}$
, and the antisymmetric energy
 ${\textit{Ek}}_{a}$
for three representative cases at
 ${\textit{Bu}}=4$
. The toroidal energy (figure 3
 $a$
), which is orders of magnitude larger than the poloidal component (figure 3
 $b$
), indicates that the flow is dominated by the spin-over mode. For the stable case at
 ${\textit{Po}}=6\times 10^{-4}$
(blue), the antisymmetric energy
 ${\textit{Ek}}_{a}$
decays exponentially, while
 ${\textit{Ek}}_{tor}$
and
 ${\textit{Ek}}_{pol}$
saturate to constant values. The time-dependent symmetric case at
 ${\textit{Po}}=8\times 10^{-4}$
(orange) also shows a decaying
 ${\textit{Ek}}_{a}$
; however, as highlighted in the inset of figures 3(
 $a$
) and 3(
 $b$
), its toroidal and poloidal energy exhibit oscillations, indicating the excitation of centrally symmetric unstable modes. In contrast, for the unstable case at
 ${\textit{Po}}=1\times 10^{-3}$
(green),
 ${\textit{Ek}}_{a}$
grows and saturates at a finite value, indicating the growth of symmetric unstable modes. The insets in figures 3(
 $a$
) and 3(
 $b$
) reveal that the saturated state of this case is characterised by large-amplitude, irregular fluctuations, which are distinct from the small-amplitude harmonic oscillations observed in the symmetric case.
These representative cases are consistent with the overall stability diagram shown in figure 2, which reveals a complex and non-monotonic threshold between the stable and unstable flow regimes. The critical value of
 ${\textit{Po}}_c$
for the instability initially decreases as
 ${\textit{Bu}}$
increases to 1. It then exhibits a local increase as stratification strengthens towards
 ${\textit{Bu}}=2$
. Refined parameter scans at
 ${\textit{Bu}}=1.7$
and
 ${\textit{Bu}}=2.2$
confirm this continuous variation of the stability threshold. Beyond this local maximum, the threshold decreases further and reaches its minimum value at
 ${\textit{Bu}}=6$
, after which the flow is stabilised again at stronger stratification. For all cases with
 ${\textit{Bu}}=10$
, where the Brunt–Väisälä frequency exceeds the rotation frequency throughout the fluid shell, the precession-driven flows remain stable. This complex behaviour is qualitatively similar to that reported for the tidally driven elliptical instability in a stably stratified sphere (Vidal et al. Reference Vidal, Cébron, Schaeffer and Hollerbach2018, Reference Vidal, Cébron, ud Doula and Alecian2019), where stable stratification is found to either enhance or suppress the instability depending on the strength of stratification and the specific resonant modes involved.
The most unstable regime occurs at around
 ${\textit{Bu}}=6$
, where the critical value
 ${\textit{Po}}_c$
is approximately one order of magnitude lower than that of the neutrally stratified cases (
 ${\textit{Bu}}=0$
). Since the imposed temperature profile implies
 $N^2/\varOmega _s^2=Bu\,r_i/r$
in our model, the case with
 ${\textit{Bu}}=6$
corresponds to
 $N^2/\varOmega _s^2 \sim 1$
in the mid-radius region of the fluid shell. This suggests that the stable stratification significantly enhances the precessional instability when the Brunt–Väisälä frequency in the bulk is comparable to the rotation frequency. However, further increasing the Brunt–Väisälä frequency tends to stabilise precession-driven flows. In the following subsections, we first show the effect of stable stratification on the basic precessional flow under weak precessional forcing, and then analyse the mechanism of the precessional instability in the presence of stable stratification.
3.2. The base flow
Before analysing the precessional instability, we first characterise the basic flow. To do this, we examine cases under a weak precessional forcing of
 ${\textit{Po}}=2 \times 10^{-4}$
, for which the flow remains stable for all stratification strengths considered in this study. The bulk rotation of the fluid, as illustrated by the angular velocity profiles in figure 4, reveals the primary structure of the base flow. In these cases, the flow is dominated by a near solid-body rotation, with the axial component
 $\omega _z \approx 1$
throughout most of the shell. This indicates that the primary response to the weak precessional forcing is a uniform rotation of the fluid bulk. Under strong stratification (
 ${\textit{Bu}} \ge 8$
), however, a weak differential rotation develops in the inner part of the shell. Simultaneously, small fluctuations are observed in the equatorial component
 $\sqrt {\omega _x^2+\omega _y^2}$
, particularly near the inner boundary.
Angular velocity of the fluid
 $\boldsymbol{ \omega }$
as a function of radius for different
 ${\textit{Bu}}$
at
 ${\textit{Po}} =2 \times 10^{-4}$
. (
 $a$
) Axial component
 $\omega _z$
and (
 $b$
) equatorial component
 $\sqrt {\omega _x^2+\omega _y^2}$
.

Radial velocity
 $u_{r}$
in the meridional plane at
 ${\textit{Po}} = 2 \times 10^{-4}$
for various stratification strengths. (
 $a$
) Neutral stratification (
 ${\textit{Bu}} = 0$
), (
 $b$
)
 ${\textit{Bu}} = 2$
, (
 $c$
)
 ${\textit{Bu}} = 4$
, (
 $d$
)
 ${\textit{Bu}} = 6$
, (
 $e$
)
 ${\textit{Bu}} = 8$
and (
 $f$
)
 ${\textit{Bu}} = 10$
. The dashed lines indicate the rotation axis of fluid. The dashed circles in (
 $b{-}e$
) represent the location where
 $N^2/\varOmega _s^2=1$
.

Structure of the secondary flow (
 $u_r$
) near the outer boundary (
 $0.95 \le r/r_o \le 1.0$
) in the stable regime (
 ${\textit{Po}} = 2\times 10^{-4}$
). The plots show
 $u_r$
as a function of colatitude (
 $\theta$
) and normalised radius (
 $r/r_o$
). (
 $a$
) Neutral case (
 ${\textit{Bu}} = 0$
); (
 $b$
)
 ${\textit{Bu}}=4$
; (
 $c$
)
 ${\textit{Bu}}=6$
; (
 $d$
)
 ${\textit{Bu}}=10$
.

In addition to the dominant solid-body rotation, there exists a much weaker secondary flow, whose structure is highly sensitive to stratification, as shown by the radial velocity in the meridional plane (figure 5) and near the outer boundary (figure 6). For the neutral case (
 ${\textit{Bu}}=0$
, figures 5
 $a$
and 6
 $a$
), this secondary flow manifests as the classic conical-shear layers emanating from the critical latitudes at the outer boundary (Hollerbach & Kerswell Reference Hollerbach and Kerswell1995; Noir, Jault & Cardin Reference Noir, Jault and Cardin2001). As stable stratification is introduced, this structure is fundamentally altered, transforming into patterns characteristic of gravito-inertial waves (Dintrans et al. Reference Dintrans, Rieutord and Valdettaro1999). However, the flow near the outer boundary exhibits similar structures and magnitudes across all stratification strengths near the equatorial region, particularly the prominent feature persisting around
 $\theta \approx 60^{\circ }$
(see figure 6). The significant modifications induced by stratification occur primarily near the rotation axis, where the wave structures become increasingly localised (see figures 5
 $b$
–
 $e$
and 6
 $b$
–
 $d$
). This localisation can be explained by the local dispersion relation for these waves (Dauxois et al. Reference Dauxois, Joubaud, Odier and Venaille2018):
 \begin{equation} \omega ^2 = N^2(r) \sin ^2\theta + (2\varOmega _s)^2 \cos ^2\theta , \end{equation}
where
 $\omega$
is the wave frequency and
 $\theta$
is the angle of the wave vector with respect to the rotation axis. In our dimensionless framework where
 $\varOmega _s=1$
and the precessional forcing excites modes with a frequency
 $\omega \approx 1$
, propagating waves can exist only in regions near the rotation axis where the condition
 $N^2/\varOmega _s^2 \lt 1$
is satisfied. This theoretical constraint confines the gravito-inertial waves to the region between the dashed circle (where
 $N^2/\varOmega _s^2=1$
) and the outer boundary, which perfectly explains the observed structure of the secondary flow in our simulations, as shown in figure 5(
 $b$
–
 $e$
). As stratification becomes even stronger, for instance at
 ${\textit{Bu}}=10$
(figures 5
 $f$
and 6
 $d$
), the condition
 $N^2/\varOmega _s^2 \lt 1$
is no longer satisfied anywhere within the shell. Consequently, the region near the rotation axis that can support freely propagating gravito-inertial waves vanishes, which is reflected in the simulation by the disappearance of the small-scale wave structures near the polar regions (figure 5
 $e$
–
 $f$
). The flow response is thus forced into a different regime, taking on an internal-gravity-wave-like character, especially in the strongly stratified inner region. This change explains both the radially layered structures seen in the radial velocity (figure 5
 $e,f$
) and the distinct, organised fluctuations observed in the equatorial angular velocity near the inner boundary (figure 4
 $b$
for
 ${\textit{Bu}}=8, 10$
). This transition also coincides with the development of differential rotation in the bulk (figure 4
 $a$
).
Notably, at a moderate stratification of
 ${\textit{Bu}}=6$
(figures 5
 $d$
and 6
 $c$
), the radial velocity perturbations near the rotation axis reach their maximum amplitude. This peak in the secondary flow’s intensity provides a plausible explanation for our main finding in figure 2: the critical Poincaré number for instability reaches its minimum value around
 ${\textit{Bu}}=6$
, likely due to an enhanced resonant interaction with the precessional forcing. This provides a crucial context for understanding the instability mechanism itself, which we will dissect in the following section.
(
 $a$
) Time evolution of the symmetric kinetic energy
 ${\textit{Ek}}_s$
and antisymmetric kinetic energy
 ${\textit{Ek}}_a$
. (
 $b$
) Energy spectra of
 ${\textit{Ek}}_s$
and
 ${\textit{Ek}}_a$
as a function of azimuthal wavenumber
 $m$
at
 $t/2\pi =352$
. Here,
 ${\textit{Bu}}=6$
and
 ${\textit{Po}}=3 \times 10^{-4}$
.

3.3. Parametric instability
To investigate the underlying mechanism of precessional instability in the presence of stable stratification, we examine an unstable case at
 ${\textit{Bu}} = 6$
and
 ${\textit{Po}} = 3 \times 10^{-4}$
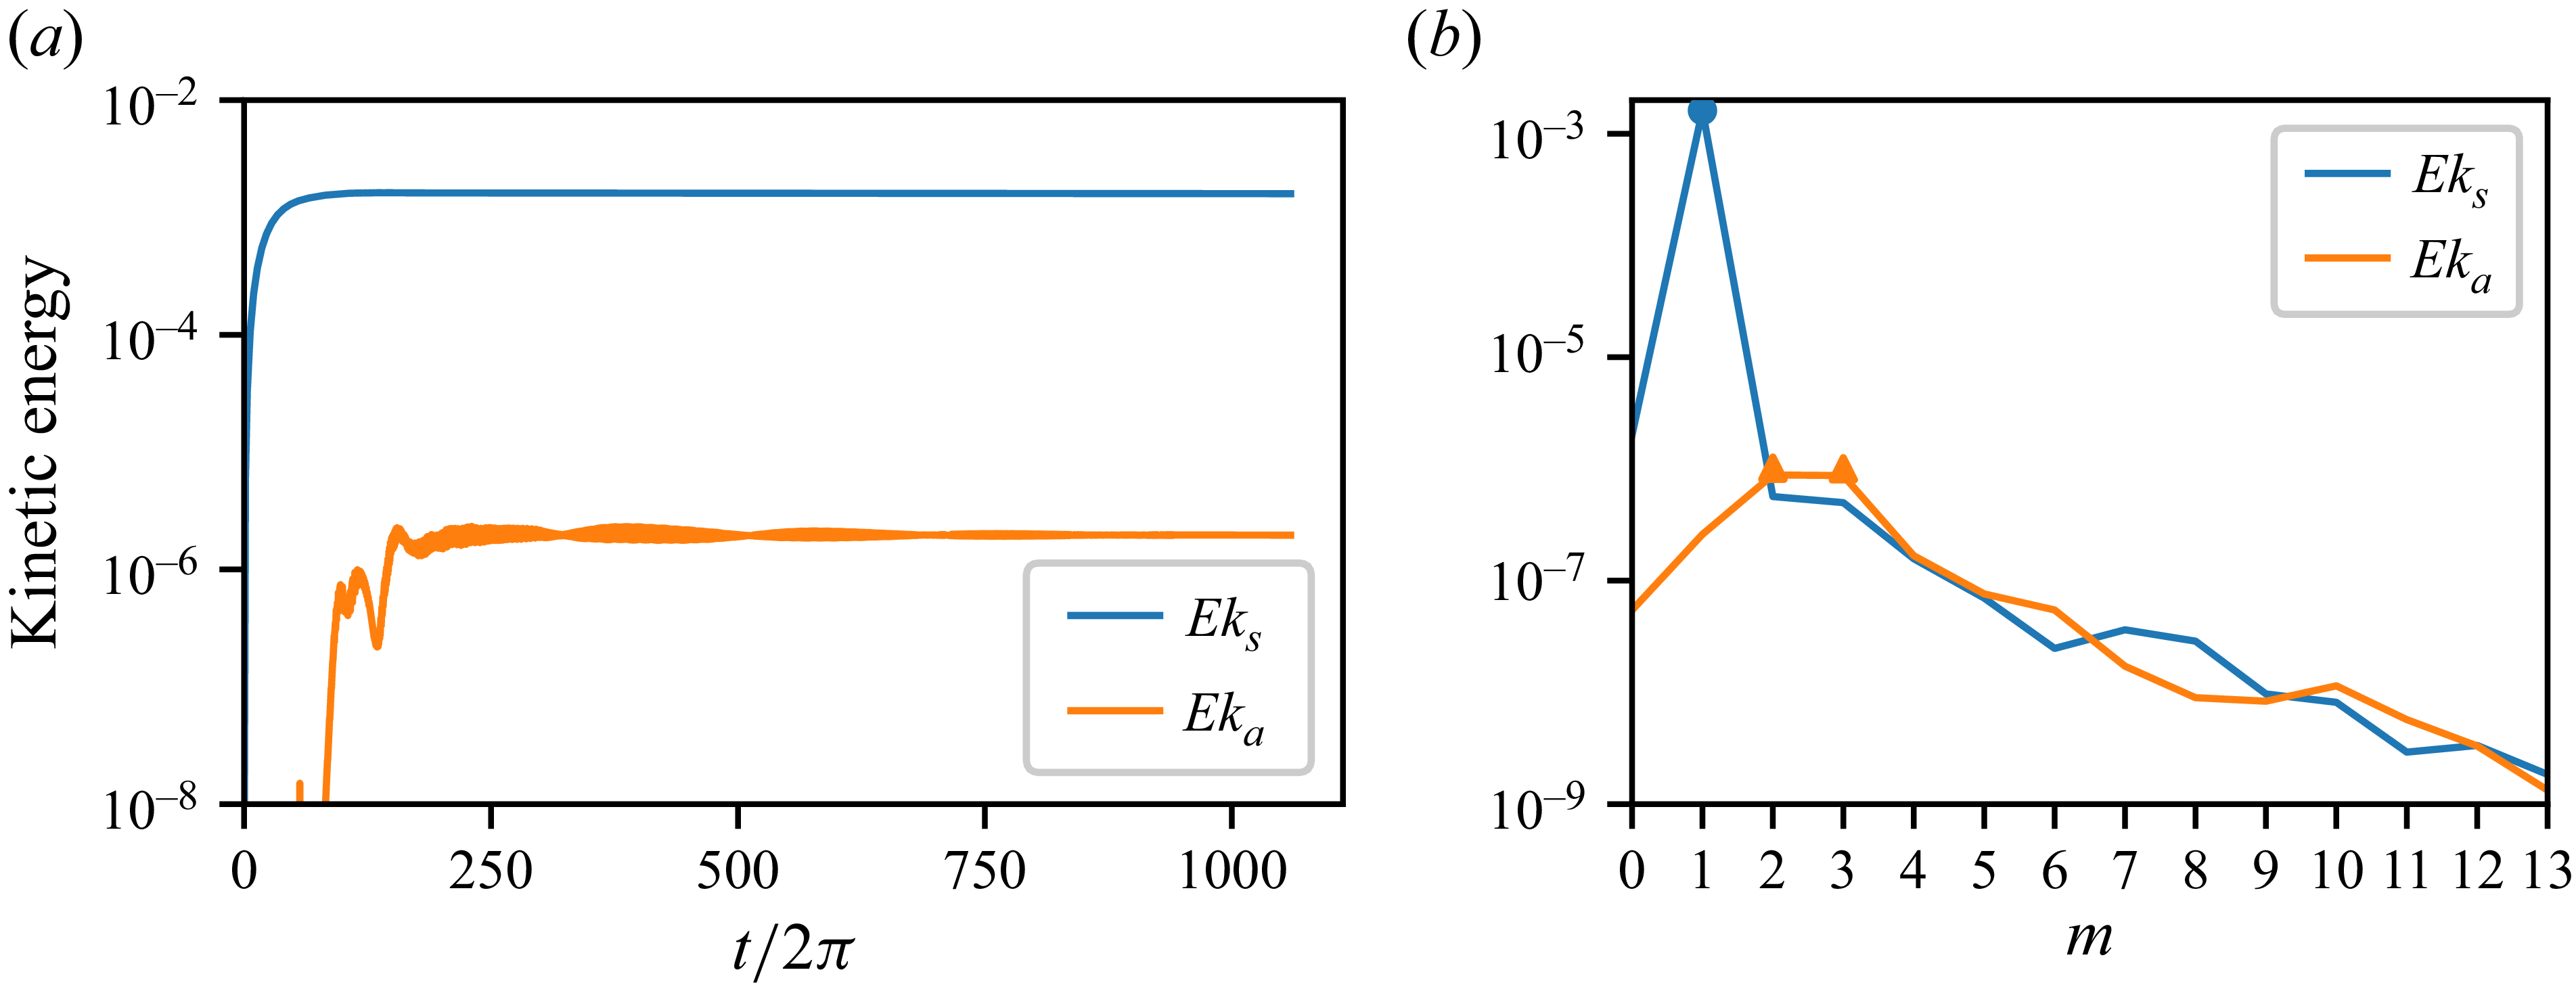
, which lies just above the instability threshold. Figure 7 shows the time evolution and spectra of the
 ${\textit{Ek}}_s$
and
 ${\textit{Ek}}_a$
components of the kinetic energy for this case. As shown in figure 7(
 $a$
), the antisymmetric component
 ${\textit{Ek}}_a$
, which is commonly used as an indicator of precessional instability (Lorenzani & Tilgner Reference Lorenzani and Tilgner2001), starts to grow after
 ${\textit{Ek}}_s$
has saturated, signalling the onset of the instability. The energy spectra (figure 7
 $b$
) reveal that
 ${\textit{Ek}}_s$
is dominated by the
 $m=1$
component, while
 ${\textit{Ek}}_a$
is contributed primarily by the
 $m=2$
and
 $m=3$
components. The dominant
 $m=1$
component in
 ${\textit{Ek}}_s$
corresponds to the linear response to the precessional forcing, which is symmetric around the origin. The
 $m=2$
and
 $m=3$
components in
 ${\textit{Ek}}_a$
arise from the precessional instability with stable stratification.
Contours of the antisymmetric velocity from the
 $m=2$
mode (
 $a{-}c$
) and the
 $m=3$
mode (
 $d{-}f$
) at
 ${\textit{Bu}}=6$
and
 ${\textit{Po}}=3 \times 10^{-4}$
. Panel (
 $a$
) shows
 $u_{\theta a}$
in the equatorial plane, (b)
 $u_{ra}$
and (c)
 $u_{\theta a}$
in the meridional plane for the
 $m=2$
mode. Panel (
 $d$
) shows
 $u_{ra}$
in the equatorial plane, (e)
 $u_{ra}$
and (f)
 $u_{\theta a}$
in the meridional plane for the
 $m=3$
mode. Black dashed lines correspond to the location where
 $N^2/\varOmega _s^2 = 1$
. Animation showing the time variations of this figure is available in supplementary movie 1.

To further illuminate the flow structures of the unstable modes, we extract the
 $m=2$
and
 $m=3$
contributions to the antisymmetric velocity field
 $\boldsymbol{u}_a$
. Figure 8 shows these components, with figure 8(a–c) showing the
 $m=2$
mode and figure 8(d–f) the
 $m=3$
mode. We find that, for the
 $m=2$
mode, the radial component
 $u_{ra}$
is equatorially antisymmetric, while for the
 $m=3$
mode the latitudinal component
 $u_{\theta a}$
exhibits the same symmetry property. As a result, these components are nearly zero at the equatorial plane. To better visualise the flow structures, we therefore show
 $u_{\theta a}$
for the
 $m=2$
mode and
 $u_{ra}$
for the
 $m=3$
mode in the equatorial plane (figure 8
a,d). An analysis of their temporal evolution (see supplementary movie 1 available at https://doi.org/10.1017/jfm.2026.11289) further reveals that both modes travel in the retrograde direction, with frequencies of approximately 0.02 for the
 $m=2$
mode and 1.02 for the
 $m=3$
mode in the container frame.
The structure of the unstable modes in the meridional plane is consistent with that expected for gravito-inertial waves, whose properties depend on the local strength of stratification. This is clearly illustrated by the
 $m=3$
mode (figure 8
 $d$
–
 $f$
), which has a frequency of approximately 1.02 in the container frame. In the outer region, where rotation dominates (
 $N^2/\varOmega _s^2 \lt 1$
), the wave dynamics is controlled primarily by Coriolis effects. Guided by the local dispersion relation (3.1), for a wave frequency approaching the rotation rate, the wave structures near the rotation axis should become nearly parallel to it, a feature clearly visible in figures 8(
 $e$
) and 8(
 $f$
). Away from the rotation axis, the flow behaves as an inertial wave, where the flow organises into large-scale tilted shear layers, which is consistent with the patterns observed in figure 8. Conversely, in the inner region where stratification is dominant (
 $N^2/\varOmega _s^2 \gt 1$
), the wave character transitions toward that of an internal gravity wave. The flow breaks into smaller-scale, cellular and radially layered structures (figure 8
 $e$
), reflecting the suppression of radial motion by strong buoyancy. This transition in flow morphology across the
 $N^2/\varOmega _s^2=1$
boundary (dashed line) provides strong evidence that the instability is mediated by gravito-inertial waves (Dintrans et al. Reference Dintrans, Rieutord and Valdettaro1999).
The properties of the base flow and the unstable modes provide strong evidence for a triadic resonance mechanism. The precession-driven base flow is characterised by a wavenumber
 $m_0=1$
and frequency
 $\omega _0=1.0$
. The instability manifests as a pair of gravito-inertial waves with
 $m_1=2$
,
 $\omega _1 \approx 0.02$
and
 $m_2=3$
,
 $\omega _2 \approx 1.02$
. These modes satisfy the triadic resonance selection rules for azimuthal wavenumbers
 $m_0+m_1=m_2$
as well as the frequency matching condition
 $\omega _0+\omega _1 \approx \omega _2$
(Kerswell Reference Kerswell1993b
). This confirms that the precessional instability in a stably stratified fluid arises from triadic resonances between the precession-driven base flow and a pair of gravito-inertial waves, reminiscent of the tidal instability observed in stably stratified rotating fluids (Le Bars & Le Dizès Reference Le Bars and Le Dizès2006; Cébron et al. Reference Cébron, Maubert and Le Bars2010).
In the context of triadic resonance, the precession-driven base flow acts as the parent wave that transfers energy to a pair of secondary waves, and a stronger parent wave provides a more potent driving force for the resonance. Crucially, our analysis of the base flow shows that the amplitude of the secondary flow reaches its maximum at around
 ${\textit{Bu}}=6$
. Furthermore, the Brunt–Väisälä frequency is comparable to the rotation frequency in the bulk at
 ${\textit{Bu}}=6$
as we have mentioned, which may offer more possibilities for the excitation of gravito-inertial waves through triadic resonances. The most unstable regime occurs at around
 ${\textit{Bu}}=6$
, which may result from the complex interplay between the enhanced base flow and the dispersion relation of gravito-inertial waves (Miyazaki Reference Miyazaki1993; Dintrans et al. Reference Dintrans, Rieutord and Valdettaro1999). Overall, our results unequivocally demonstrated that the threshold of the precessional instability is significantly lowered when the Brunt–Väisälä frequency is comparable to the rotation frequency. Our results differ from that of Wei & Tilgner (Reference Wei and Tilgner2013) because we explore a distinct parameter regime with a lower Ekman number and a wider range of stratification strengths. The relatively low viscosity and moderate stratification regime allow the excitation of gravito-inertial waves, which play an important role in triggering the instability.
3.4. Strong precession regime
Having identified the triadic resonance of gravito-inertial waves as the primary instability mechanism, we now turn to the strongly forced regime to investigate the nonlinear saturation of this instability and its consequences for the mean flow and angular momentum transport. We discuss the results obtained under relatively strong precession at
 ${\textit{Po}} = 3 \times 10^{-3}$
, which is well above the instability threshold for most stratified cases. This regime allows us to investigate the nonlinear saturated state of the instability and its impact on the mean flow.
Contours of radial velocity
 $u_{r}$
in the meridional plane at
 ${\textit{Po}} = 3 \times 10^{-3}$
for various stratification strengths. (
 $a$
) Neutral stratification (
 ${\textit{Bu}} = 0$
), (
 $b$
)
 ${\textit{Bu}} = 1$
, (
 $c$
)
 ${\textit{Bu}} = 3$
, (
 $d$
)
 ${\textit{Bu}} = 6$
, (
 $e$
)
 ${\textit{Bu}} = 8$
and (
 $f$
)
 ${\textit{Bu}} = 10$
. Black dashed lines indicate the rotation axis of fluid.

First, we examine the evolution of the flow morphology in the saturated state, as shown in figure 9. The neutral case (
 ${\textit{Bu}}=0$
, figure 9
a) exhibits a complex flow dominated by large-scale structures, which is driven by the conical-shear instability (Lin et al. Reference Lin, Marti and Noir2015). These results are consistent with previous studies on precession-driven flows in a non-stratified sphere (Lin et al. Reference Lin, Marti and Noir2015; Cébron et al. Reference Cébron, Laguerre, Noir and Schaeffer2019). The weakly stratified case (
 ${\textit{Bu}}=1$
, figure 9
 $b$
) is qualitatively similar, but with the addition of more small-scale structures, marking the initial influence of stratification. At a moderate stratification of
 ${\textit{Bu}}=3$
(figure 9
c), the flow is characterised by vigorous small-scale flows, consistent with a strongly unstable state. This energetic, small-scale character persists through
 ${\textit{Bu}}=6$
(figure 9
d), corresponding to the minimum instability threshold identified in figure 2. As stratification strengthens further to
 ${\textit{Bu}}=8$
(figure 9
e), the flow remains unstable, but energetic motions become more confined to the inner regions of the shell. Finally, at
 ${\textit{Bu}}=10$
(figure 9
f), the instability is fully suppressed, and the flow becomes stable and dominated by a coherent, large-scale wave pattern.
Angular velocity of the fluid
 $\boldsymbol{ \omega }$
as a function of radius for different
 ${\textit{Bu}}$
at
 ${\textit{Po}} =3 \times 10^{-3}$
. (
 $a$
) Axial component
 $\omega _z$
and (
 $b$
) equatorial component
 $\sqrt {\omega _x^2+\omega _y^2}$
.

These changes in the flow dynamics lead to significant modifications in the angular momentum transport and the resulting mean flow. Figure 10 shows the angular velocity of the fluid,
 $\boldsymbol{ \omega }$
, defined in (2.12), as a function of radius for different
 ${\textit{Bu}}$
at
 ${\textit{Po}} =3 \times 10^{-3}$
. For the non-stratified (
 ${\textit{Bu}}=0$
) and weakly stratified (
 ${\textit{Bu}}=1$
) cases, a nearly uniform vorticity is maintained throughout the bulk, despite the presence of instabilities (primarily in the form of inertial waves). This agrees with previous results in precessing spheres without stratification (Lin et al. Reference Lin, Marti and Noir2015). In contrast, for cases with moderate to strong stratification, the angular velocity departs significantly from the uniform vorticity profile, especially in the inner region. This deviation is attributed to the excitation of gravito-inertial waves, which can play a key role in angular momentum transport (Rogers et al. Reference Rogers, Lin, McElwaine and Lau2013). As shown in figure 10(
 $a$
), this leads to strong differential rotation, which has important implications for understanding the dynamics of planetary and stellar interiors. Although a comprehensive analysis of precession-driven angular momentum transport is beyond the scope of this study, our numerical results highlight its potential significance in stably stratified fluids.
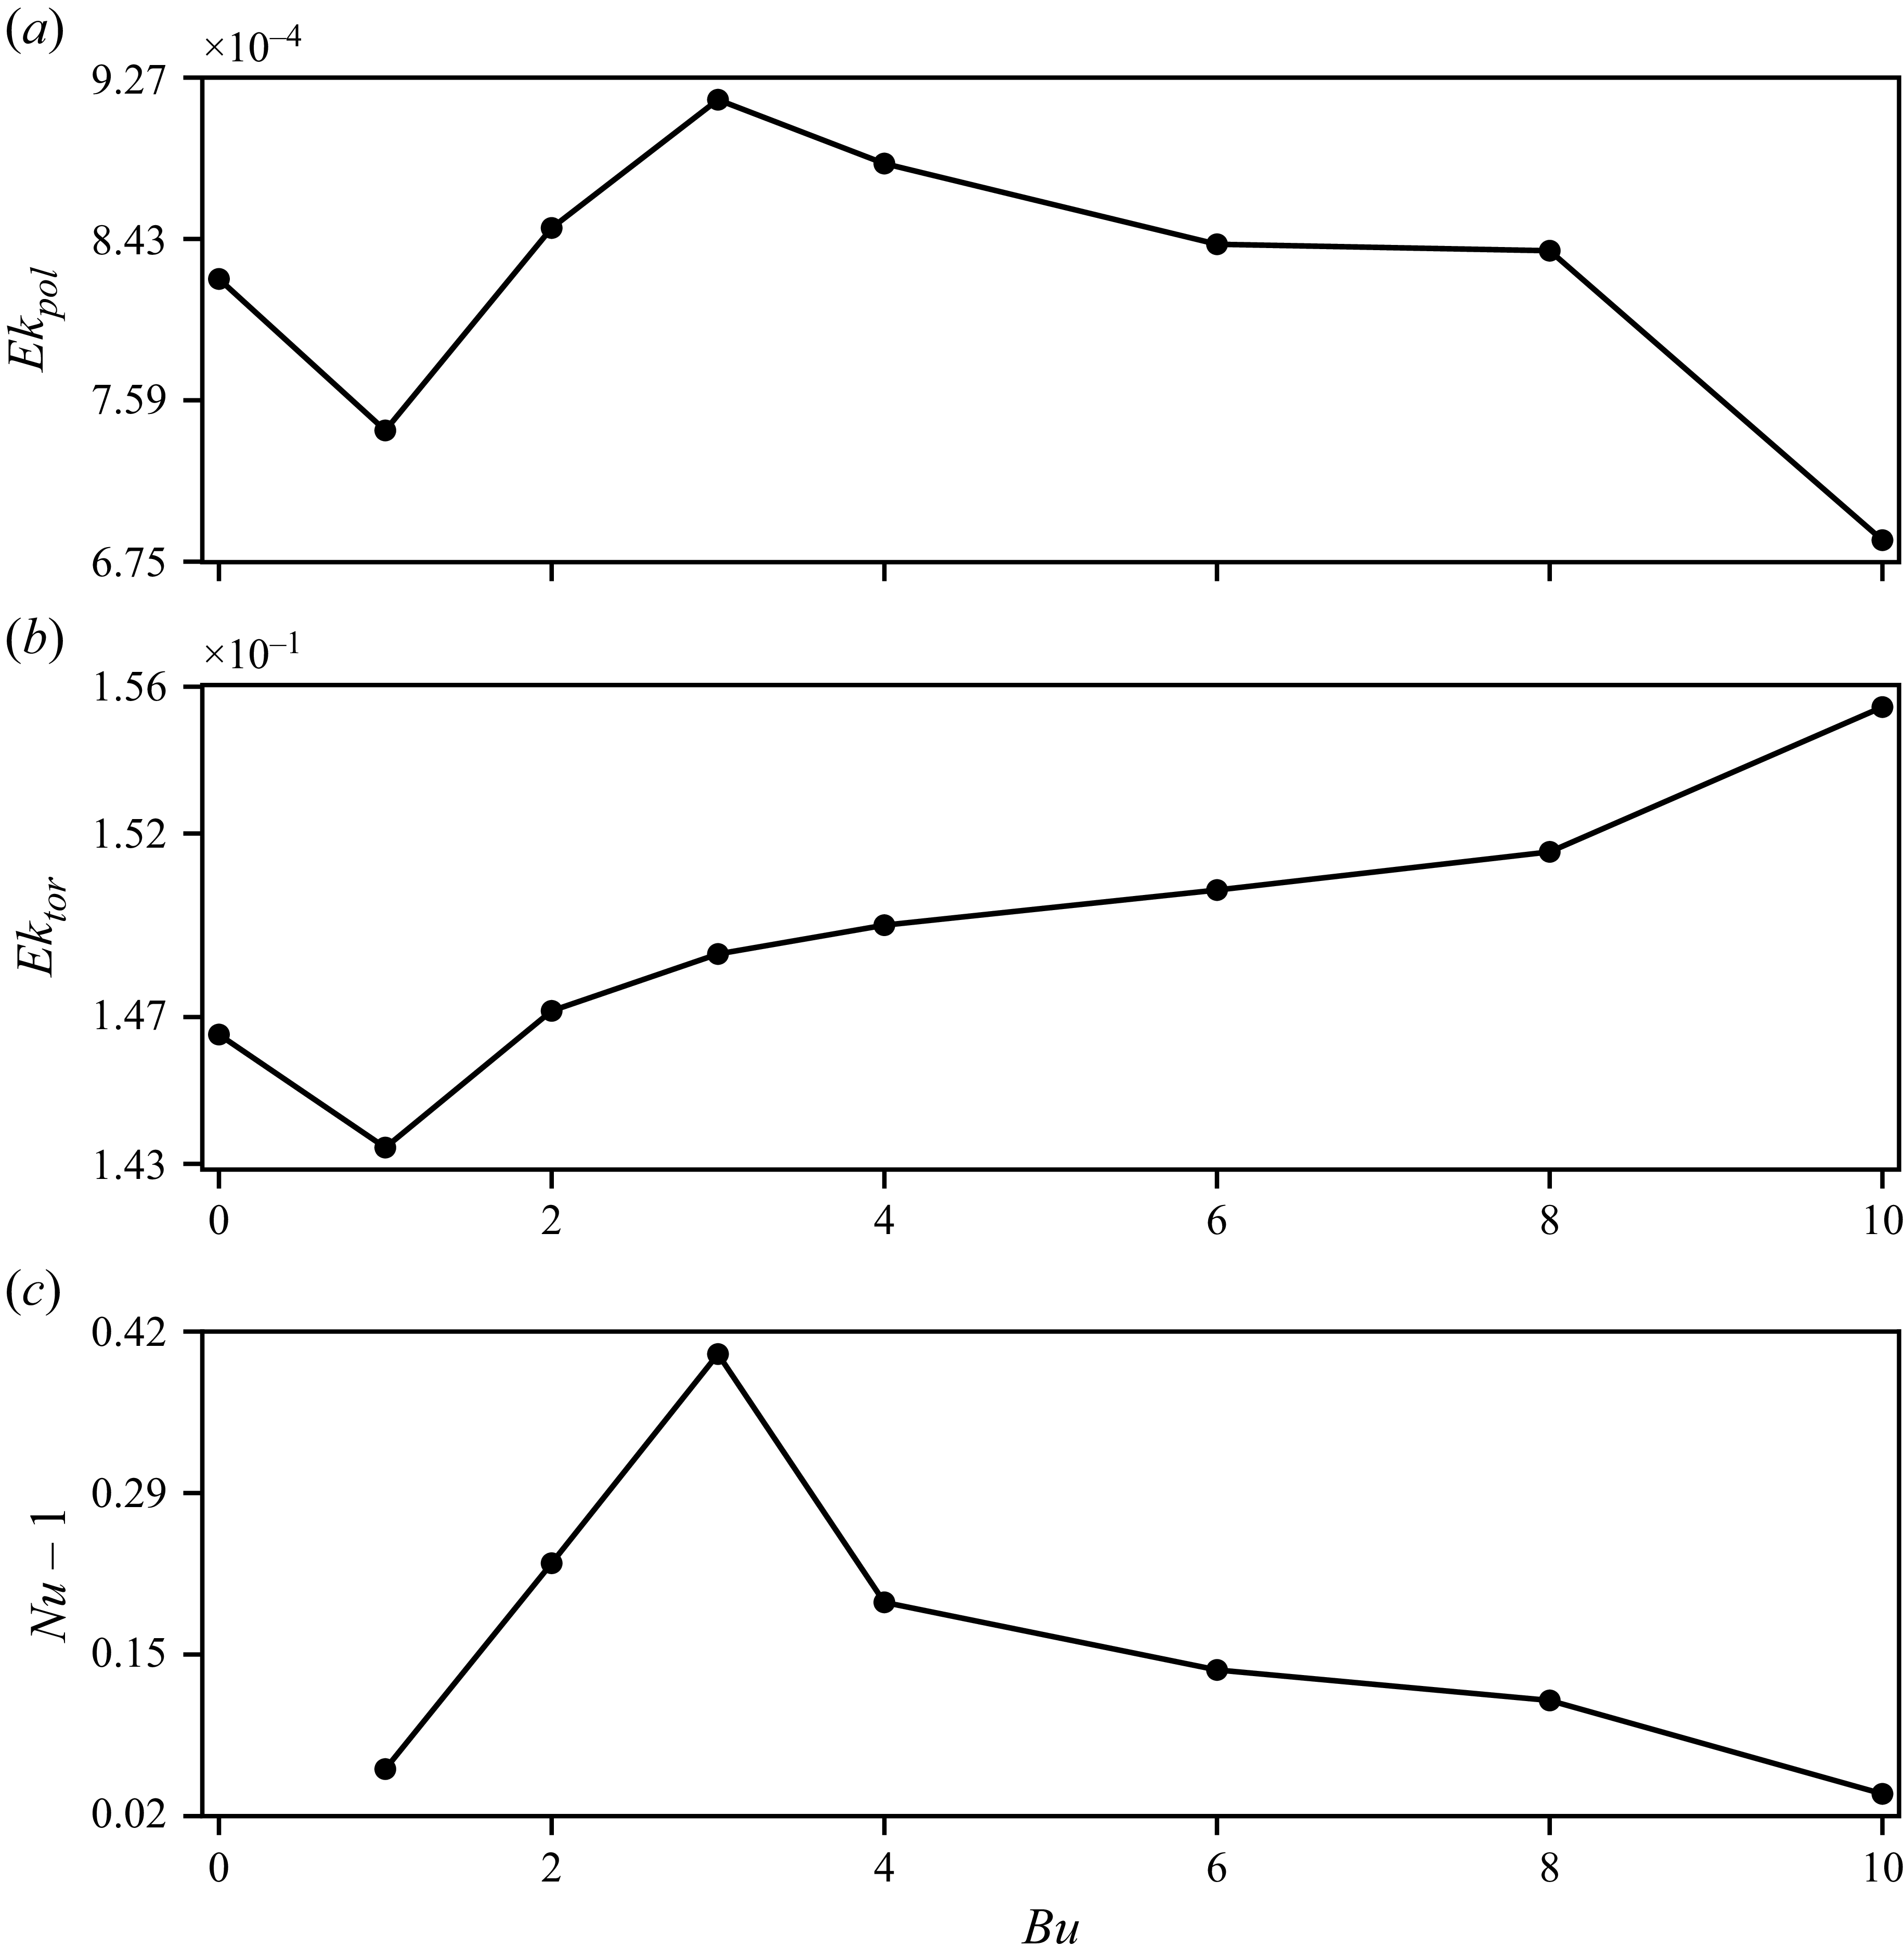
Time-averaged flow properties in the nonlinear saturated state as a function of stratification strength (
 ${\textit{Bu}}$
) for
 ${\textit{Po}}=3\times 10^{-3}$
. (a) Total poloidal kinetic energy (
 ${\textit{Ek}}_{pol}$
); (b) total toroidal kinetic energy (
 ${\textit{Ek}}_{tor}$
); (c) the heat transport enhancement(
 $Nu-1$
) at the outer boundary.

To provide quantitative support for these observations, we show the time-averaged kinetic energy and the heat transport enhancement in figure 11. The poloidal kinetic energy
 ${\textit{Ek}}_{pol}$
, as shown in figure 11(
 $a$
), serves as a simple measure of the vigour of unstable flows as it has no contributions from the spin-over mode. At fixed precessional forcing,
 ${\textit{Ek}}_{pol}$
exhibits a non-monotonic dependence on stratification. It is slightly suppressed at around
 ${\textit{Bu}}=1$
and then enhanced in the range of
 $2\leq Bu\leq 8$
, peaking at around
 ${\textit{Bu}}=3$
. Further increasing stratification to
 ${\textit{Bu}}=10$
leads to a rapid decrease in
 ${\textit{Ek}}_{pol}$
, reflecting the suppression of the radial motions by the strong stratification. The overall trend of
 ${\textit{Ek}}_{pol}$
closely mirrors the instability threshold shown in figure 2, with the maximum poloidal energy occurring at the moderate stratification level where the linear instability threshold is minimised. This correlation supports our conclusion that the precessional instability is enhanced when the Brunt–Väisälä frequency is comparable to the rotation frequency. Consistent with the
 ${\textit{Ek}}_{pol}$
, the heat transport enhancement (
 $Nu-1$
), shown in figure 11(
 $c$
), follows a qualitatively similar trend. The heat transport initially increases with stratification, peaks at the same moderate stratification (
 ${\textit{Bu}}=3$
) as the poloidal energy, and then decreases at higher Burger numbers. This strong correlation confirms that the vigorous radial motions associated with the excited gravito-inertial waves effectively promote mixing and heat transport in the fluid interior. In contrast, the toroidal kinetic energy,
 ${\textit{Ek}}_{tor}$
, which is three orders of magnitude larger and dominated by the spin-over mode and differential rotation, shows a general increase with stratification for
 ${\textit{Bu}} \gt 1$
, reaching its absolute maximum at
 ${\textit{Bu}}=10$
. This trend can be attributed to the angular momentum transport driven by gravito-inertial waves, which enhances the differential rotation (as clearly shown in figure 10
 $a$
) and consequently increases the toroidal kinetic energy.
4. Conclusion
To examine the effect of stable stratification on precessional instability, we carried out a series of numerical simulations of precession-driven flows in a stably stratified spherical shell at relatively low Ekman number (
 $E=10^{-5}$
). We show that stable stratification significantly modifies the structure of the base flow, the onset of precessional instability and the subsequent nonlinear evolution of precession-driven flows.
For the stable base flow under weak precessional forcing, the stable stratification has minimal impact on the spin-over mode when the Brunt–Väisälä frequency is smaller than or comparable to the rotation frequency. The major effect of stratification is on the much weaker secondary flow, which transforms from the conical-shear layers in the neutral fluid into gravito-inertial wave structures that localise near the rotation axis. However, when the Brunt–Väisälä frequency exceeds the rotation frequency throughout the shell, distinct differential rotations are driven in the bulk on top of the spin-over mode even under weak precessional forcing.
Contrary to previous studies suggesting that stable stratification always suppresses precessional instability (Wei & Tilgner Reference Wei and Tilgner2013), we find that stratification can make the precession-driven flows more unstable when the Brunt–Väisälä frequency in the bulk is comparable to the rotation frequency. Analysis of the spatial and temporal characteristics of the unstable flows reveals that the instability arises from triadic resonances between the basic precessional flow and a pair of gravito-inertial waves. We find that the linear instability threshold reaches its minimum at a moderate stratification around
 ${\textit{Bu}}=6$
. Our analysis of the base flow suggests this is because the secondary flow’s amplitude peaks at this stratification, providing a stronger resonant forcing that more efficiently drives the instability.
In the strongly forced, nonlinear regime, this instability enhancement manifests as vigorous, small-scale flow structures. Crucially, the excited gravito-inertial waves drive efficient angular momentum transport, establishing strong differential rotation in the fluid shell. In this nonlinear regime, the poloidal kinetic energy, which reflects the vigour of the unstable flow, is enhanced at moderate stratification of
 $2\leq Bu\leq 8$
. This intensification of poloidal activity promotes mixing, resulting in an increase in heat transport within the same parameter range. Both the linear onset of the instability and the nonlinear saturation of the instability strongly support that the stable stratification can enhance the precessional instability when the Brunt–Väisälä frequency is comparable to the rotation frequency in the bulk. However, when the Brunt–Väisälä frequency becomes much larger than the rotation frequency, the stable stratification tends to stabilise precession-driven flows.
This study has focused on the purely hydrodynamic regime and highlighting the significant role of stable stratification in precession-driven flows, particularly when the Brunt–Väisälä frequency is comparable to the rotation frequency. While our numerical model is highly idealised and the imposed stratification profiles may not fully reflect realistic planetary interiors, we believe the physical mechanisms identified here remain relevant. In particular, we emphasise the role of gravito-inertial waves in triggering precessional instability and driving differential rotation in stably stratified, precessing fluids. Future research will further explore the role of precession-driven flows under stable stratification in angular momentum transport and mixing, and will assess their dynamo capability by incorporating magnetohydrodynamics.
Supplementary movie
Supplementary movie is available at https://doi.org/10.1017/jfm.2026.11289.
Acknowledgements
We thank anonymous reviewers for their constructive comments and suggestions that helped improve the manuscript. Numerical simulations made use of the open-source code MagIC, which is freely available at https://magic-sph.github.io/. We are grateful to T. Gastine for his assistance in setting up the stable stratification in the MagIC code.
Funding
This study was supported by the National Natural Science Foundation of China (grant nos 12250012, 42350002, 42174215). Numerical calculations were performed on the Taiyi cluster supported by the Center for Computational Science and Engineering of Southern University of Science and Technology.
Declaration of interests
The authors report no conflict of interest.
Data availability statement
A dataset, which contains the control parameters and the corresponding time-averaged diagnostic quantities for all numerical simulations reported in this study, is available at https://zenodo.org/records/17549858.