Introduction
Obesity is defined as an abnormal accumulation of fat that poses a health risk, caused mainly by a long-term energy imbalance between calories consumed and calories expended. 1 In addition, obesity has a multifactorial etiology, and it is maintained by complex interactions of genetic, environmental, and psychosocial factors. Reference Zheng, Lamb and Grimes2
In 2020, 38% of the world’s population was overweight or obese (BMI ≥ 25 kg/m2), and it is estimated that this percentage will increase to 50% by 2035, representing more than 4 billion people (excluding children under the age of 5). The prevalence of obesity in childhood and adolescence is estimated to increase from 10% to 20% in boys and from 8% to 18% in girls between 2020 and 2035. 3
The prenatal, intrauterine, postnatal, and pubertal periods are critical periods of development. Events during these periods can influence normal development and have early and/or late direct effects on the health of the offspring. Among the factors that interfere with development during these critical periods are nutrition, hormones, and physical stimuli such as temperature, the light-dark cycle, and other stressful events. Reference de Moura and Passos4,Reference Gluckman, Hanson and Buklijas5
In this context, it is known that postnatal events, including nutritional status, can lead to important repercussions in adulthood and the next generations. In recent decades, the Developmental Origins of Health and Disease (DOHaD), originally focused on maternal health, has combined experimental, clinical, epidemiological, and public health research to understand how events in early life affect the risk of morbidity in adulthood. Reference Silveira, Portella, Goldani and Barbieri6 However, research has also correlated the quality of paternal health with sperm quality, embryo development, and offspring health. Reference Batra, Norman, Morgan and Watkins7 In this context, studies in rodents provide evidence that paternal obesity is associated with an increased risk of metabolic and reproductive disorders in the offspring in adulthood. Reference Sanchez-Garrido, Ruiz-Pino and Velasco8,Reference Billah, Khatiwada, Morris and Maloney9 This strand is an extension of the DOHaD paradigm, known as Origins of Paternal Health and Disease (POHaD). Reference Soubry10
A well-known model of postnatal overnutrition in rodents is the litter size reduction. In this method, the animals are allocated to a small litter (SL), with 3 or 4 pups, compared to the control, normal litter (NL) with 8 to 12 animals, which reduces competition for milk during lactation and increases calorie intake. Some studies have observed that the milk is rich in lipids, especially triglycerides. Reference Habbout, Li, Rochette and Vergely11 In this context, this lactation overnutrition accounts for obesity and its comorbidities, from childhood until adulthood. Reference Souza, Moura and Lisboa12
The model of lactation overfeeding has been used to evaluate the effects of early obesity on developmental programming, and some studies have focused on the relationship of maternal obesity and the transgenerational consequences to their offspring. Reference Wang, Ji and Yu13–Reference Ferreira, Ferreira-Junior and Amaral15 However, few studies have fragmentarily evaluated the effects of paternal obesity induced by lactation overnutrition in the offspring. Reference Pentinat, Ramon-Krauel, Cebria, Diaz and Jimenez-Chillaron16–Reference Ribó, Ramon-Krauel and Marimon-Escude18 In this perspective, this study was designed to evaluate the effects of paternal obesity induced by neonatal overnutrition on their male and female offspring, without any insult, especially metabolic and reproductive outcomes, in the prepubertal phase, a critical period of development, and in adult life.
Methods
Animals
Male Wistar rats were obtained from the mating of females with males from the Central Bioterium of Londrina State University (UEL). When sperm were observed on the vaginal smear, pregnancy was confirmed, and each female rat was placed in an individual cage. The day of birth was considered postnatal day (PND) 0. On this day, the litter size was adjusted to 3 pups, 2 males and 1 female (small litter – SL), in the group to induce neonatal overfeeding, or 10 pups, 5 males and 5 females (normal litter – NL), control group. Reference Wunderlich, Martins and de Souza19,Reference Wunderlich, Stopa and Martins20 To obtain non-obese fathers, 15 normal-litter (NL) litters were used, whereas 14 small-litter (SL) litters were used to obtain obese fathers.
As the focus of the present study was to elucidate the effects of paternal early-life obesity on the metabolic and reproductive outcomes of the offspring, female SL rats were not used for breeding the second generation. For this purpose, in a second mating stage, only males (fathers) obtained from reduced and normal litters (only one male per litter), on PDN 90, were mated with control females of the same age to get their offspring (males and females). The litter size of these offspring was adjusted to 8 pups (4 males and 4 females), and the animals were divided into two groups: normal litter offspring (NLO) and small litter offspring (SLO). Cages consisted of 4 females and 4 males housed separately according to their sex and group. Reference Guergolette, Aguiar and Stopa21 To avoid litter effects, only one male and one female from each litter were selected to produce offspring at each age. Any excess pups that were not included in these fosterings were euthanized by decapitation.
The animals were housed within the vivarium of the Department of Physiological Sciences, maintained in controlled conditions of light (12-hour light/dark cycle) and temperature (22°C ± 2 °C), with access to water and food ad libitum, except experiments involving food deprivation, which will be detailed in the next sections. All experimental procedures were conducted at the Department of Physiological Sciences, starting from 2 pm.
The ethical conduct of these experiments is in accordance with the Brazilian Society of Science in Laboratory Animals (CONCEA) and has been duly recognized and approved by the Ethics Committee for the Use of Experimental Animals (CEUA n° 18310.2019.03, OF. CEUA n° 164/2019).
Experimental protocols
Experimental Protocol 1 – effects of paternal obesity induced by neonatal overnutrition on biometric, metabolic, and reproductive parameters in the prepubertal offspring.
On PND 29 for females and PND 31 for males, the food was removed from the animals at 8 am, and a glucose tolerance test was performed at 2 pm. On PND 30 for female offspring and on PND 32 for male offspring, the food was again removed from the animals at 8 am, the animals were weighed, and the naso-anal distance was measured. At 2 pm, animals were euthanized by decapitation, when blood was collected for biochemical plasma analyses, and the following organs were removed and weighed: left and right testes, visceral white adipose tissues, left and right ovaries, uterus, left gastrocnemius, and soleus muscles. The left tibia was also collected, measured, and weighed.
Experimental Protocol 2 – effects of paternal obesity induced by neonatal overnutrition on biometric, metabolic, and reproductive parameters in adult offspring.
In this second protocol, body weight and food intake were measured every 5 days from PND 25 to 90. On PND 89, the food was removed from the animals at 8 am, and a glucose tolerance test was performed at 2 pm. On PND 90 for male offspring and upon the first occurrence of proestrus after PND 90 for female offspring, the food was again removed from the animals at 8 am, the animals were weighed, and the naso-anal distance was measured. At 2 pm, animals were euthanized by decapitation, when blood was collected for biochemical plasma analyses, and the following organs were removed and weighed: left and right testes, visceral white adipose tissues, left and right ovaries, uterus, left gastrocnemius, and soleus muscles. The left tibia was also collected, measured, and weighed.
Lee index
The Lee index, similar to the body mass index (BMI) in humans, may be used as a predictor of obesity in rats. For this, in the morning of the euthanasia day, the Lee index was calculated by dividing the cubic root of body weight in grams by naso-anal length in centimeters. Reference Bernardis and Patterson22
Triglyceride and glucose index (TYG)
Triglyceride and glucose concentrations were used to screen for insulin resistance. The calculation used to determine the TyG index was TyG = ln [fasting triglyceride (mg/dl) × fasting glucose (mg/dl)] /2. Reference Guerrero-Romero, Simental-Mendía and González-Ortiz23
Measurement of plasma concentrations of total cholesterol, triglycerides, high-density lipoproteins (HDL), glucose, testosterone, estradiol, LH, and FSH
Following euthanasia, blood samples were collected into heparinized tubes. These samples were subsequently centrifuged at 2500 rpm at 4°C for 20 minutes. The resulting plasma was carefully stored at −20°C, for subsequent assessments of total cholesterol, triglycerides, and high-density lipoproteins (HDL). Spectrophotometry was used for the determination of plasma concentrations (commercial kits, Vida Biotecnologia, MG), glucose (commercial kit – Interkit), and enzyme immunoassay – ELISA – for the determination of estradiol (EIA 2693; DRG Instruments GmbH), testosterone (EIA-1559; DRG Instruments GmbH), LH, and FSH (Bio Advance Diagnostics), according to the manufacturer’s instructions.
Glucose tolerance test (GTT)
For GTT, after 6 hours of food deprivation, at 2 pm, a small blood sample was collected from the tail of the animals to establish basal glucose levels. This was achieved using the Accu-Check Advantage II test strip (Roche, Taquara, RJ, Brazil) in conjunction with a blood glucose measurement device. Following the basal glucose measurement, an intraperitoneal administration of glucose was performed at a concentration of 25% and a dosage of 1.0 g/kg body weight. Blood glucose levels were then monitored 15, 30, 60, and 120 minutes after glucose administration. After the glucose tolerance test, food was returned to the animal’s cages. Reference Guergolette, Aguiar and Stopa21
Puberty onset: vaginal opening, first estrus, and preputial separation
For female offspring, the puberty onset was determined by the first estrus and the vaginal opening. For this, daily observations of the vagina were initiated on PND 25 until the occurrence of vaginal opening. Once vaginal opening was detected, daily vaginal smears were conducted until the occurrence of the first estrus. Reference Goldman, Murr and Cooper24 In males, the onset of puberty was determined by the occurrence of manual preputial separation, by daily observations from PND 30. Reference Borges, Dias and Rosa25
Determination of the estrous cycle
Daily vaginal smears were collected at 10 am. Samples were collected using eye droppers and rinsed between lavages to ensure the removal of any residual cells from the dropper wall. One or two drops were placed on a histological slide. Reference Guergolette, Aguiar and Stopa21 Subsequently, the slide was examined under a light microscope, utilizing a magnification of 10x. This microscopic analysis was assessed cell proportions and types, as outlined in previous research. Reference Guergolette, Aguiar and Stopa21 These analyses were used in the following parameters: cyclicity onset (the last day of the 2nd normalized cycle); proestrus coefficient, estrus coefficient, and diestrus I and II coefficient (values were obtained by the ratio of the number of occurrences of each phase and the number of days evaluated, multiplied by 100); and duration of the cycle (number of days between one estrous phase to the next).
Statistical analysis
An exploratory analysis was assessed the normal distribution (Shapiro-Wilk test) and homogeneity (Levene’s test). Variables that demonstrated both normal distribution and homogeneity were subjected to Student’s t-test or repeated measures ANOVA (RM A NOVA), which were expressed graphically by means ± the standard error mean (SEM). The outcomes were presented as t(df) = t value, p value. For the variables body weight, food intake, and glucose tolerance test (GTT), RM ANOVA was employed. In these cases, the within-subject factor was represented by days or minutes, while groups served as the between-subject factor. When normal distribution and/or homogeneity of variance were not observed, the Mann-Whitney test was applied, expressed graphically by the median and 1st and 3rd interquartile intervals. The results were presented as U-value and p-value. Significance was attributed to differences when p < 0.05.
Results
Fathers
After weaning, from PND 21 to 90, there was interaction between the within-subject factor (days) and the between-subject factor (groups) F(14, 404) = 10.75, p < 0.0001] in the body weight of male rats (fathers) reared in NL or SL (Fig. 1a). Male rats from SL presented increased (p < 0.05) body weight from PND 21 to 90, compared to NL male rats (Supplementary File 1).
Body weight (g) curve from PND 4–30 (a, b), Lee index (g1/3) (c, d), naso-anal distance (cm) (e, f), and tibia length (cm) (g, h), of prepubertal female (PND 30) and male (PND 32) offspring of NL (Normal litter) and SL (Small litter) fathers. Data are expressed as mean ± SEM. *p < 0.05.

Prepuberal offspring
From PDN 4 to 30, there was no interaction between the within-subject factor (days) and the between-subject factor (groups) [F(7, 146) = 0.4771, p = 0.85], and no effects of groups [F(1, 21) = 0.1935, p = 0.6645] in the body weight of female offspring of NL or SL fathers (Fig. 1a).
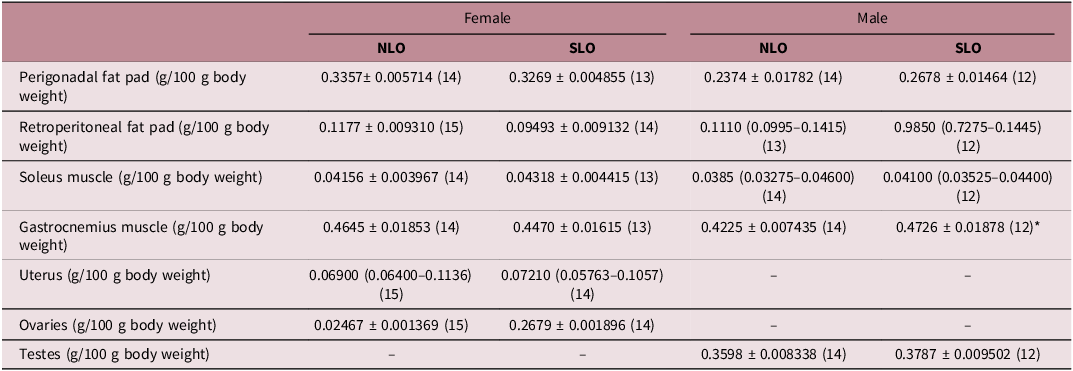
In the prepubertal, female offspring of small litter fathers showed no differences on Lee index (Fig. 1c) [t(25) = 1.164, p = 0.2556], naso-anal distance (Fig. 1e) [t(24) = 0.696, p = 0.4931], and tibia length (Fig. 1g) [t(25) = 0.7782, p = 0.4437], compared to the female offspring of normal litter fathers. In addition, there was no difference between the groups on the weights of perigonadal [t(25) = 1.164, p = 0.2556] and retroperitoneal adipose tissues [t(27) = 1.745, p = 0.0923] and on the weights of ovaries [t(27) = 0.9154, p = 0.3681], uterus [U = 99, p = 0.8047], gastrocnemius [t(25) = 0.7052, p = 0.4872] and soleus muscles [t(25) = 2.732, p = 0.7869] (Table 1). Finally, the female SLO group showed lower plasma levels of HDL [U = 11, p = 0.0003] than the female NLO group (Fig. 2d), with no differences in triglycerides (Fig. 2a) [U = 78, p = 0.7623] and total cholesterol (Fig. 2c) [t(22) = 2.067, p = 0.0507] between the groups. There was no interaction between the within-subject factor (minutes) and the between-subject factor (groups) [F(4, 84) = 0.2499, p = 0.909], and no effects of groups [F(1, 21) = 0.01587, p = 0.909] in the glycemia after glucose overload of female offspring of fathers of NL or SL (Fig. 2g). Accordingly, there wasn’t any difference in the AUC of GTT [t(21) = 0.0895, p = 0.9295] between the groups (Fig. 2h). However, in pre-puberty, the female offspring of parents from small litters showed a higher glucose concentration when compared to the control group (Fig. 2k) [t(22) = 2.753, p = 0.0116], without difference in Tyg index (Fig. 2l) [t(22) = 0.6702, p = 0.5097].
Plasma values of triglycerides (mg/dL) (a, b), total cholesterol (mg/dL) (c, e), HDL cholesterol (mg/dL) (d, f), glycemia during glucose tolerance test (GTT; mg/dL) (g, i), area under curve (AUC) of GTT from 0 to 120 min (mg/dL) (h, j), plasma values of glucose (mg/dL) (k, m) and TyG index (l, n) of prepubertal female (PND 30) and male (PND 32) offspring of NL (Normal litter) and SL (Small litter) fathers. The type of graphical representation varied according to the statistical analysis performed. Box plots were used to display the median and first and third interquartile ranges for nonparametric data, whereas bar graphs were used to present the mean and standard error of the mean (SEM) for parametric data. *p < 0.05.

Weights (g/100 body weight) of perigonadal and retroperitoneal fat pads, soleus and gastrocnemius muscles, uterus, ovaries and testes of prepubertal male (PND 32) and female (PND 30) offspring of normal (NLO) and small (SLO) litter fathers

Number of animals is shown in parentheses. Data are expressed as mean ± SEM for Student’s t-test and median (1st–3rd interquartile range) for Mann–Whitney test. *p < 0.05 NLO versus SLO.
From PDN 4 to 30, there was no interaction between the within-subject factor (days) and the between-subject factor (groups) [F(7, 160) = 0.3407, p = 0.9341], and no effects of groups [F(1, 160) = 1.262, p = 0.263] in the body weight of male offspring of fathers of NL or SL (Fig. 1b).
The prepuberal male offspring of small litter fathers showed lower Lee index (Fig. 1d) [t(22) = 2.372, p = 0.0268] and tibia length (Fig. 1h) [t(22) = 2.731, p = 0.0122] than the prepuberal male offspring of normal litter fathers, despite increased weight of gastrocnemius muscle [t(24) = 2.622, p = 0.015] (Table 1). In addition, no differences were observed between the groups in the naso-anal distance (Fig. 1f) [t(20) = 2.028, p = 0.0561], weights of perigonadal [t(24) = 1.290, p = 0.2094] and retroperitoneal adipose tissues [U = 62.5, p = 0.2795], testes [t(24) = 1.5, p = 0.1467], and soleus muscles [U = 79.5, p = 0.8296] (Table 1). In addition, male SLO group also showed decreased levels of HDL (Fig. 2f) [t(26) = 2.590, p = 0.0155] compared to the male NLO group, with no differences between the groups in triglycerides (Fig. 2b) [U = 78, p = 0.4228) and total cholesterol (Fig. 2e) [t(25) = 1.305, p = 0.2039]. There was no interaction between the within-subject factor (minutes) and the between-subject factor (groups) [F(4, 100) = 0.1676, p = 0.9544], and no effects of groups [F(1, 25) = 0.1776, p = 0.6773] in the glycemia after glucose overload of male offspring of fathers of NL or SL (Fig. 2i). Accordingly, there wasn’t any difference in the AUC of GTT [t(25) = 1.804, p = 0.7858] between the groups (Fig. 2j). Finally, there was no difference in blood glucose (Fig. 2m) [t(26) = 0.2169, p = 0.83] and in the Tyg Index (Fig. 2n) [t(26) = 0.1296, p = 0.8979].
Adult offspring
From PDN 30 to 90, there was an interaction between the within-subject factor (days) and the between-subject factor (groups) [F(12, 282) = 2.74, p = 0.0016] in the body weight of female offspring of fathers of NL or SL; however, there were no differences in the body weight between the groups throughout these days (Fig. 3a). There was no interaction between the within-subject factor (days) and the between-subject factor (groups) [F(12, 272) = 0.5825, p = 0.8558], and no effects of groups [F(1, 24) = 0.02173, p = 0.8840] in the food intake of female offspring of fathers of NL or SL from PND 30 to 90 (Fig. 3c).
Body weight (g) from PND 25–90 (a, b), food intake (g/100 g body weight) from PND 25–90 (c, d), Lee index (g1/3) (e, f), naso-anal distance (cm) (g, h), tibia length (cm) (i, j) of adult female (upon the first occurrence of proestrus after PND 90) and male (PND 90) offspring of NL (Normal litter) and SL (Small litter) fathers. The type of graphical representation varied according to the statistical analysis performed. Box plots were used to display the median and first and third interquartile ranges for nonparametric data, whereas bar graphs were used to present the mean and standard error of the mean (SEM) for parametric data. *p < 0.05.

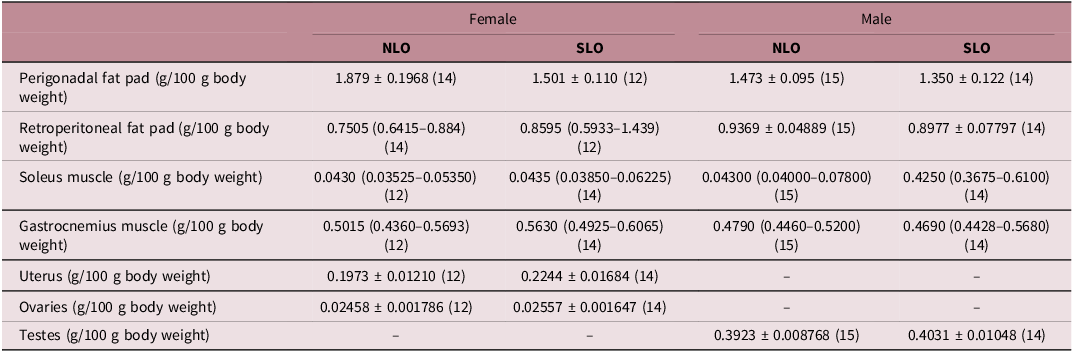
In the adulthood of female offspring, there were no differences in the Lee index (Fig. 3e) [t(25) = 0.04846, p = 0.9618], naso-anal distance (Fig. 3g)[t(20) = 0.2338, p = 0.8175], tibia length (Fig. 3i) [t(24) = 1.173, p = 0.2522], perigonadal [t(24) = 1.101, p = 0.1224], and retroperitoneal adipose tissues [U = 59, p = 0.2067], and gastrocnemius [U = 59, p = 0.2116] and soleus muscles [U = 79, p = 0.81] (Table 2). The groups also did not exhibit differences in triglycerides (Fig. 4a) [t(26) = 0.07210, p = 0.9431], total cholesterol (Fig. 4c) [U = 100, p = 0.8467], and HDL levels (Fig. 4d) [t(27) = 1.561, p = 0.1302]. There was no interaction between the within-subject factor (minutes) and the between-subject factor (groups) [F(4, 104) = 0.05424, p = 0.9944], and no effects of groups [F(1, 26) = 0.3718, p = 0.5473] in the glycemia after glucose overload of female offspring of fathers of NL or SL (Fig. 4g). Accordingly, there were no significant differences in the AUC of the GTT (Fig. 4h) [t(31) = 0.1781, p = 0.8598]. Finally, there were also no differences between the groups in glucose concentration (Fig. 4k) [t(22) = 0.5587, p = 0.5820] and Tyg Index (Fig. 4l) [t(22) = 0.09387, p = 0.9261] between the female offspring of fathers from normal litter and small litter.
Plasma values of triglycerides (mg/dL) (a, b), total cholesterol (mg/dL) (c, e), HDL cholesterol (mg/dL) (d, f), glycemia during glucose tolerance test (GTT; mg/dL) (g, i), area under curve (AUC) of GTT from 0 to 120 min (mg/dL) (h, j), plasma values of glucose (mg/dL) (k, m) and tyG index (l, n) of adult female (upon the first occurrence of proestrus after PND 90) and male (PND 90) offspring of NL (Normal litter) and SL (Small litter) fathers. The type of graphical representation varied according to the statistical analysis performed. Box plots were used to display the median and first and third interquartile ranges for nonparametric data, whereas bar graphs were used to present the mean and standard error of the mean (SEM) for parametric data. *p < 0.05.

Weights (g/100 body weight) of perigonadal and retroperitoneal fat pads, soleus and gastrocnemius muscles, uterus, ovaries, and testes of adult male (PND 90) and female (upon the first occurrence of proestrus after PND 90) offspring of normal (NLO) and small (SLO) litters fathers

Number of animals is shown in parentheses. Data expressed as mean ± SEM for Student’s t-test and median (1st–3rd interquartile range) for Mann–Whitney test. *p < 0.05 NLO versus SLO.
During sexual development, the female SLO demonstrated a delay in vaginal opening (Fig. 5b) [t (20) = 2.459, p = 0.0232], compared to NLO groups, without differences between the groups in the first estrus (Fig. 5c) [U = 42, p = 0.4107] and cyclicity onset (Fig. 5d) [t(20) = 0.2778, p = 0.7840]. In addition, adult female offspring of small litter fathers showed a higher coefficient of diestrus I and II (Fig. 5f) [t(20) = 3.764, p = 0.0024] and a lower estrus coefficient (Fig. 5h) [U = 25.5, p = 0.0176] than adult female offspring of normal litter fathers. There were no differences between the groups in the proestrus coefficient (Fig. 5g) [t(20) = 1.807, p = 0.0858], cycle duration (Fig. 5e) [U = 36, p = 0.0988], weights of ovaries [t(24) = 0.4069, p = 0.6877], and uterus [t(24) = 1.271, p = 0.2159] (Table 2). Finally, female offspring from fathers of small litters had higher estradiol concentrations in adulthood than females from the control group (Fig. 6a) [t(15) = 4.319, p = 0.0006], without showing any difference in the plasma concentrations of LH (Fig. 6c) [t(10) = 0.2427, p = 0.8079] and FSH (Fig. 6e) [t (14) = 0.4431, p = 0.6644].
Preputial separation (PND) (a), vaginal opening (PND) (b), first estrus (PND) (c), cyclicity onset (PND) (d), cycle duration (PND) (e), diestrus coefficient (%) (f), proestrus coefficient (%) (g), estrus coefficient (%) (h) of female and male (only preputial separation) offspring of NL (Normal litter) and SL (Small litter) fathers. The type of graphical representation varied according to the statistical analysis performed. Box plots were used to display the median and first and third interquartile ranges for nonparametric data, whereas bar graphs were used to present the mean and standard error of the mean (SEM) for parametric data. *p < 0.05.

Estradiol (pg/mL) (a), testosterone (ng/mL) (b), LH (UI/L) (c, d), FSH (UI/L) (e, f) of adult female (upon the first occurrence of proestrus after PND 90) and male (PND 90) of NL (Normal litter) and SL (Small litter) fathers. The type of graphical representation varied according to the statistical analysis performed. Box plots were used to display the median and first and third interquartile ranges for nonparametric data, whereas bar graphs were used to present the mean and standard error of the mean (SEM) for parametric data. *p < 0.05.

In males, from PDN 30 to 90, there was no interaction between the within-subject factor (days) and the between-subject factor (groups) [F(12, 303) = 1.763, p = 0.0536], and no effects of groups [F(1, 26) = 0.06251, p = 0.8045] in the body weight of offspring of fathers of NL or SL (Fig. 3b). There was no interaction between the within-subject factor (days) and the between-subject factor (groups) [F(12, 292) = 0.6332, p = 0.8134], with effects of groups [F(1, 26) = 6.407, p = 0.0178] in the food intake of male offspring of fathers of NL or SL from PND 30 to 90. These data indicate that male SLO had lower food intake than male NLO during this period (Fig. 3d).
There were no differences between adult male offspring of NL and SL fathers in the Lee index [U = 79, p = 0.8137] (Fig. 3f), naso-anal distance [t(20) = 0.06759, p = 0.9468] (Fig. 3h), tibia length [U = 99.5, p = 0.8142] (Fig. 3j), weights of perigonadal [t(27) = 0.7974, p = 0.4322] and retroperitoneal [t(27) = 0.4324, p = 0.6689] adipose tissues, testes [t(27) = 0.7946, p = 0.4338], and gastrocnemius [U = 105, p > 0.9999] and soleus muscles [U = 91, p = 0.5535] (Table 2). However, the adult male SLO animals exhibited decreased levels of triglycerides [t(29) = 2.113, p = 0.0433] compared to the adult male NLO (Fig. 3b). No differences were observed between the groups in total cholesterol [U = 115.5, p = 0.8685] (Fig. 3e) and HDL [U = 107, p = 0.6185] (Fig. 3f). Lastly, there was an interaction between the within-subject factor (minutes) and the between-subject factor (groups) F (4, 84) = 6.242, p = 0.0002] in the glycemia after glucose overload of male offspring of fathers of NL or SL. Adult male offspring of SL fathers showed higher (p < 0.01) glycemic peak after 15 min of glucose overload than adult male offspring of NL fathers (Fig. 3i). However, there was no significant difference between the groups in the AUC of the GTT [t(22) = 0.8822, p = 0.3872] (Fig. 3j). Additionally, there was no difference between the control group and the experimental group in glucose concentration [U = 70.5, p = 0.7368] (Fig. 3m); however, the male offspring of fathers with neonatal overnutrition had a lower TyG index compared to offspring of normal litter [t(24) = 2.376, p = 0.0258] (Fig. 3n).
Finally, there was no difference in the preputial separation (Fig. 5a) and in testosterone concentration between groups [t(15) = 0.0692, p = 0.9457] (Fig. 6b), as well as in the plasma concentrations of LH [t(10) = 0.0435, p = 0.9661] (Fig. 6d) and FSH [t(14) = 0.8958, p = 0.3855 (Fig. 6f).
Discussion
The present study provides the first evidence that paternal lactational overnutrition affects metabolic and reproductive parameters in offspring fed a standard diet. Importantly, these effects were sex-specific: male offspring were more susceptible to metabolic alterations, whereas female offspring predominantly exhibited reproductive dysfunctions.
The efficiency of litter size reduction as a model to induce paternal obesity was confirmed by the marked increase in body weight observed in male rats reared in small litters from PND 21 to PND 90. Fathers exposed to this model showed a 19% increase in body weight (412.86 g vs 347.94 g), a magnitude comparable to that reported in diet-induced obesity models. Indeed, previous studies reported paternal body weight increases ranging from no change Reference Oshio, Andreazzi and Lopes26 to 11%, Reference Larqué, Lugo-Martínez and Mendoza27 20%, Reference Ramadan, Abdel-Rehim, El-Tahan, Elblehi, Kamel and Shaker28,Reference Haberman, Menashe and Cohen29 and up to 30%. Reference Ng, Lin, Laybutt, Barres, Owens and Morris30–Reference Lecomte, Maloney, Wang and Morris32 These discrepancies likely reflect differences in the onset and duration of obesogenic insults. Although other metabolic parameters were not evaluated in the present fathers, previous studies from our group demonstrate that adult males reared in small litters exhibit increased adiposity, dyslipidemia, glycemic imbalance, and liver impairments, Reference Souza, Stopa and Martins33,Reference Souza, Stopa and Martins34 reinforcing the validity of this model.
Notably, the offspring were not exposed to any postnatal insult and were raised under identical conditions. Despite this, both male and female prepubertal offspring of fathers with neonatal obesity exhibited reduced HDL levels, indicating early metabolic alterations. Sex-specific outcomes emerged early, as changes in growth and metabolic parameters were observed only in male offspring during prepuberty. These findings are consistent with reports of growth deficits from birth to adulthood in male offspring of high-fat diet HFD–fed fathers, Reference Lecomte, Maloney, Wang and Morris32 supporting the concept that paternal obesity preferentially impairs male offspring growth and metabolism.
In adulthood, metabolic alterations persisted in male offspring, but not in females. Adult male offspring displayed reduced food intake, lower plasma triglycerides, a reduced TyG index, and mild glucose intolerance. The hypophagic profile observed from childhood to adulthood may reflect inherited paternal traits, as adult males reared in small litters also exhibit hypophagia. Reference Souza, Stopa and Martins34 The lower TyG index likely results from reduced triglyceride levels, suggesting that altered food intake influenced metabolic regulation despite unchanged body weight. Although reduced energy expenditure cannot be excluded, further studies are required to address this possibility. The mild glucose intolerance observed in adult male offspring, characterized by an early glycemic peak after glucose overload, suggests an initial disruption in glucose homeostasis. Given the reduced TyG index, this impairment is unlikely to be driven by insulin resistance and may instead reflect altered insulin secretion. Reference Kowalski and Bruce35 Pentinat et al. Reference Pentinat, Ramon-Krauel, Cebria, Diaz and Jimenez-Chillaron16 using a similar litter size reduction model in mice, also reported glucose intolerance in offspring of overfed fathers but attributed this to peripheral insulin resistance accompanied by increased insulin secretion. Differences between these findings may be explained by species-specific responses, as the present study was conducted in rats.
Accumulating evidence suggests that paternal obesity may predispose offspring to latent metabolic syndrome, which may only become evident following a secondary insult, such as post-weaning exposure to a high-fat diet. In line with this hypothesis, Cropley et al. Reference Cropley, Eaton and Aiken36 demonstrated that offspring of obese male mice exhibited metabolic defects only after a dietary challenge. Similarly, Sanchez-Garrido et al. Reference Sanchez-Garrido, Ruiz-Pino and Velasco8 showed that offspring of fathers with obesity induced by litter size reduction were more susceptible to a second metabolic insult.
The absence of major metabolic alterations in adult female offspring supports the protective role of estrogens in female metabolic regulation. Indeed, sex differences in susceptibility to metabolic challenges have been consistently reported. Sanchez-Garrido et al. Reference Sanchez-Garrido, Ruiz-Pino and Velasco8 demonstrated that male offspring of obese fathers were more vulnerable to high-fat diet exposure, exhibiting increased body weight and leptin levels, reduced LH and testosterone, blunted LH responses to kisspeptin, and reduced expression of steroidogenic genes. In contrast, female offspring displayed minimal metabolic or reproductive effects, with reduced LH responsiveness to kisspeptin as the primary alteration. Reference Sanchez-Garrido, Ruiz-Pino and Velasco8 Additionally, studies not involving metabolic programming demonstrated that males are generally more susceptible than females to the anabolic effects of glucocorticoids Reference Stopa, de Souza and Santos37 and to diet-induced obesity. Reference Hong, Stubbins, Smith, Harvey and Núñez38
In contrast to the metabolic resilience observed in females, reproductive dysfunctions were evident in female offspring from puberty through adulthood. Daughters of fathers reared in small litters exhibited delayed puberty onset, estrous cycle dysregulation, and elevated estradiol levels. These alterations are consistent with the neonatal overnutrition model, in which early nutritional disturbances induce long-lasting disruptions in reproductive control. Reference Habbout, Li, Rochette and Vergely11 Although vaginal opening was delayed, the timing of the first estrus was unchanged, suggesting dissociation between these events. This phenomenon may occur when estradiol concentrations are sufficient to induce vaginal maturation but insufficient to trigger the gonadotropin surge required for ovulation. Reference Rivest39 These findings indicate delayed maturation of the hypothalamic–pituitary–ovarian axis and altered endocrine programming in female offspring of fathers with neonatal obesity.
In adulthood, female offspring exhibited increased diestrus coefficients I and II and a reduced estrus coefficient, indicating a predominance of infertile over fertile periods. Elevated estradiol levels in the absence of changes in LH and FSH further suggest ovarian dysfunction and impaired estradiol positive feedback at the pituitary level.
Comparisons with studies using diet-induced paternal obesity in rats reveal both convergent and divergent findings. Metabolically, female offspring exhibited impaired glucose homeostasis or altered lipid profiles, Reference Ramadan, Abdel-Rehim, El-Tahan, Elblehi, Kamel and Shaker28,Reference Ng, Lin, Laybutt, Barres, Owens and Morris30 while both sexes showed increased susceptibility to obesity under high-fat diet challenge. Reference Haberman, Menashe and Cohen29 Adult male offspring displayed reduced growth or adiposity without overt metabolic syndrome Reference Lecomte, Maloney, Wang and Morris32 or impaired lipid deposition and reduced liver and fat mass. Reference Chowdhury, Erlich, Maloney and Morris31 Reproductively, paternal obesity impaired male offspring sperm viability and testosterone levels Reference Larqué, Lugo-Martínez and Mendoza27 and disrupted testicular structure across generations. Reference Oshio, Andreazzi and Lopes26 Female offspring showed normal estrous cyclicity but reduced ovarian reserve. Reference Larqué, Lugo-Martínez and Mendoza27 Variability among studies likely reflects differences in species, strains, dietary composition, timing of exposure, and offspring age.
Few studies have examined offspring outcomes following paternal obesity induced specifically by lactational overnutrition. Available evidence indicates that male offspring develop insulin resistance, glucose intolerance, Reference Pentinat, Ramon-Krauel, Cebria, Diaz and Jimenez-Chillaron16 as previously mentioned, and hepatic steatosis in adulthood. Reference Ribas-Aulinas, Ribó and Casas17 Notably, only one study evaluated sex differences under this model, Reference Sanchez-Garrido, Ruiz-Pino and Velasco8 but offspring were continuously exposed to a high-fat diet, limiting comparisons with offspring maintained on a standard diet.
The transgenerational transmission of these effects is likely mediated by epigenetic modifications in the male germline. Early-life nutritional exposures have been shown to alter DNA methylation, small non-coding RNAs, and histone modifications in germ cells. Reference Gluckman, Hanson and Beedle40–Reference Soubry, Murphy and Wang42 In line with this, early overfeeding and childhood obesity markedly alter global DNA methylation patterns in sperm, supporting epigenetic inheritance of environmentally induced phenotypes. Reference Ribó, Ramon-Krauel and Marimon-Escude18
In summary, this study demonstrates for the first time that, in the absence of postnatal dietary challenges, paternal lactational overnutrition induces sex-specific outcomes in offspring: metabolic dysfunctions in males and reproductive impairments in females. These findings highlight the importance of paternal early-life health in shaping offspring metabolic and reproductive trajectories. Thus, paternal lifestyle and nutritional status should be considered integral components of strategies aimed at improving reproductive and metabolic outcomes and long-term offspring health.
Supplementary material
The supplementary material for this article can be found at https://doi.org/10.1017/S2040174426100440.
Acknowledgments
None.
Financial support
This work received financial support from the Conselho Nacional de Desenvolvimento Científico e Tecnológico (CNPq), Fundação Araucária de Apoio ao Desenvolvimento Científico e Tecnológico do Estado do Paraná (FA), and Coordenação de Aperfeiçoamento de Pessoal de Nível Superior (CAPES – Finance Code 001), Brazil. The authors are grateful for the Governo do Estado do Paraná, Conselho Paranaense de Ciência e Tecnologia, e Secretaria de Estado da Ciência, Tecnologia, e Ensino Superior (SETI) (dotação orçamentária # 4560.19.571.06.6153; eprotocolo 21.234.745-0).
Competing interests
None.
Ethical standard
The authors assert that all procedures contributing to this work comply with the ethical standards of the Brazilian Society of Science in Laboratory Animals (CONCEA) on the care and use of laboratory animals. All experimental protocols have been approved by the Ethics Committee for the Use of Experimental Animals of the State University of Londrina (CEUA n° 18310.2019.03, OF. CEUA n° 164/2019).