INTRODUCTION
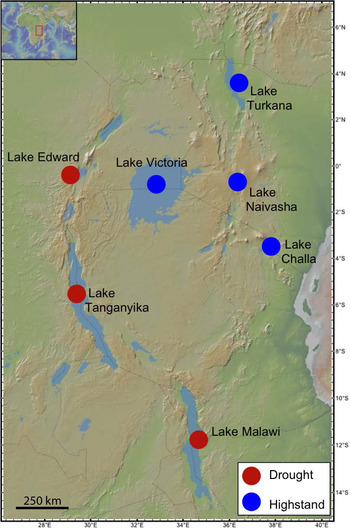
In eastern Africa, the Little Ice Age (LIA, ~AD 1550–1850; Mann, Reference Mann, MacCracken and Perry2002) is characterized by a high degree of climatic spatial variability (Russell and Johnson, Reference Russell and Johnson2007; Russell et al., Reference Russell, Eggermont and Verschuren2007; Ghinassi et al., Reference Ghinassi, D'Oriano, Benvenuti, Awramik, Carlo, Fedi, Ferrari, Papini, Sagri and Talbot2012). A strong east–west rainfall gradient is proposed for this time interval, with regions sourced from the Indian Ocean experiencing higher rainfall than those sourced by moisture moving across the African craton (Russell et al., Reference Russell, Eggermont and Verschuren2007). This proposed gradient is supported by evidence from several lakes from the eastern and western branches of the East African Rift System (EARS). Crater lakes Kitagata and Kibengo in Uganda (Russell et al., Reference Russell, Eggermont and Verschuren2007), and two large rift lakes—Lakes Tanganyika (Alin and Cohen, Reference Alin and Cohen2003) and Malawi (Brown and Johnson, Reference Brown and Johnson2005)—show evidence of drought during the LIA. In contrast, Lake Naivasha in Kenya (Verschuren, Reference Verschuren2001), Lake Victoria in Uganda (Stager et al., Reference Stager, Ryves, Cumming, Meeker and Beer2005), and the Loboi Swamp and Kesubo Marsh in Kenya (Ashley et al., Reference Ashley, Ndiema, Spencer, Harris and Kiura2011; Driese et al., Reference Driese, Ashley, Li, Hover and Owen2004) show evidence for wetter conditions during the LIA than today.
Lake Turkana in northern Kenya is the largest rift lake in the Eastern Branch of EARS and the fourth largest lake on the African continent (Kolding, Reference Kolding1993). Previous lake core proxy records follow the proposed pattern of relatively higher lake levels during the LIA (Halfman et al., Reference Halfman, Johnson and Finney1994; Mohammed et al., Reference Mohammed, Bonnefille and Johnson1995), but data resolution for the LIA is coarse owing to sampling strategies and lake sedimentation rates. Historical records from East Africa, and Lake Turkana specifically, are sparse. Limited data are available beginning with the arrival of the Teleki expedition to the Turkana Basin in 1888 (Imperato, Reference Imperato1998). However, this postdates the LIA, and thus paleolimnological data are essential for documenting the impacts of this climatic event. In this study, we further test the proposed east–west rainfall gradient during the LIA by using paleoecological proxies to constrain lake conditions in Ferguson's Gulf (FG), a narrowly connected body of water on the western edge of Lake Turkana.
Our study combines sedimentology, ostracod taxonomy, and ostracod crapace stable isotopic data from three sediment cores from FG. The longest core (FG3) contains sediments deposited during the LIA interval to the present. Paleolimnological studies are an important component of reconstructing paleoenvironmental responses to regional and global paleoclimatic events. Ostracods in particular provide the opportunity to couple stable isotope measurements of their carbonate carapaces to morphological indicators of environmental conditions (Lord et al., Reference Lord, Boomer, Brouwers and Whittaker2012). Notably, the time range sampled in the cores includes significant demographic and sociopolitical changes in the Turkana region during modern times, such as the shift from pastoralism (Leslie and Fry, Reference Leslie and Fry1989) to regional industrial-scale fishing in 1961 (Bayley, Reference Bayley and Hopson1982; Avery, Reference Avery2010), the construction of dams for the Gilgel Gibe Hydroelectric Project beginning in 1998 (Avery, Reference Avery2010; United Nations Environment Programme, 2013), and the first land clearing associated with the establishment of the Kuraz Sugar Development Project (Kamski, Reference Kamski2016). Thus, our study provides baseline information and lake responses to both natural and anthropogenic environmental impacts.
GEOLOGIC AND HYDROLOGIC SETTING
The Turkana Basin and Lake Turkana
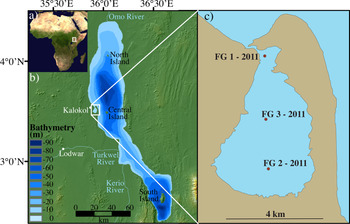
The Turkana Basin, containing Lake Turkana, is located on the border between Kenya and Ethiopia (Fig. 1). Extension in the region first occurred at ~25 Ma (Morley et al., Reference Morley, Wescott, Stone, Harper, Wigger and Karanja1999; Roberts et al., Reference Roberts, Stevens, O'Connor, Dirks, Gottfried, Clyde, Armstrong, Kemp and Hemming2012), when a series of basins trending roughly north-south was created. These asymmetrical half-grabens are bound by east-dipping normal faults (Morley et al., Reference Morley, Wescott, Stone, Harper, Wigger, Day, Karanja and Morley1992). Tectonics and closely associated volcanic activity modified the regional topography, creating the accomodation space in which lakes have waxed and waned since the Pliocene (Feibel, Reference Feibel2011; Lepre, Reference Lepre2014). Modern Lake Turkana has a surface area of ~7500 km2 and a volume of 245 km3 (Yuretich and Cerling, Reference Yuretich and Cerling1983; Cerling, Reference Cerling1986). It is alkaline (pH 9.2) and moderately saline (Yuretich, Reference Yuretich1979). It is a well-mixed polymictic lake due to the shallow water depth and near-constant agitation by southeasterly winds of the Turkana Jet (Yuretich and Cerling, Reference Yuretich and Cerling1983; Kinuthia, Reference Kinuthia1992; Nicholson, Reference Nicholson, Johnson and Odada1996). The Turkana Jet is a low-level air mass that builds off the Indian Ocean before moving across the Horn of Africa. It exceeds wind speeds of 50 m/s and is influenced by the lifecycle of the Asian monsoon (Kinuthia, Reference Kinuthia1992).
Map of the study area. (a) NASA satellite image of the African continent showing the location of the Turkana basin. (b) The DEM map of Lake Turkana and the surrounding area is derived from SRTM data; the bathymetry of Lake Turkana as presented in Halfman et al. (Reference Halfman, Johnson and Finney1994) is overlain on the topography; the highlighted box indicates the position of the study area. (c) Ferguson's Gulf (FG) showing the position of the three cores.

Because Lake Turkana occupies the depression (elevation of 363 m asl) between the Kenyan and Ethiopian plateaus, precipitation across the lake and the area immediately surrounding it is minimal (<255 mm/yr) (Butzer, Reference Butzer1971; Olago and Odada, Reference Olago, Odada, Johnson and Odada1996). Additionally, evaporation rates are extremely high, at 2.3 m/yr, based on class-A pan measurements from Lodwar, Kenya (Hopson, Reference Hopson1982; Cerling, Reference Cerling1986). The lake is sustained through fluvial inputs sourced in its ~146,000-km2 drainage basin that contains three main rivers: the Kerio and Turkwel to the west and the Omo to the north (Butzer, Reference Butzer1971) (Fig. 1). The Omo River is the largest of the three (catchment area of 84,000 km2), contributing between 80 and 90% of the water to the basin, or a volume of 14 km3/yr (Yuretich and Cerling, Reference Yuretich and Cerling1983; Cerling, Reference Cerling1986). It is fed by precipitation from the Ethiopian Highlands, whose higher elevation (1800–3000 m asl) results in >2000 mm of mean annual precipitation (Ayenew et al., Reference Ayenew, Demlie and Wohnlich2008). The Turkwel and Kerio Rivers have a combined input estimated at 2 x 10⁹ m3/yr to Lake Turkana (Cerling, Reference Cerling1986), and they drain the southwestern part of the basin. The Turkwel is the larger of the two, and since 1991, it has flowed perennially owing to regulation by the Turkwel Power Station (KenGen, 2020). But in its unregulated state, it was ephemeral like the smaller Kerio (Yuretich, Reference Yuretich1979). In addition to water, these rivers are important sources of sediment to Lake Turkana. The Omo-proximal North Basin of the lake accumulates sediment at a rate of 5.4 mm/yr (documented from cores spanning ~2500 cal yr BP; Halfman et al., Reference Halfman, Johnson and Finney1994).
Ferguson's Gulf
FG is a 13-km2 body of water narrowly connected to the main area of Lake Turkana by a shallow mouth at its northern end (Fig. 1). It is predominantly maintained through exchange with Lake Turkana. Ephemeral streams enter FG (two at the southern end), but the extremely low local precipitation (average of <255 mm/yr; Olago and Odada, Reference Olago, Odada, Johnson and Odada1996) means they can go years without flowing and thus are not considered significant sources of water or sediment to FG. In summer 2011, the water at FG's mouth was approximately 1 m deep, based on the authors’ observations of people walking across the opening. FG's eastern perimeter was formed by the Longech spit, which protects it from the more intense waves that influence sedimentation in the open lake. Based on this study, deposition in FG is primarily fine-grained material (clay with minor silt). However, near its mouth, sand, likely sourced from the spit, interfingers with fine-grained sediments (see core FG1, Supplementary Appendix A). The restricted geometry of FG puts it in a unique position. Its connection to Lake Turkana means that it is sensitive to basin-wide lake-level changes as opposed to locally controlled changes. However, because it only attains a maximum depth of ~4 m, and its mouth is even shallower, it is in many ways an amplifier lake for changes in Lake Turkana. Small rises or falls of <1 m can have significant impacts on the area, water chemistry, and thus overall stability of ecosystems in this environment.
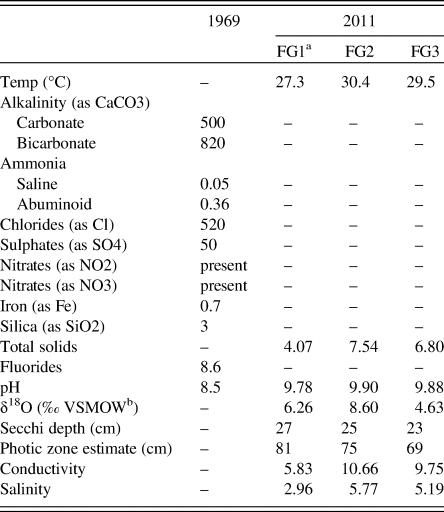
Subsequent historical records of water levels from Lake Turkana have often been taken from FG, although monitoring has been sporadic at best since the 1950s (Butzer, Reference Butzer1971; Hopson, Reference Hopson1982; Avery, Reference Avery2010). Table 1 contains both historical (Walsh and Dodson, Reference Walsh and Dodson1969) and contemporary (collected by the authors) water data. Of particular note is the significant increase in pH (by ~1.5) between 1969 and 2011. Ecologically, FG is an important breeding ground for many of Lake Turkana's fish species (Gownaris et al., Reference Gownaris, Pikitch, Ojwang, Michener and Kaufman2015). Overfishing and fishing of juveniles have already stressed key fish species, reducing their resiliency and making populations more vulnerable. Coupling decreasing lake levels with an already stressed ecosystem could decimate the fish populations on which many of the local communities rely for food and income (Velpuri et al., Reference Velpuri, Senay and Asante2012).
Compilation of modern Lake Turkana water data (shown in parts per million unless otherwise indicated) from Walsh and Dodson (Reference Walsh and Dodson1969) and this study (conducted in 2011).

a FG = Ferguson's Gulf.
b Vienna Standard Mean Ocean Water.
METHODS
Field methods
Three short cores (FG1, FG2, and FG3) were collected from FG in July 2011 (Fig. 1), using a Livingston corer. Cores ranged in length from 44 to 76 cm; core FG3, from the center of the basin, was the longest. Preliminary core descriptions were made in the field after core extrusion and further refined after core splitting and imaging using LacCore's initial core description protocol (Myrbo, Reference Myrbo2005).
Radiocarbon dating
Four samples from the FG3 core were submitted to Beta Analytic, Inc., for accelerator mass spectrometry (AMS) radiocarbon ages. Bulk carbonate samples of 5–8 mg of ostracods were hand-picked from each sample. At Beta Analytic, the ostracod carapaces were pretreated with the standard acid etch prior to analysis. All ages were converted to calibrated years (cal AD) using IntCal13 for the age older than AD 1950 (Reimer et al., Reference Reimer, Bard, Bayliss, Beck, Blackwell, Ramsey and Buck2013) and Bomb 13NH3 for the dates that contained >100% modern carbon or percent of modern carbon (pMC) (Hua et al., Reference Hua, Barbetti and Rakowski2013). Previous radiocarbon dating found evidence of a ± 10-year additional uncertainty (i.e., reservoir effect) when a contemporary shell from Lake Turkana was dated (Garcin et al., Reference Garcin, Melnick, Strecker, Olago and Tiercelin2012). Thus, this ± 10-year uncertainty was applied to all the Bomb 13NH3 calibrated dates to present a conservative estimate of our chronological precision.
Ostracod taxonomy
Approximately 1 cm3 of sediment was sampled at 1-cm intervals for the length of core FG3. Similar-sized samples from cores FG1 and FG2 were taken at 10- to 15-cm intervals. Each sample was wet sieved using a 125-μm sieve, and all ostracods were picked, identified to the genus level, and counted. A valve was counted individually if >50% of the carapace remained. Taxonomic identification to the species level was taken whenever possible through morphological description, referencing previously published work (Lindroth, Reference Lindroth1953; Cohen, Reference Cohen1976, Reference Cohen1986; Carbonel and Peypouquet, Reference Carbonel and Peypouquet1979, Reference Carbonel, Peypouquet and Maddocks1983; Feibel, Reference Feibel1988), and comparing against Turkana reference collections at Rutgers University (Feibel, Reference Feibel1988; Beck, Reference Beck2015). Additionally, the total number of unidentifiable juveniles was counted, the number of unidentifiable fragments was estimated, and other biologic remains were described and counted. SEM backscatter electron images were taken, and subsets of the carapaces were analyzed in bulk for δ18O and δ13C analyses.
Supplementing the analyses from the cores, bulk sediment samples containing ostracods from the modern eastern and western shorelines of Lake Turkana were also identified to the genus level and processed for δ18O and δ13C analyses.
Ostracod δ18O and δ13C analyses
Ostracod carapaces from the FG3 core were analyzed for δ18O and δ13C at the Stable Isotope Laboratory at Rutgers University using a FISONS Optima mass spectrometer equipped with a MicroMass Multiprep automatic sample processing system. A total of 35 samples were run from 33 1-cm intervals (see Supplementary Appendix C for full analyses). Results are reported relative to Vienna Pee Dee Belemnite (Coplen, Reference Coplen1994) through the analysis of an inhouse laboratory standard (RGF1) that is routinely calibrated to NBS19. Isotopic ratios are reported in standard delta notation:

Measurements were made on 6-10 ostracod valves of the same species (Potamocypris cf. worthingtoni (Klie, 1939)), which was chosen because it was the most common species in this record. Prior to analyses, all ostracods were inspected visually using a binocular stereo microscope for signs of secondary alteration. Duplicate analyses were run on three intervals in core FG3 (30 cm, 71 cm, and 74 cm), representing the top of the core, the base of the core, and the zone immediately above a stratigraphically significant marker bed.
Scanning XRF
Cores FG1–3 were scanned for major element chemical analysis on an ITRAX scanner at the Large Lakes Observatory at the University of Minnesota in Duluth. Measurements were taken every 2 mm along the length of each core using a chromium source tube and a 60-second dwell time. All data were standardized to the coherent scatter (counts/counts).
RESULTS AND INTERPRETATIONS
Chronology
Assumptions in the chronological framework
Dating this record proved challenging because of the young age of the sediments and the limited datable material present. Therefore, a chronology for core FG3 was assigned using the following assumptions:
(1) The top of the core was assigned the year AD 2011 when it was recovered. We recognize that piston coring is not the best way to recover the sediment-water interface. However, sediment loss during coring is not significant because the upper 63 cm dated to AD 1990–2000.
(2) Bioturbation was limited below 64 cm below surface (cmbs; i.e., in the bottom part of the core). We assume minimal bioturbation because the ostracod record undergoes significant shifts in total ostracod valve abundance between samples analyzed at centimeter resolution. For example, there is a sharp isotopic shift at 64 cmbs, which would not have been maintained if the sediment had been substantially bioturbated.
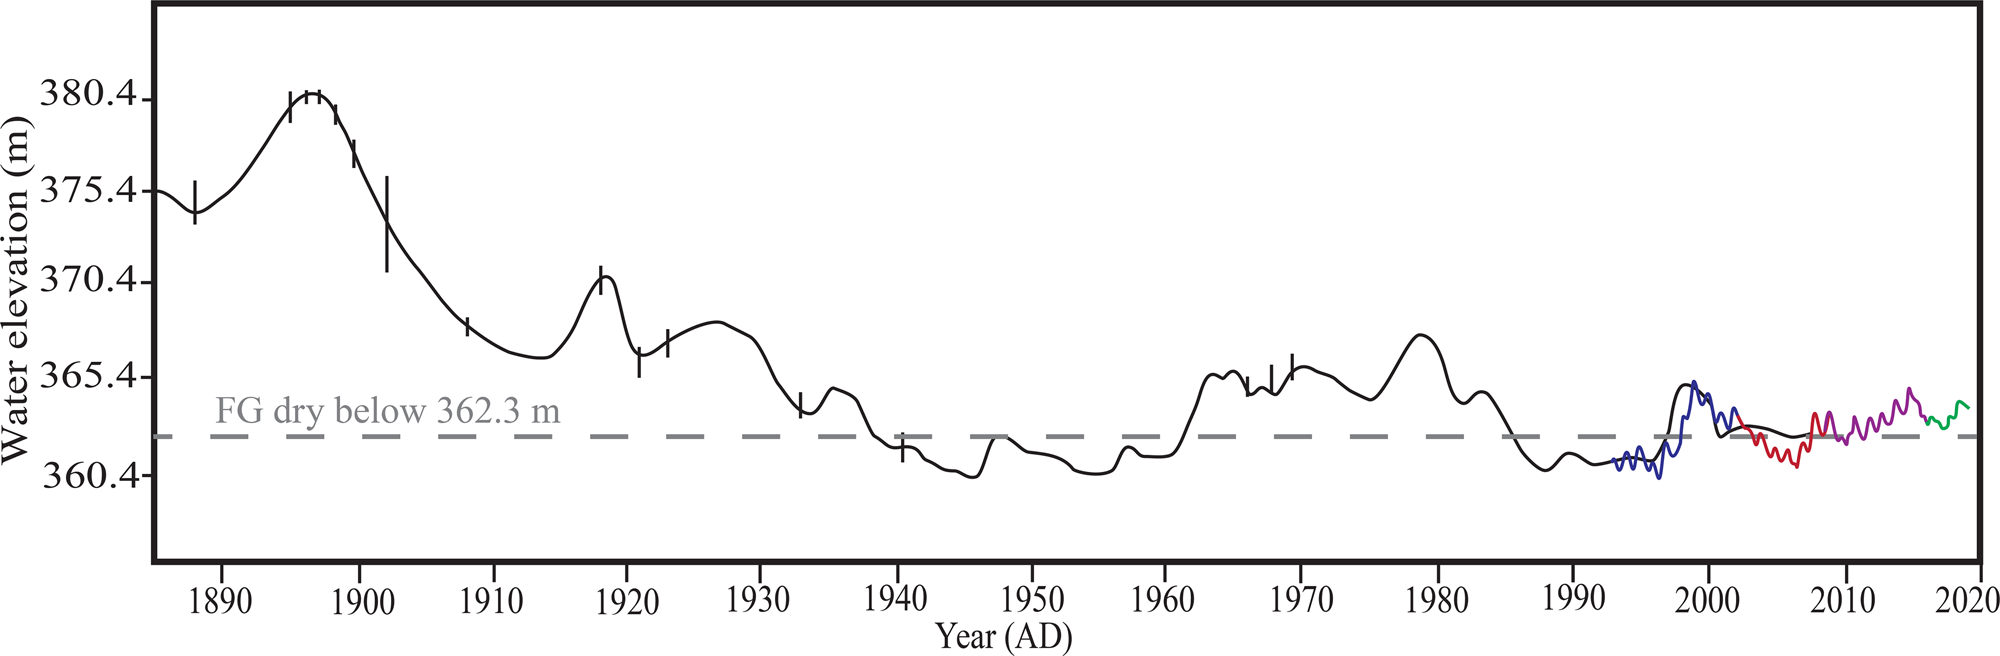
(3) Lake level changes have impacted FG. When possible, historical lake level records were integrated into the chronological interpretation of FG (Fig. 2). These data serve as an important framework for interpretation as we can assume no deposition in FG when it was subaerially exposed and therefore at least perennially dry. The threshold for this occurs at 362.4 m asl (Avery, Reference Avery2010). From the historical lake-level curves, lake levels fell below the 362.4-m threshold necessary for sustaining FG in the 1940s–1950s, the late 1980s–early 1990s, and ~2005 (Avery, Reference Avery2010; Velpuri et al., Reference Velpuri, Senay and Asante2012) (Fig. 2). During these periods, sediment was not being deposited, and erosion could have occurred. While environment may have been able to quickly reestablish in FG after a single lake regression, we posit that the frequency of these events may be more significant from an ecological perspective, as they stress organisms and alter the FG ecosystem. These hiatuses in the record are essentially invisible from the sedimentology alone. Only through analyses of the proxy records is it potentially possible to identify them.
Historical lake-level curve (Hopson, Reference Hopson1982; Avery, Reference Avery2010), with modern TOPEX/Poseidon and Jason series satellite altimetry data appended to the historical data (blue = TOPEX/Poseidon; red = Jason-1; purple = OSTM/Jason-2; green = Jason-3) (USDA Foreign Agricultural Service, 2019).

Radiocarbon dating and interpretation
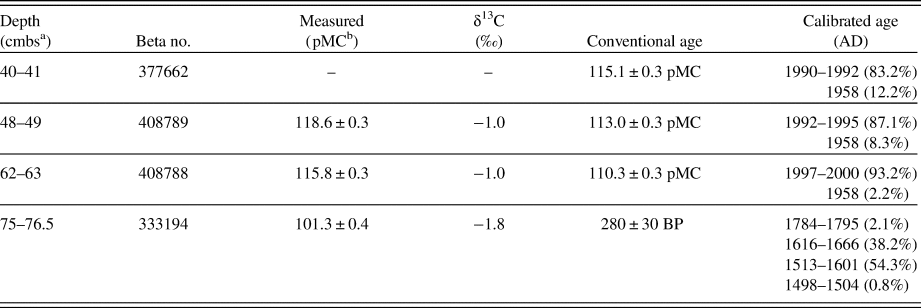
A chronological framework for the FG3 core was developed through a combination of four AMS radiocarbon dates (Table 2) and historical lake-level data (Fig. 2). Documented depositional hiatuses were integrated into the sedimentary context wherever possible. No reservoir effect was applied to systematically shift ages, but we recognize that modern data suggest an additional uncertainty on the order of ± 10 yr (Garcin et al., Reference Garcin, Melnick, Strecker, Olago and Tiercelin2012). The age of FG3 is constrained at its base to ~AD 1557 ± 40 (Table 2). The three additional radiocarbon dates taken from higher up the core all yielded pMC in excess of the modern (AD 1950) reference standard; this indicates these samples contain “bomb” carbon, and that the material postdates the onset of nuclear weapons testing (AD 1950s). When the ± 10-year uncertainty is included with these dates, they are geologically instantaneous, reflecting deposition somewhere between AD 1990 and 2000 (Table 2). The historical lake-level data demonstrate that the early to mid-1990s was a period when FG was at least perennially dry (Avery, Reference Avery2010; Velpuri et al., Reference Velpuri, Senay and Asante2012) (Fig. 2). Thus, the radiocarbon dating indicates a significant unconformity between 75 and 63 cmbs.
Accelerator mass spectronomy radiocarbon ages for core 3 from Ferguson's Gulf, generated at Beta Analytic, Inc., as part of this study. The sample at 75–76.5 cmbs was calibrated in OxCal (Ramsey, Reference Ramsey2019) using IntCal13 (Reimer et al., Reference Reimer, Bard, Bayliss, Beck, Blackwell, Ramsey and Buck2013) and Bomb 13NH3 in samples where the δ13C corrected percent of modern carbon exceeded the modern standard (AD 1950) (Reimer et al., Reference Reimer, Brown and Reimer2004; Hua et al., Reference Hua, Barbetti and Rakowski2013).

a centimeters below surface.
b percent of modern carbon.
Sedimentology
Cores FG2–3 are predominantly composed of massive dark gray clay (Fig. 3; Supplementary Appendix A). Core FG3 is the focus of this section, as it was the longest core, and its stratigraphy is described from the base moving up-core.
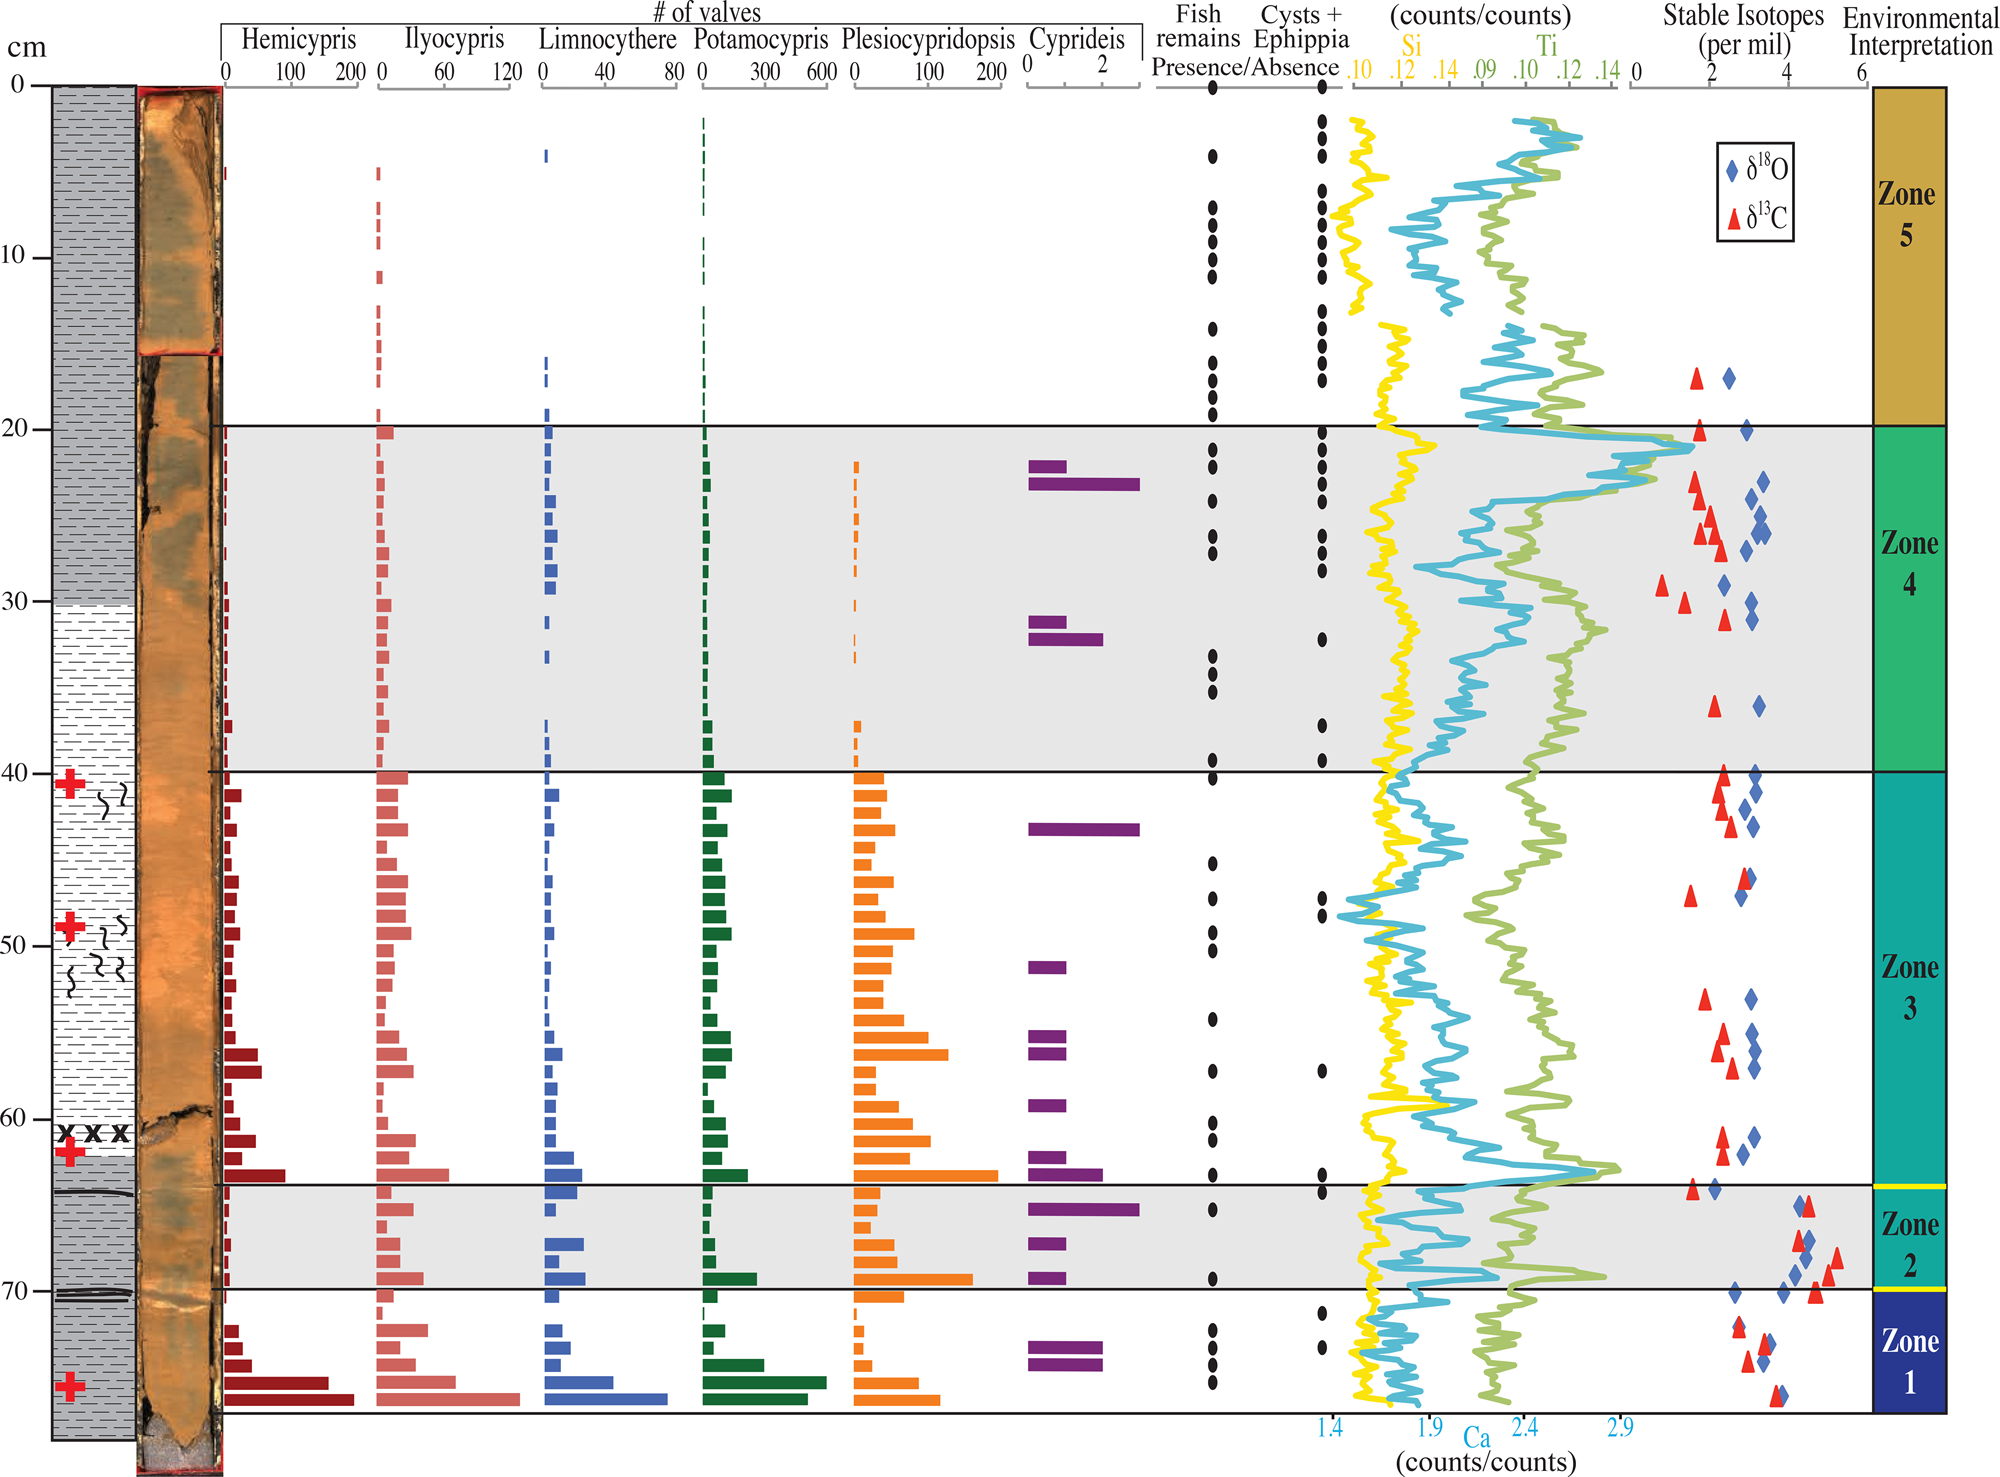
Compilation of the sedimentology, ostracods, fish remains and cysts/ephippia (black dot = presence; no dot = absence), scanning XRF (normalized to cohesive scatter), stable isotope data, and a summary environmental interpretation. For the environmental interpretation section, the color of the box associated with each zone indicates the status of FG, ranging from dark blue during the freshwater highstands of the Little Ice Age (LIA) (Zone 1) to the present high alkalinity and environmental collapse in brown (Zone 5). Zones 2 and 3 likely represent similar paleolimnological conditions. However, the significant unconformities (yellow lines) clearly differentiate Zone 2 from the zones on either side. Red crosses on the lithologic column note the position of radiocarbon dates.

In FG3, the massive clay is interrupted by a distinctly bedded 1-cm tan clay interval from 70 to 71 cmbs and is designated hereafter as the major clay bed. This bed contains internal laminations composed of 3 mm of irregular light tan clay, 4 mm of dark gray clay, and 3 mm of light tan clay. At 64 cmbs, a ~4-mm wispy, light tan clay bed was noted and designated as the minor tan clay bed. FG2 also contained the minor tan clay bed. However, because of the shorter length of this core [50 cm], the major clay bed was not recovered. The clay in FG3 is oxidized to reddish brown from 31 to 60 cmbs and along the edges and cracks in the core. The oxidation around the edges and cracks are interpreted as effects of postcoring oxidation, but the interval from 31 to 60 cmbs appears to have oxidized prior to coring. Additionally, the interval from 40 to 55 cmbs contains tan blebby clay beds that were likely bioturbated. Minor fine-grained quarto-feldspathic sand was found in the >125-μm (>120-mesh) fraction throughout the core.
The lithology of FG1, located near the mouth of FG, does not correlate with cores FG2 and FG3. It is notably coarser grained and composed mostly of medium sand to silt. The ostracods show some evidence of calcite recrystallization as they have a frosted, sparry texture, indicative of redeposition of older Holocene or Plio-Pleistocene sediments. The differences in core FG1 are attributed to a lateral facies change, with FG1 representing a sandy beach and FG2 and FG3 representing a lower energy lagoonal depositional environment because of the protection of the Longech Spit. Full core descriptions and ostracod assemblage data from FG1 and FG2 are presented in Supplementary Appendix A and Appendix B.
Ostracod taxonomy
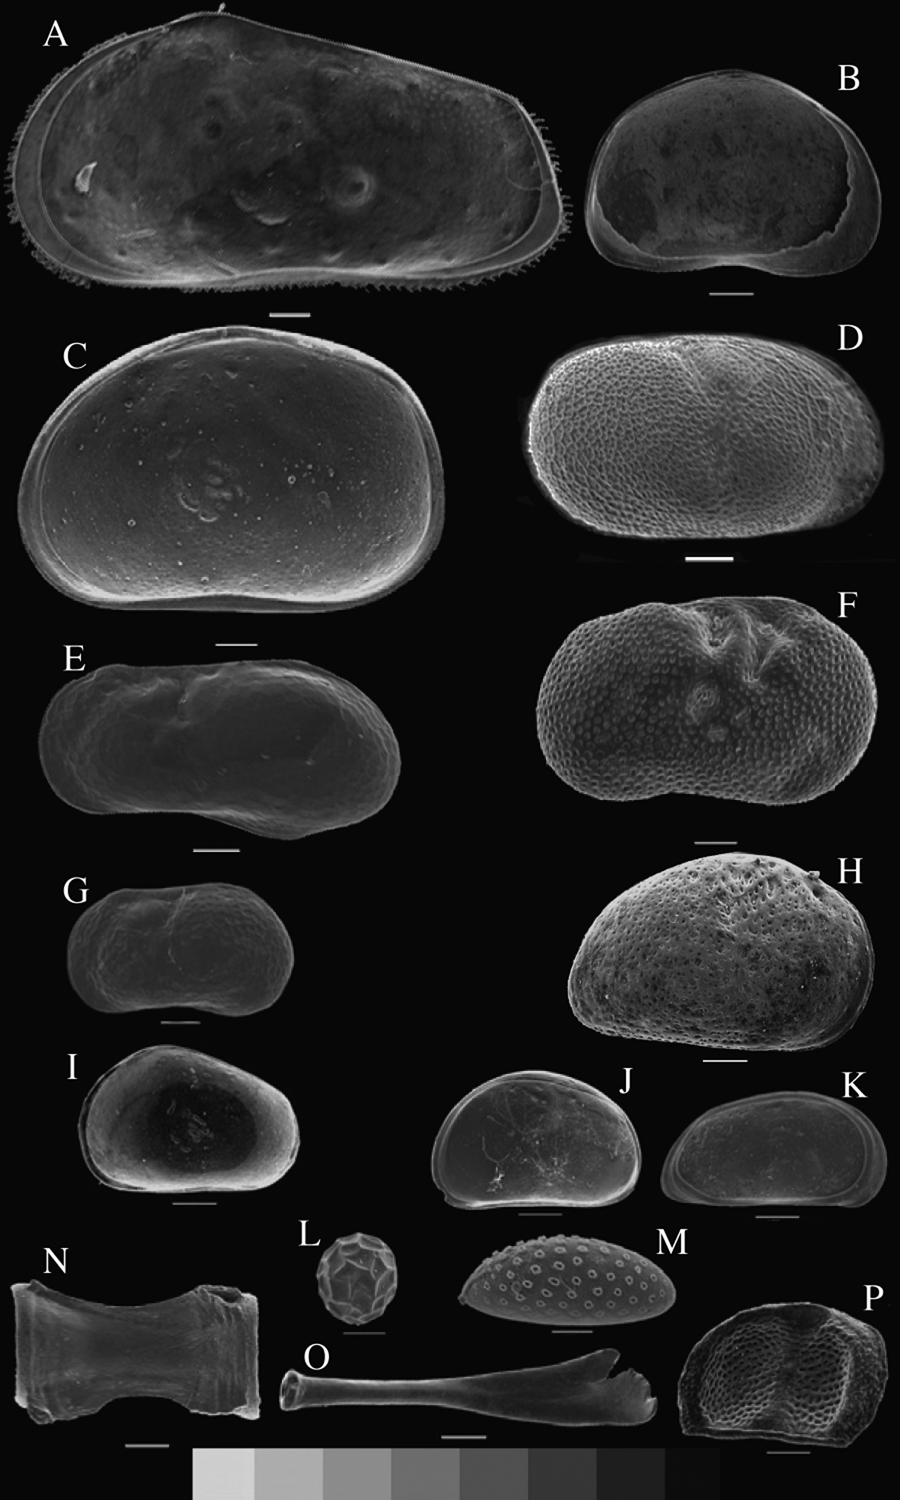
Seven genera of ostracods were identified in the cores from FG (Fig. 4a–g; Supplementary Appendix B). All these taxa have been previously reported from modern Lake Turkana (Lindroth, Reference Lindroth1953; Cohen, Reference Cohen1986; Ng'ang’a et al., Reference Ng'ang’a, Muchane, Johnson, Sturgeon and Lehman1998). P. cf. worthingtoni is the most common and abundant ostracod genus. It was present in more than 97% of core FG3 and ranges in abundance from 0 to 596 individuals per sample (approximately 1 cm3 of sediment). The valves are small (0.6 mm in length), generally robust, and occasionally articulated. In modern beach sand samples, the genera Hemicypris (Sars, 1903) and Sclerocypris (Sars, 1924) are the most abundant. In addition to ostracods, this study identified anostraca cysts, Daphnia ephippia, Cyperaceae achenes of the genus Scirpus, and micro fish teeth and bones primarily from Tilapia (Fig. 4a–e).
SEM images of the ostracod taxa and other biologic remains found in the FG cores, with the white scale bars equal to 100 μm. (A) juvenile Sclerocypris (Sars, 1924). (B) Plesiocypridopsis cf. newtoni (Brady and Robertson, 1870). (C) Hemicypris (Sars, 1903). (D, H) Cyprideis torosa (Jones, 1850). (E) Limnocythere cf. africana (Klie, 1939) (long). (F) Ilyocypris cf. gibba (Ramdohr, 1808). (G) L. cf. africana (Klie, 1939) (short). (I) flat-backed immature instar of Hemicypris (Sars, 1903). (J, K) right and left valves of Potamocypris cf. worthingtoni (Klie, 1939). (L) Anostraca cysts (Beladjal and Mertens, 2003). G) (M) Cyperaceae Scirpus achene (Yost, C., personal communication). (N) fish (Tilapia) vertebra. (O) fish (Tilapia) teeth. (P) Daphnia ephippia (Beladjal, L., personal communication).

All three cores display an up-core trend of decreasing population diversity and total abundance of ostracods (Fig. 3; Supplementary Appendix B). In FG3, the sample from 75 to 76 cmbs (i.e., the base of the core) includes the most ostracods per cubic centimeter; some 1212 were identified, with >100 juveniles and an estimated >1000 fragments. The only exception to the decreasing upward trend is the major tan clay bed (70–71 cmbs), which is nearly devoid of ostracods. Interestingly, the intervals of 71–72 cmbs and 73–74 cmbs contain Darwinula cf. stevensoni (Brady and Robertson, 1870) (Supplementary Appendix B). These are the only portions of the FG3 core with this species, making this interval both lithologically and biologically distinct. The minor tan clay bed also corresponds with a biological transition. At and below it, reticulate Limnocythere cf. africana (Lindroth, 1956) specimens were observed. Above it, all L. cf. africana are smooth.
Unlike the ostracods, the number of samples containing cysts and ephippia increased up-core. The upper 28 cm of core FG3 contains more intervals with fish, cysts, and ephippia than any other part of the record. The cysts are spherical, 0.2 mm in diameter, and have a triangular texture on their outer surface. The presence of microscopic fish teeth remain fairly consistent throughout the record, which may indicate that even when conditions were more evaporitic or harsh, fish continued to occupy this ecological niche. Scirpus achenes are only present in a single 1-cm interval, from 28 to 27 cmbs. The achenes have lost most to all of their outer coating, probably during diagenesis (Yost, C., personal communication, 2016).
Ostracod δ18O and δ13C values
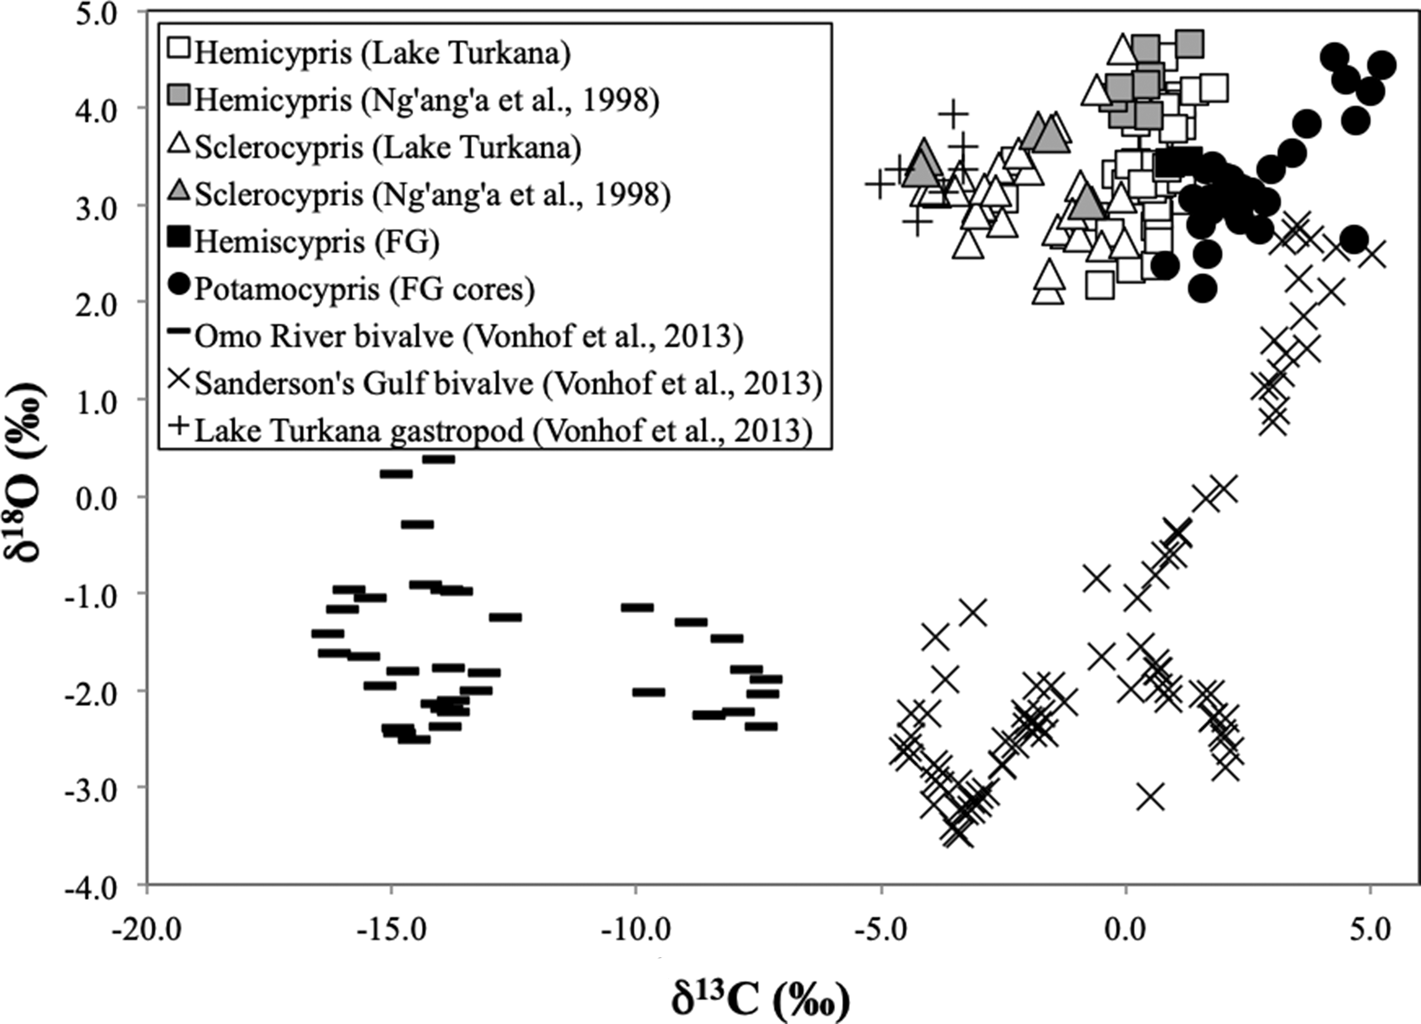
The δ18O and δ13C data from ostracods analyzed in this study are presented in Supplementary Appendix C. In core FG3, δ18O measurements from P. cf. worthingtoni ostracod valves range in value from 2.1 to 4.5‰ (mean = 3.22‰, standard deviation [SD] = 0.54‰), and δ13C range from 0.8 to 5.2‰ (mean = 2.63‰, SD = 1.12‰). A shift to higher δ18O (range = 2.64–4.52‰) and δ13C (range = 4.26–5.23‰) at 70 cmbs is followed by a return to lower δ18O (2.13‰) and δ13C (1.58‰) values at 64 cmbs (Fig. 3). The majority of the core (above 64 cmbs) represents the modern FG, where the combined δ18O values span 2.1–3.4‰ (mean = 3.01‰, SD = 0.30‰) and δ13C values range from 0.8 to 2.9‰ (mean = 2.03‰, SD = 0.46‰). The upper 20 cm of the core have only one data point because the ostracods at the top of the core were so sparse that there was not enough material to conduct isotopic analysis (Fig. 3). The combined δ13C values from the FG3 core (mean = 2.93‰) plot between the samples from modern Lake Turkana (mean = -1.88‰) and the samples from Sanderson's Gulf, with δ18O >0 (mean = 3.51‰). Sanderson's Gulf, a shallow, marshy, periodically flooded embayment located in the northwestern corner of Lake Turkana, provides an interesting point of comparison for FG (Fig. 5; Vonhof et al., Reference Vonhof, Joordens, Noback, van der Lubbe, Feibel and Kroon2013).
Isotopic cross plot of δ13C versus δ18O comparing data from this study from ostracods from FG and other beaches around Lake Turkana with that from previous studies of both molluscs (Vonhof et al., Reference Vonhof, Joordens, Noback, van der Lubbe, Feibel and Kroon2013) and ostracods (Ng'ang’a et al., Reference Ng'ang’a, Muchane, Johnson, Sturgeon and Lehman1998). Analyses from FG (black circles) plot slightly to the right of the open lacustrine conditions suggesting that while the water in FG is sourced from the lake, the environment has higher productivity (much like Sanderson's Gulf), creating higher δ13C.

These data were compared to δ18O and δ13C analyses of Hemicypris and Sclerocypris from modern beaches around Lake Turkana, including two analyses from FG, to assess intergenera fractionation. In the FG samples, the two Hemicypris samples yield slightly lower δ13C values than those of the P. cf. worthingtoni specimens (Fig. 5). The mean of all the δ18O data from both the genera Hemicypris (n = 50, mean = 3.33‰, SD = 0.49‰) and the Sclerocypris (n = 30, mean = 3.08‰, SD = 0.51‰) is approximately 0.1‰ offset (Hemicypris is higher, Sclerocypris is lower) from the mean of P. cf. worthingtoni samples from FG3; the standard deviation for the beach samples of approximately 0.5‰ is identical for all analyses. However, δ13C values for Hemicypris and Sclerocypris range from -4.1 to 1.8‰, respectively, with the means for both (0.35‰ for Hemicypris and -1.97‰ for Sclerocypris) >2.0‰ lower than that observed in FG (mean = 2.63‰, SD = 1.12‰). The SD for the δ13C analyses of all three genera are relatively similar (0.96‰ and 1.22‰). We interpret this as a function of two variables: (1) reduced fractionation of carbon isotopes during biological assimilation in Hemicypris and Sclerocypris, and (2) that the beach samples might represent a broader range of subenvironments, with localized δ13C offsets due to isotopic fractionation from variations in pCO2 exchange and pH.
DISCUSSION
Environmental and climatic reconstruction
On the basis of sedimentology, geochemistry, and paleoecology, core FG3 was subdivided into five biozones (Fig. 3). Each zone was examined to show how the sedimentology, ostracod record, elemental data, and stable isotope analyses can contribute to an understanding of the climate and environment in FG and the Turkana Basin since the LIA. Despite the wide range of environmental conditions interpreted through the core, the lack of significant excursions in the XRF-derived Si counts (Fig. 3) suggests that the source of the terrigenous sediment, and thus weathering intensity, remained consistent throughout this record (Cohen, Reference Cohen2003).
Zone 1 interpretation: a robust LIA ecosystem (~AD 1500–1600s to ~1940)
Zone 1 (76–70 cmbs) spans the bottom of the core to the base of the major clay bed. It is characterized by high ostracod diversity and decreasing total ostracod abundance moving up-core. The radiocarbon date at the base of the core (75–76.5 cmbs; Table 2) indicates a relative likelihood of 92.5% that the age of the base spans AD 1513–1666 (95.4% probability interval), which falls within the LIA, a period when lake levels in the Eastern Branch of EARS were higher than today (Halfman et al., Reference Halfman, Johnson and Finney1994; Mohammed et al., Reference Mohammed, Bonnefille and Johnson1995; Verschuren, Reference Verschuren2001; Russell et al., Reference Russell, Eggermont and Verschuren2007). Zone 1 is biologically distinct because in addition to having the largest diversity and abundance of ostracods, it contains more strongly reticulate L. cf. africana (i.e., exhibiting a netlike pattern on its shell) and is the only interval with D. cf. stevensoni (n = 5 valves). Reticulation in ostracods indicates fresher, less alkaline lake conditions (Carbonel and Peypouquet, Reference Carbonel, Peypouquet and Maddocks1983). Along similar lines, D. cf. stevensoni usually prefer fresh lake conditions with low ionic concentrations and non-turbid water columns (Carbonel and Peypouquet, Reference Carbonel, Peypouquet and Maddocks1983). These observations indicate that the LIA was wetter than modern in the Turkana Basin, and this fresh lake supported a robust and diverse ecosystem during this time. They also aid in constraining the timing of the LIA response, which enhances regional interpretations of the impact of this global event across East Africa (Fig. 6). The ostracod abundance decreases moving up-core through this zone, which might be a result of decreasing lake levels toward the end of the LIA. The upper contact of Zone 1, marked by the base of the major clay bed, is likely an erosional one, as discussed in more detail in the Zone 2 section below. From historical data (Fig. 2), FG was dry for two decades beginning around AD 1940, so we interpret this as the cause of the unconformity. The decrease in the ostracods made radiocarbon dating the top of this interval impossible, thus leaving uncertainty in the timing of this proposed unconformity.
(color online) Map of East Africa showing a compilation of the spatial variability of lake responses to the LIA (Russell and Johnson, Reference Russell and Johnson2007; Russell et al., Reference Russell, Eggermont and Verschuren2007; Verschuren et al., Reference Verschuren, Laird and Cumming2000; Wolff et al., Reference Wolff, Haug, Timmermann, Damste, Brauer, Sigman, Cane and Verschuren2011).

Zone 2 interpretation: a stressed ecosystem (~AD 1940–1990s)
Zone 2 (70–64 cmbs) is bound at the base by the major clay bed and at the top by the minor tan clay bed. There are two possible interpretations for the major clay bed:
(1) It could represent a period of non-deposition when the FG surface was desiccated. In this interpretation, the clay would form through diagenetic processes that erased any biological record that might have previously existed in these sediments. This might be supported by the fact that the XRF-derived Si counts are notably stable across the major clay bed, rendering this feature geochemically indistinct from the sediments on either side of this marker (Fig. 3). There are, however, peaks in both Ca and Ti counts at the major clay bed. With this model, the major clay bed is potential evidence of an erosional unconformity. More material might have originally been deposited on top of this interval but was eroded during desiccation.
(2) It could also represent an instantaneous depositional event like a localized ash fall that has subsequently altered to bentonite from one of the nearby active volcanic centers in the Turkana Basin. Some potential candidates include the three volcanic island in the lake (South, Central, and North Island) (Dunkelman et al., Reference Dunkelman, Karson and Rosendahl1988), with Central Island being the most proximal candidate as it is located approximately 13 km to the east of FG. It is also worth noting that the relative position of Central Island to FG would make it downwind, given the prevailing direction of the Turkana Jet. Future investigation should look evidence of young Holocene eruptive events in other modern lake cores.
Ultimately, we favor the interpretation that this bed reflects a time of non-deposition and is likely an erosional unconformity. The interbed layering could result from the combined processes related to the erosion, exposure (potentially resulting in eolian deposition), diagenetic alteration, and subsequent re-flooding of this surface. Geochemically, the major clay bed is distinct in that there is a potential Ca peak and a strong Ti peak through this interval, interpreted to indicate increased detrital sediment (Cohen, Reference Cohen2003), which could result from the transgression at the top of the major clay bed. Historical records post LIA document that FG completely desiccated, potentially removing much of the sedimentary record laid down during both the LIA and the period that followed. By integrating the radiocarbon dates from this study (Table 2) with historical lake-level data (Fig. 2), we interpret that the major clay bed is the product of the two decades of lowstands at Lake Turkana from ~AD 1940 to 1960. This is the first historical period when lake levels were below 362.3 m asl, the level below which FG becomes dry (Fig. 2; Hopson, Reference Hopson1982; Avery, Reference Avery2010). During this period, FG was subaerially exposed, resulting in non-deposition of sediments and likely eolian desiccation of the exposed surface. A few decades of limited deposition and erosion may have removed much of the LIA record and resulted in a barren clay bed forming through alteration of existing clay.
The ostracod assemblage of Zone 2 is as diverse as Zone 1. However, the total abundance decreases up-core, the L. cf. africana ostracods are reticulate, and no cysts or ephippia were found in this interval. The ostracod isotopic record for this zone is characterized by an excursion exhibiting significantly higher δ18O and δ13C values than those in Zones 1 and 3. This also supports the interpretation of the major clay bed representing missing time in the record following the regression of Lake Turkana at the termination of the LIA, which occurred after 1896 according to historical records (Fig. 2). In Zone 2, no directional trend and little variability in either the δ18O or the δ13C values were noted. This suggests that this excursion is not the product of random variability but rather is reflective of a systematic shift in limnological conditions such as might occur after a desiccation and a re-flooding of FG as water levels regressed and transgressed in Lake Turkana. The range of δ18O values in this zone (4.44–2.64 ‰) falls on the high end of the range of modern ostracods, albeit with more positive δ13C values (5.23–1.58‰, mean = 4.73‰). If deposition had been continuous, one would expect to see increasingly positive values in the δ18O isotopes, indicating evaporitic concentration of gulf waters as the lake level fell (Craig, Reference Craig1961; Ricketts and Johnson, Reference Ricketts and Johnson1996). Therefore, the conditions in FG must have been significantly different from the fresher water of the LIA. We interpret that Zone 2 reflects a more restricted environment, with evaporitic water leading up to the deposition of the minor clay bed at the top of this zone.
If the major clay bed is interpreted as an interval of minimal to no deposition, the minor clay bed at the top of this zone likely represents a similar event, as it is sedimentologically identical. Historical satellite imagery shows that FG was completely dry in AD 1988, and records from the Kenya Marine and Fisheries Research Institute corroborate that FG was at least perennially dry from ~AD 1986 to 1997 (Fig. 2) (Avery, Reference Avery2010). Thus, the minor clay bed records a depositional hiatus with authigenic or diagenetic clay formation from AD ~1986 to 1997. One additional line of evidence for a depositional hiatus reflected by the minor clay bed is that the reticulated L. cf. africana disappear above Zone 2. This indicates that FG was desiccated during this time (i.e., missing time), and when the water supply was reestablished, there was enough of a chemical difference in alkalinity or salinity that the ostracods were no longer reticulated.
Zone 2 highlights the significance of FG as an amplifier record for lake-level fluctuations in Lake Turkana. This record is sensitive to drops in lake level on the order of meters, particularly around the elevation of 362.3 m asl, below which FG is dry (Avery, Reference Avery2010). This scale of change would likely be invisible in deeper water facies. While paleoshorelines are another valuable archive of past lake levels, they require years to decades of relatively stable lake levels to carve erosional benches (Adams et al., Reference Adams, Wesnousky and Bills1999). In this case, the regression from ~1940 to 1960 would not necessarily be long or stable enough to establish a well-defined shoreline (Adams et al., Reference Adams, Wesnousky and Bills1999). Any shoreline erosion that did occur would be covered during subsequent transgressions, rendering this event essentially invisible. However, owing to its unique position and the sensitivity of this marginal environment, the proxy records from FG track this change.
Zone 3 interpretation: a dynamic environment (~AD 1990s–2000)
Biologically, Zone 3 (64–40 cmbs) is highly dynamic, and the ostracod record appears to be characterized by variability in the total abundance of valves, particularly Hemicypris and Plesiocypridopsis cf. newtoni (Fig. 3). Overall, the assemblage is as diverse as Zones 1 and 2, and ostracods are abundant throughout the interval. There is an increase in counts of both Ca and Ti at the start of this interval, immediately above the minor clay bed, which is again interpreted as a signal of increase detrital input as the system rebounded after the interpreted desiccation. Sedimentologically, Zone 3 spans two transitions. In the first, starting at 60 cmbs, the sediment becomes visibly more oxidized. In the second, from 55 cmbs to the top of the zone, blebby clay beds, potentially reflective of bioturbation, characterize the sediment.
The radiocarbon chronology for this zone consists of three dates, all with post-bomb carbon that calibrate from AD 1990 to 2000. Satellite and historical records indicate that FG was at least perennially dry throughout the late AD 1980s to mid-1990s, further constraining deposition during this interval from ~AD 1995 to 2000. Thus, FG fills, and sedimentation resumes after the hiatus inferred from the minor clay bed at the top of Zone 2. Finally, the chronology results in an apparent dramatic increase in the sedimentation rate beginning in Zone 3. In part, this could be a function of the unconformities in Zones 1 and 2 removing material and making the sedimentation rates for the base of the core appear lower than in actuality. The source of the sediment responsible for this rate is still enigmatic, but potential contributors could be eolian and biogenic inputs coupled with detrital-suspended sediment from fluvial sources.
Zone 4 interpretation: environmental and ecological instability (~AD 2000–2005)
Zone 4 (40–20 cmbs) also exhibits high overall diversity of ostracods (Fig. 3, Supplementary Appendix B). While the ostracod population diversity remains relatively stable, the total abundance drops throughout the zone, indicating that lake conditions continued to become less favorable for supporting them. This zone spans the transition from the more highly oxidized clays to darker, less oxidized ones at 31 cmbs. This transition corresponds to a slight increase in the number of L. cf. africana ostracods. This is another period when satellite images and altimetry suggest that FG was at least perennially dry (Fig. 2; Avery, Reference Avery2010). In light of this, the oxidation below 31 cm might have occurred in a well-oxygenated water column or when the core site was subaerially exposed. Why the sediments appear more reduced in the upper 31 cm of this core is somewhat of an enigma. The modern environment is not vegetated enough to evoke the bioproductivity of marsh-like conditions as a mechanism for stratifying this shallow body of water. Perhaps the shrinking size of FG and the narrowing of the inlet from Lake Turkana at its northern end restricted water exchange, causing chemostratification from evaporitic concentration of ions. This would make it more challenging for FG to regularly overturn and supply oxygenated water to the water-sediment interface. Ostracods also appear to respond to the environmental changes reflected by this sedimentological shift, as above the oxidation transition, at 22 cmbs, the ostracod genera P. cf. newtoni (Brady and Robertson, 1870) and Cyprideis cf. torosa (Jones, 1850) both disappear from the record.
The bulk geochemical data at the top of Zone 4 also suggest a shift in the environment. There is an excursion from 24 to 20 cmbs in the Ca and Ti records (Fig. 3). The Ca peak does not correspond to an increase in ostracods and may be due to authigenic calcite precipitation and deposition. While not directly observed, authigenic calcite precipitation could result from increased evaporitic concentration of the water in FG as was also proposed by Halfman and Johnson (Reference Halfman and Johnson1988). While Ti does covary, potentially suggesting these peaks are a product of increased detrital sediment, as described in Zone 2, the amplitude of the Ti excursion is an order of magnitude less than that of Ca. Therefore, authigenic calcite precipitation is one way to explain this shift, though there is probably also a shift in detrital sediment sourcing.
Zone 5 interpretation: ecological collapse (post ~AD 2005–2011)
In Zone 5 (23–0 cmbs), the ostracod assemblage is not very diverse, composed of only P. cf. worthingtoni, Ilyocypris cf. gibba (Ramdohr, 1808), and six intervals with either Hemicypris or L. cf. africana. This interval also has the lowest ostracod total abundance. Most of the ostracods identified and counted were broken. This scarcity is attributed to (a) conditions being unfavorable for large, diverse populations; and (b) anthropogenic impacts, including heavy fishing in FG, further stressing ecosystems already on the brink of sustainability (Gownaris et al., Reference Gownaris, Pikitch, Ojwang, Michener and Kaufman2015). Unfavorable conditions include increases in the pH of the water as highlighted in the comparison of limnologic measurement made in AD 1969 (Walsh and Dodson, Reference Walsh and Dodson1969) and AD 2011 (Table 1). Additionally, total dissolved solids are also high (Table 1), and the Ca counts in the sediment record increase up-core from 6 cmbs to the top. These data reflect an evaporitic concentration of the water in FG which potentially eliminate fresher water ostracod genera as part of a broader ecosystem collapse in FG. In this zone, the ecosystems in FG were likely struggling to regain a foothold as lake levels hovered near the threshold at which FG is flooded. The lack of ecological rebound in ostracod communities signals that FG is likely not in a healthy state owing to the combination of prolonged lake lowstands relative to the LIA and intense anthropogenic activities in the area.
Diagenesis and mechanical weathering might be more prevalent in shallow water depths, so it is important to evaluate whether the scarcity of ostracods might be due to low preservation potential. However, the paucity of ostracods in this zone cannot solely be explained by poor preservation potential because it contains more intervals with microscopic fish remains, Daphnia ephippia, and cysts than any other zone in the core (Fig. 4c). This demonstrates that relatively delicate biological material was capable of being preserved in FG during this time interval. Presumably, these organisms are less susceptible than ostracods to the degradation of the water column. Therefore, we conclude that harsh environmental conditions and anthropogenic factors must have been the limiting factors for ostracod populations in the ecosystem.
Water sourcing to Ferguson's Gulf
When plotted within the isotopic model proposed by Vonhof et al. (Reference Vonhof, Joordens, Noback, van der Lubbe, Feibel and Kroon2013) with fluvial and lacustrine end members, our ostracod analyses from FG plot near the highest bivalve δ18O values of Sanderson's Gulf (Fig. 1) and span the δ18O range of the modern Lake Turkana ostracods and gastropods (Fig. 5). There is no correspondence with bivalve samples from the Omo River, which average negative δ18O values (Fig. 5). FG ostracod δ13C values overlap the highest bivalve δ13C values of Sanderson's Gulf and exceed the δ13C values of the modern Lake Turkana ostracods and gastropods. Both FG ostracod δ18O and δ13C values are significantly higher than those from the Omo River bivalve. This indicates that FG has been isolated from the Omo River flood-stage plumes that routinely travel along the western shore of the lake but do not directly reach FG owing to its restrictive geometry. It is, however, important to note that the δ18O and δ13C data from Ng'ang’a et al. (Reference Ng'ang’a, Muchane, Johnson, Sturgeon and Lehman1998) were produced on valves of the ostracod genera Hemicyrpis and Sclerocypris. The data from this study are from P. cf. worthingtoni (FG cores), with additional Hemicyrpis and Sclerocypris samples from bulk sediment collected around the shores of Lake Turkana. The FG samples analyzed were two Hemicyrpis and 35 P. cf. worthingtoni. Some genera-specific isotopic fractionation between ostracods, and certainly for the mollusc-derived data, is expected (Fig. 5) (Ng'ang’a et al., Reference Ng'ang’a, Muchane, Johnson, Sturgeon and Lehman1998, and reference therein).
The δ13C offset between P. cf. worthingtoni and the lacustrine end member of the Vonhof et al. (Reference Vonhof, Joordens, Noback, van der Lubbe, Feibel and Kroon2013) model suggests that the water in FG is either a) enriched in 13C relative to the lake, b) representative of a mixture of lacustrine and deltaic end members, or c) reflective of local water sources with higher δ13C values relative to Omo or Lake Turkana water. One source of enrichment of 13C to FG could be calcite veins in the Miocene basalts of the Lothidok hills (Fig. 1) through which the local rivers flow.
Modern FG is a eutrophic system, with significant algal blooms (Avery, Reference Avery2010). Thus, both abiotic (i.e., fractionation in response to changes in pH and gas exchange) and biotic (i.e., photosynthesis) fractionation could contribute to variation in the δ13C of dissolved inorganic carbon. The connection between FG and Lake Turkana does not allow Omo River's sediment-laden water to regularly enter the gulf based on a review of satellite images (NASA, 2018). Therefore, there is no strong evidence of a regular Omo River water source directly recharging FG. Tributaries feeding directly into FG are all ephemeral streams, and since the region frequently gets <200 mm of rain, local sourcing would be limited to nonexistent for most years in the past decades. However, during wetter times with higher precipitation, this contribution might have been more significant.
CONCLUSION
The basal radiocarbon date places the base of core FG3 (Zone 1) in the LIA, which spanned ~AD 1550–1850. Regionally, the high degree of climatic spatial variability across eastern Africa is summarized in Figure 6, which shows the contrast between the drought experience in Ugandan lakes in the Western Branch of EARS (Russell et al., Reference Russell, Eggermont and Verschuren2007) and the relative highstands in lakes and wetlands from within the Eastern Branch of EARS (Verschuren et al., Reference Verschuren, Laird and Cumming2000; Ashley et al., Reference Ashley, Maitima Mworia, Muasya, Owen, Driese, Hover, Renaut, Goman, Mathai and Blatt2004; Driese et al., Reference Driese, Ashley, Li, Hover and Owen2004; Stager et al., Reference Stager, Ryves, Cumming, Meeker and Beer2005). This study supports the establishment of wet LIA conditions in the Turkana Basin during AD 1500–1600s, based on the radiocarbon date from Zone 1. High diversity and abundance of ostracods in this zone indicate wet conditions and establish that FG, and thus Lake Turkana, was in highstand during the LIA. When deposition resumes in Zones 2–5, the biozones are characterized by an overall decrease in ostracod diversity and abundance moving up-core, suggesting that decreasing lake levels undermined the health and resiliency of this key ecological niche. This change alone cannot be explained by preservation due to the presence of other delicate biologic material such as ephippia and cysts, particularly in Zones 2 and 1. Therefore, the record presented by this study reveals a trend toward increased aridification, higher levels of alkalinity, and more frequent desiccation, resulting in ecological instability in the Turkana Basin. FG appears to have functioned as an amplifier for changes in the base level and overall ecological health of Lake Turkana. Lake-level changes coupled with human activities such as commercial fishing have stressed and degraded ecosystems in FG to a level unprecedented across this time scale.
ACKNOWLEDGMENTS
Geological Society of America student grants-in-aid, a Society for Sedimentary Geology student grant, an American Association of Petroleum Geologists student grant, a Paleontological Society student grant, and a Rutgers Special Study Award provided funding to Beck for this research. Funds for AMS dating were provided to Quinn from the Seton Hall University College of Arts and Sciences dean's office summer research program. Thanks to Anders Noren and LacCore for technical advice on coring and all things lacustrine. We acknowledge Chad Yost and Lynda Beladjal for assistance with achene and cyst identification, respectively. Field support for this research was provided through the Turkana Basin Institute, with the assistance of John Malala, David Lotuliakou, Francis Ekai, and R. Linda Martin in both logistics and execution of coring in FG. We also extend thanks to the anonymous reviewers who helped improve this manuscript through their feedback. We acknowledge the use of imagery from the Worldview Snapshots application (https://wvs.earthdata.nasa.gov/), part of the Earth Observing System Data and Information System.
SUPPLEMENTARY MATERIAL
The supplementary material for this article can be found at https://doi.org/10.1017/qua.2020.105