

Introduction
During the last 10–15 years, several western countries have initiated extensive reforms of their health services. For example, this is reflected in the introduction of internal markets in the National Health Service in Great Britain. Reforms have also been initiated in the Norwegian health services (Ministry of Health and Social Affairs, 1998; Ministry of Health and Social Affairs, 1999; Ministry of Health, 2001). On 1 June 2001, a reform of Norwegian primary physician services took place. A regular general practitioner scheme was then introduced (Ministry of Health and Social Affairs, 1999).
To a large extent, the result of the reforms in Great Britain and Norway is that health services in these countries are organized as quasi-markets. These are markets characterized by competition and free consumer choice, combined with public financing of services (LeGrand, Reference LeGrand2007). Quasi-markets are supposed to improve efficiency in public service provision, without impairing egalitarian objectives. Many comprehensive studies have been been carried out in which the characteristics of these markets in terms of efficiency have been analysed (for example see: Culyer et al., Reference Culyer, Maynard and Posnett1990; OECD, 1995; Fenn et al., Reference Fenn, Rickman and McGuire1994; Goddard and Mannion, Reference Goddard and Mannion1998; Jones and Cullis, Reference Jones and Cullis1996; Grytten and Sørensen, Reference Grytten and Sørensen2007). There are also some studies, but these studies are less comprehensive, in which the effects of these markets on the quality and costs of health services have been evaluated. Much of the empirical literature is from Great Britain, and deals with specialist health services (for example see LeGrand et al., Reference LeGrand, Mays and Mulligan2001; Milne and Torsney, Reference Milne and Torsney2003; Propper et al., Reference Propper, Burgess and Green2004; Propper et al., Reference Propper, Burgess and Gossage2008).
The aim of this study was to investigate the effects that quasi-markets have on access to health services, in particular access to primary physician services in Norway. This is a research area in which little empirical research has been carried out, but which is nevertheless an important area to investigate. Ideally, it is expected that competition and free consumer choice should lead to little rationing and good access to primary physician services.
The article is organized as follows. In the next section we give a short summary of some of the characteristics of quasi-markets in relation to primary physician services in Norway. We then describe some important characteristics of primary physician services in Norway. These are important because the framework for the ensuing analyses is defined by the institutional setting. We then present our data and the empirical model. In the last sections we present the results and discuss some of the policy implications of our findings.
Quasi-markets and access to primary physician servicesin Norway
Quasi-markets are like other markets in that independent providers compete for customers. But they are different from other markets in that the services are not financed, or are only to a small degree financed, by patient fees. The services are funded by the state.
An important justification for quasi-markets is that they provide incentives for physicians to provide services that are both efficient and of high quality (LeGrand, Reference LeGrand2007; Enthoven, Reference Enthoven1999). Physicians are usually remunerated in such a way that they will loose income if they do not respond to the wishes and needs of their patients. If patients are dissatisfied with the services offered, then physicians can improve their practice in order to keep their patients. The physicians who offer high quality services have an incentive to continue to do so, both to keep their existing patients and to attract new patients.
Free patient choice is therefore a necessary condition in order for these markets to ensure good access to services. The alternative to free choice of physician is public management of service provision, in which patients are allocated a physician or a hospital that they have to use in the case of illness. In principle, governments can keep a record of capacity and waiting times for alternative service producers. But administrative procedures are often too costly or too slow in order for administrators to keep track of fluctuations in availability (Besley and Ghatak, Reference Besley and Ghatak2003). When patients have free choice, they have an incentive to seek information about access. User choice may improve access both for those who actively search for physicians with short waiting times and for those who remain faithful to a particular physician.
A disadvantage of quasi-markets may be higher government costs. A certain amount of excess supply of physicians is required. If all physicians have a lack of capacity to see new patients, it is hard to see how patients can exercise their right to choose a physician. Therefore, in order to get a quasi-market to function, more physicians are required in a quasi-market than in a type of market where patients have no free choice of physicans. If physicans are salaried, excess supply will raise government costs. In addition, more physians need to be trained, which in itself is costly as long as the government covers the training costs.
With the reform of primary physician services that was implemented in Norway on 1 June 2001, patients were given the statutory right to have a regular general practitioner (Ministry of Health and Social Affairs, 1999). They had no such right prior to the reform. Through continuity in the relationship between the physician and the patient, it was expected that the physician could do a better job for the patient with regard to diagnosis, treatment, referral to a specialist or hospital, follow-up and check-up.
With the reform, free choice of physician was also taken account of (Ministry of Health and Social Affairs, 1999). Patients are able to decide themselves which regular general practitioner they wish to be registered with. Further, patients have the right to change their regular general practitioner twice a year if they are dissatisfied with the physician they have been allocated. Patients also have the right to visit a general practitioner who is not their regular general practitioner, without changing their regular general practitioner. They can do this without paying more for a consultation and treatment than they would have done if they had visited their own regular general practitioner. However, in order for people to really have free choice of physician, there must be a sufficient number of physicians with spare capacity – there must be some physicians to change to.
The authorities took this into account when the reform was implemented. From just before the reform was introduced, until just after it was introduced, the number of man-years for primary physicians increased by about 18%Footnote 1 (Statistics Norway, 2007; Bakke, Reference Bakke2003). This was the authorities’ intended policy (Norwegian Association of Local and Regional Authorities, 1999). With good coverage of physicians, it was expected that access to primary services would be good. One effect of the increase in the number of man-years for primary physicians was that not all primary physicians were allocated a sufficient number of patients. After the introduction of the reform, several studies have shown that between one quarter and one fifth of physicians report that they have too few patients on their list (Grytten et al., Reference Grytten, Skau, Sørensen and Aasland2004a; Hetlevik and Hunskår, Reference Hetlevik and Hunskår2004; Carlsen, Reference Carlsen2003). Young physicians in particular wish to have more patients. Older physicians are the most popular, and there is a tendency for them to have more patients on their list than they actually wish to have.
Our focus was to study how spare capacity influences physicians’ competition for patients, and thus the availability of primary physician services. We investigated this issue in two stages:
In the first stage we investigate whether there is a positive relationship between access to primary physicians and whether primary physicians have spare capacity or not. Primary physicians with spare capacity wish to attract new patients, while at the same time they do not want to loose any of their existing patients. Therefore, they have an incentive to ensure that access to their practice is good, for example by having long opening hours and short waiting times.
In the second stage we investigated how patients move between primary physicians. In particular, we investigated whether patients move from physicians who have a lack of capacity to physicians who have spare capacity. If this is the case, this will ensure availability of primary physician services for the patients who have to wait a long time to get an appointment with their own regular general practitioner. Dissatisfied patients can be satisfied if they find a physician who has time to see them. Free patient choice and mobility of patients between regular general practitioners then results in improved utilization of resources in primary physician services.
Institutional set-up: primary physicians in Norway
In Norway, the municipalities (n = 431 in 2006) are responsible for organizing primary health care, including primary physician services. There is one national insurance office in each municipality. Primary physicians inform this office about how many patients they wish to have on their list. Inhabitants inform the local national insurance office about which physician they wish to be on the list of. The local national insurance offices allocate patients to regular general practitioners according to the wishes of the patients. This means that patients get the physician they wish to have if the physician has spare places on his or her list. Physicians cannot decide themselves which patients are allocated to their list. Physicians must accept the patients they are allocated. The mean number of patients on the list per physician is about 1,300 (Grytten et al., Reference Grytten, Skau, Sørensen and Aasland2004b).
Primary physicians receive NOK 299 (50 USD) per year per patient on their list. This sum is the same for all primary physicians, irrespective of where they work. The per capita component is meant to make up about 30% of primary physicians’ income.
Primary physicians obtain additional income from patient fees and from payments from the National Insurance Administration. Patient fees contribute about 30% of the gross income of primary physicians (Ministry of Health and Social Affairs, 1999). Patients pay a set fee for each consultation with the physician, whereas items of treatment are free. In 2006, the fee for a consultation was NOK 130 (22 USD). Payments received from the National Insurance Administration contribute about 40% of physician’s gross income from practice. The major items which incur a payment from the National Insurance Administration are laboratory tests and consultations lasting more than 20 minutes (Skau, Reference Skau1998). The latter payment is used for patients who are time-consuming to treat. This item was introduced so that primary physicians would not avoid patients with special needs. The level of patient fees and the level of payments from the National Insurance Administration are regulated by an agreement (the normal tariff), which is negotiated annually between the Norwegian Medical Association and the Ministry of Government Administration.
Methods
Data and variables
The study is based on data collected from the Survey of Living Conditions (Hougen and Gløboden, Reference Hougen and Gløboden2004; Normann, Reference Normann2004). These data are collected annually by Statistics Norway. The size of the sample and the questions that are used vary from year to year. In order to investigate the relationship between spare capacity and access to primary physicians, we used data from 2003. Spare list capacity and patient mobility were investigated using data from 2002.
The population that the samples were drawn from consists of all people living at home aged 16 and older. The data collection was carried out using a combination of home visit interviews, telephone interviews, and postal questionnaires. In 2003 the response rate was 69.7%, which gave a sample of 3,532 people (Normann, Reference Normann2004). In 2002 the response rate was 70.0%, which gave a sample of 6,827 people (Hougen and Gløboden, Reference Hougen and Gløboden2004). For both years the non-responders were evenly distributed according to age and place of residence (Normann, Reference Normann2004). Women were slightly underrepresented.
Patient access (2003) was measured using three questions: number of days to wait for an appointment with the doctor the last time they visited the doctor, how satisfied/dissatisfied the respondents were with waiting time to get an appointment, and their satisfaction with how easy it was to get through on the telephone to book an appointment.Footnote 2 The questions about satisfaction had four response alternatives on a scale from 1 (dissatisfied) to 4 (very satisfied). Patient mobility (2002) was measured by asking whether the respondents had had contact with a general practitioner other than their own regular general practitioner during the last 12 months.
In addition, the survey data contained information about the respondents gender, age, level of education, family income after tax,Footnote 3 number of individuals in the household, whether they had chronic illnesses or not, and subjective evaluation of health status, measured as poor health, average health, and good health.Footnote 4
For every respondent in the Survey of Living Conditions, using the Norwegian Social Science Data Services, we merged data as follows: data for each respondent were merged with data for the respondents’ regular general practitioner (the desired number of patients on the list and the actual number of patients on the list).Footnote 5 Thus, we know whether the respondent was registered with a physician who had a deficit of patients (spare capacity) or a surplus of patients (lack of capacity), or with a physician whose number of patients on the list was just right. We assume that physicians in the latter group were satisfied with the number of patients on their list. The limit for just right was set to +/–100 patients on the list. We tested our results for robustness, with the difference set to higher or lower than 100 patients on the list. The main results were robust, and showed very little change when other differences were used. Our measure of spare or lack of capacity is based on physicians’ own assessement of their workload, and thus it reflects whether they are able to see more patients or not (Grytten and Sørensen, Reference Grytten and Sørensen2008)
Empirical implementation
The above discussion leads to three hypotheses which can be tested:
Physicians with spare capacity have shorter waiting times than physicians who have a lack of capacity.
Patients are more satisfied with physicians with spare capacity than physicians who have a lack of capacity.
When aggregate physician supply within a municipality exceeds aggregate demand, patients shift from physicians with a lack of capacity to physicians with spare capacity.
We regressed actual waiting times, patient satisfaction, and patient mobility against physicians’ working capacity. The principal regression model is:

where Y represents the following response variables: actual waiting time for an appointment,Footnote 6 patient satisfaction (as measured by the two survey questions described above),Footnote 7 and patient mobility.Footnote 8
DEFICIT is an indicator of whether the physician has a deficit of patients (= 1, otherwise 0). SURPLUS is an indicator of whether the physician has a surplus of patients (= 1, otherwise 0). The reference category comprises those physicians who are satisfied with the number of patients.
The third hypothesis requires data about aggregate supply and demand. We constructed an index at the municipal level. Within each municipality we counted how many physicians had a deficit of patients and how many physicians had a surplus of patients. The index was constructed by dividing the number of physicians who had a deficit of patients with the number of physicians who had a surplus of patients. If the index has a value more than 1, there are more physicians who have a deficit of patients on their list than physicians who have a surplus of patients. The municipality thus has net spare capacity, and patients on the list of a physician with a surplus of patients have good possibilities to get an appointment with a physician who has a deficit of patients.
In municipalities where the index has a value less than 1, there are more physicians who have a surplus of patients than physicians who have a deficit of patients. The supply of physicians who can accept external patients is lower than the potential supply of patients from physicians who have a surplus of patients. In these municipalities there was little spare capacity to accept patients who were not on the patient list.
Municipalities were classified into two sub-samples, one with an index greater than 1, and the other where the index was less than or equal to 1. In the sub-sample with an index greater than 1, we expected α 2 (equation (1)) to be positive. In the other sub-sample (index less than or equal to 1), the regression coefficient α2 was expected to be approximately equal to 0.
Results
Descriptive statistics
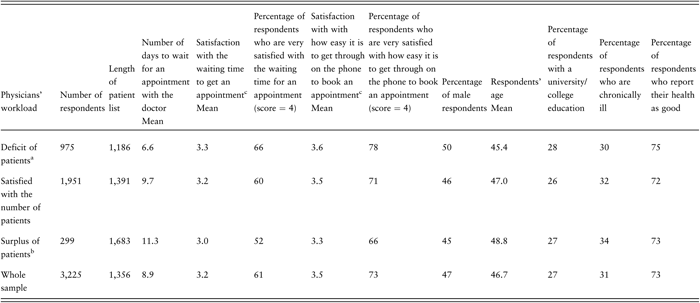
Table 1 presents descriptive statistics for some of the key variables according to physicians’ workload. The mean waiting time for an appointment was 6.6 days for patients who visited a physician with a deficit of patients. The corresponding figure for those who visited a physician with a surplus of patients was 11.3 days. The length of patient list was longest for physicians who had a surplus of patients.
The distribution of selected variables according to physician's workload: Survey of Living Conditions 2003

Notes: aDeficit of patients: the desired length of patient list – the actual length of patient list >= 100 patients
bSurplus of patients: the desired length of patient list – the actual length of patient list <= –100 patients
cMeasured on a scale from 1 to 4 (1 = very dissatisfied, 4 = very satisfied).
Sixty six per cent of the respondents who were registered with a physician who had a deficit of patients reported that they were very satisfied (= best alternative) with waiting time for an appointment. The corresponding figure for those who were registered with a physician who had a surplus of patients was 52%. The pattern is similar with regard to satisfaction with how easy it is to get through on the telephone to book an appointment: Those who were registered with a physician with a deficit of patients were more satisfied than those who were registered with a physician with a surplus of patients.
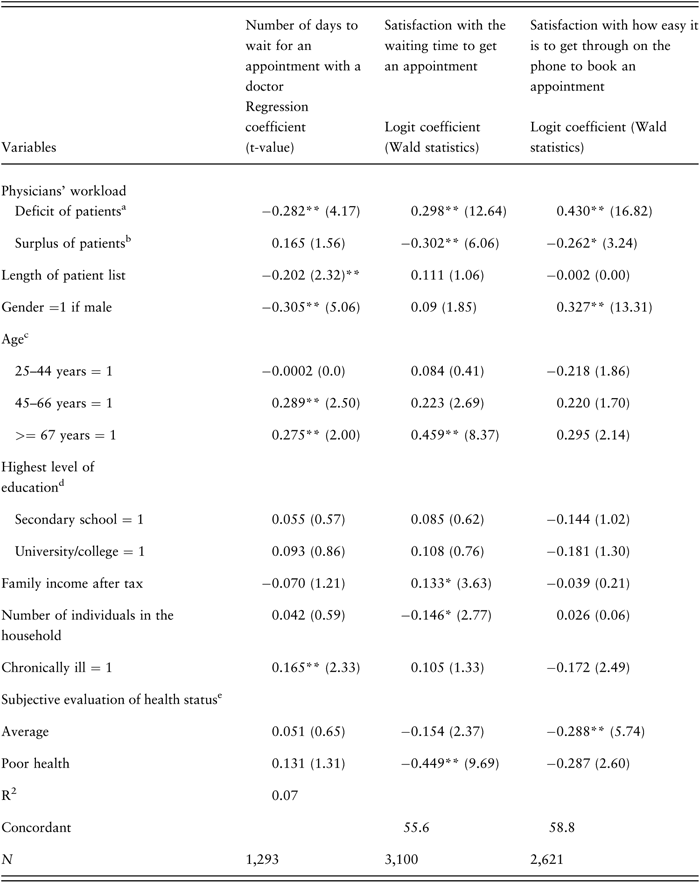
Characteristics of the patients were also related to the physicians’ workload (Table 1). Respondents who were registered with a physician who had a deficit of patients were younger, and the proportion of men was higher, compared to those who were registered with a physician who had a surplus of patients. There was also a slightly higher proportion of respondents who were chronically ill who were registered with a physician who had a surplus of patients. In Table 2, we present results for our key variables (DEFICIT and SURPLUS) after characteristics of the respondents have been controlled for.
The effects of physicians' workload on actual waiting time, and satisfaction with waiting time and time for booking an appointment: data from the Survey of Living Conditions 2003

Notes: Continuous variables in logarithmic form. Intercepts not reported.
* p < 0.10
** p < 0.05
a = 1 if the desired length of patient list – the actual length of patient list >= 100 patients
b = 1 if the desired length of patient list – the actual length of patient list <= –100 patients
c Reference category: < 25 years
d Reference category: compulsory schooling only
e Reference category: good health
Waiting time and satisfaction
Actual waiting time for an appointment was 28.2% lower for patients who visited a physician with a deficit of patients compared to those who visited a physician who was satisfied with the number of patients (= reference category) (Table 2).Footnote 9 The difference was statistically significant at the 5% level. Those who visited a physician who had a surplus of patients had the longest waiting time – 16% longer than those who visited a physician who was satisfied with the number of patients on his or her list (t-value = 1.56; p = 0.12). However, this difference was not statistically significant at the conventional level (p < 0.10).
Patients who were registered with a physician who had a deficit of patients were significantly more satisfied with waiting time to get an appointment than those who were registered with a physician who was satisfied with the number of patients. The logit coefficient was 0.298 (p < 0.05). This gives a probability of being most satisfied (= best alternative) of 0.66.Footnote 10 Those who were registered with a physician who had a surplus of patients were most dissatisfied (logit coefficient –0.302; p < 0.05). The probability of being most satisfied (= best alternative) for this group of respondents was 0.52.
Our two key explanatory variables (DEFICIT and SURPLUS) also had clear effects on satisfaction with how easy it was to get through on the telephone to book an appointment. The logit coefficient if registered with a physician who had a deficit of patients was 0.43 (p < 0.05). The corresponding probability of being most satisfied (= best alternative) was 0.79. The probability of being most satisfied (= best alternative) was 0.65 for those who were registered with a physician who had a surplus of patients.Footnote 11
The control variables showed interesting results (Table 2). The age group 67 years and older had a long waiting time measured as number of days – as much as 27.5% longer than the youngest age group 16–24 years. At the same time, the oldest age group was most satisfied with waiting time to get an appointment. Neither waiting time nor satisfaction with waiting time were related to the respondents’ level of education or level of income. People who were chronically ill had 16.5% longer waiting time compared to people who were not chronically ill, and those with poor health were the least satisfied with waiting time to get an appointment.
Patient mobility
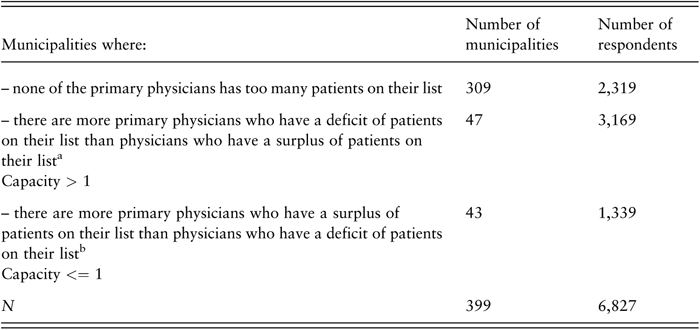
In Table 3, the municipalities are grouped according to the level of the index.Footnote 12 For 47 municipalities, the value of the index was greater than 1, that is these municipalities could constitute the sub-sample that we could use to test whether the logit coefficient α 2 (equation (1)) was positive. The sample from the Survey of Living Conditions 2002 had 3,169 respondents from these municipalities. For 43 municipalities, the value of the index was equal to 1 or lower. This represented 1,339 respondents. In these municipalities we could test whether the logit coefficient α2 was approximately equal to 0.
Descriptive statistics: survey of Living Conditions 2002

Notes: a Deficit of patients: the desired length of patient list – the actual length of patient list >= 100 patients
b Surplus of patients: the desired length of patient list – the actual length of patient list <= –100 patients
In 309 municipalities, there were no physicians who had ‘too many’ patients on their list. These are mainly small municipalities. For these municipalities, it was not possible to study patient mobility from physicians who had a surplus of patients to physicians who had a deficit of patients.
In municipalities where the value of the index was greater than 1, the logit coefficient α 2 (equation (1)) was 0.554 (p < 0.05) for respondents who were registered with a physician who had a surplus of patients (Table 4, column 2). This gives a probability of 0.12 for having had contact with a general practitioner other than one’s own regular general practitioner. For respondents who belonged to the reference category (registered with a physician who was satisfied with the number of patients), the probability was 0.07. In other words, in municipalities with a lot of spare capacity, there was almost twice the probability for patients to consult another primary physician if their regular general practitioner had a surplus of patients, compared to if their regular general practitioner was satisfied with the number of patients.
The effects of physicians' workload on patient mobility: data from the Survey of Living Conditions 2002

Notes: Continuous variables in logarithmic form. Intercepts not reported.
* p < 0.10
** p < 0.05
a = 1 if the desired length of patient list – the actual length of patient list >=100 patients
b = 1 if the desired length of patient list – the actual length of patient list <=–100 patients
c Reference category: < 25 years
d Reference category: compulsory schooling only
e Reference category: good health
If a regular general practitioner had a deficit of patients, the probability for a patient consulting another physician did not increase (Table 4, column 2). In the light of the results shown in Table 2, this is a reasonable result. Patients on the list of a physician who has a deficit of patients have such good access to their regular general practitioner that they do not need to see another physician.
In municipalities where the value of the index was less than or equal to 1, the logit coefficient α 2 for a surplus of patients was almost 0, and did not reach statistical significance at conventional levels (Table 4, column 3). This was also expected – patients could not consult a physician other than their own, because in these municipalities there were very few other physicians who had spare capacity.
The control variables generally had the same magnitude and sign in the two sub-samples. The effects were also not unexpected. For example, the probability of changing physician reduced with age. People who are chronically ill and those who assess their health status as poor have the highest probability for changing their physician.
Discussion
The empirical results show that a quasi-market can ensure good access to services. But in order for competition to be effective, the supply of primary physicians within the municipality should be sufficient so that some physicians have an incentive to attract new patients (Table 4). Alternatively, physicians should have an incentive to provide a service of such high quality that they keep their patients satisfied and do not loose them (Table 2). Such an incentive is present if physicians have been allocated fewer patients on their list than they desire (Chalkley and Malcomson, Reference Chalkley and Malcomson1998).
Between one quarter and one fifth of physicians report that they have too few patients on their list (Grytten et al., Reference Grytten, Skau, Sørensen and Aasland2004a; Hetlevik and Hunskår, Reference Hetlevik and Hunskår2004; Carlsen, Reference Carlsen2003). These physicians have an incentive to have longer opening hours and to be more available, for example by telephone, so that they can attract new patients more easily and keep their existing patients. Because patients have the possibility to visit a physician other than their own regular general practitioner, they are not ‘stuck’ with physicians who have too little capacity to provide adequate services for their patients. On the other hand, some patients often prefer to see their own physician even if that means longer waiting times. In particular this can be the case if the patient suffers from conditions where there is no urgent need to see a physician. For these patients it is of less importance that there are physicians other than their own regular general practitioner who have excess capacity, and who can see them.
The regular general practitioner scheme in Norway is not meant to be a rigid system, in which patients are tied to a specific physician (Ministry of Health and Social Affairs, 1999). In order to stress that patient choice and mobility of patients between regular general practitioners is both acceptable and desired, there is no economic disadvantage if patients consult a physician who they are not registered with. When there is a need, patients who are registered with a physician who has a surplus of patients can consult a regular general practitioner who has spare capacity. Both patients and physicians thus exercise a kind of flexibility that avoids unnecessary waiting and queues for regular general practitioners. The gain is increased welfare through better accessibility.
The current regular general practitioner scheme is based on regulated prices and control of the establishment of medical practices. In such a market, a certain level of overcapacity is presupposed, in order for free choice of physician to be possible, since the normal price mechanisms for regulating supply and demand for primary physician services do not operate. During one year, about 10% of inhabitants consult regular general practitioners who they are not registered with (Finnvold et al., Reference Finnvold, Svalund and Paulsen2005). A certain level of over-capacity gives patients a real choice. Therefore, based on our analyses, we see no reason to reduce the supply of primary physicians in Norway. From a consumer perspective, it is actually more favourable if a physician has some overcapacity rather than undercapacity. This means that the supply of primary physicians in Norway should be slightly increased rather than limited. Such a policy is also supported by another important finding of the study. It is that the waiting times for an appointment with both types of general practitioners – 6.6 days for physicians with spare capacity and 11.3 days for those without spare capacity – are unacceptably long, and longer than in more market-oriented systems such as in Germany or in the Netherlands.
A policy of slightly increasing the supply of primary physicians in Norway is also in accordance with some of the recent research on the effect of primary physician services on the health status of the population (Macinko et al., Reference Macinko, Starfield and Shi2003; Macinko et al., Reference Macinko, Starfield and Shi2007; Starfield and Shi, Reference Starfield and Shi2002). Comprehensive analyses of OECD data have shown that in countries with well-developed primary physician services, the health status of the population is better than in countries where primary physician services are not so well developed (Macinko et al., Reference Macinko, Starfield and Shi2003). Analyses of data from the USA have also shown a positive association between the number of primary physicians and the health status of the population (Starfield and Shi, Reference Starfield and Shi2002). For example, calculations have shown that an increase of one primary physicians per 10,000 inhabitants can lead to a reduction in mean mortality of 5.3%. The reason for this is that good access to primary physician services results in prevention of disease, detection of disease at an early stage, and immediate implementation of effective treatment.
In conclusion, we find that patients benefit when some physicians have open lists. Some overcapacity in the market for primary physician services allows patients a real choice of provider. This is particularly important for patients who are registered with a physician who has a surplus of patients. Some excess supply appears to be beneficial. The present quasi-market for primary physician services in Norway is based on free consumer choice and competition between physicians for patients. Our results support the hypothesis that such a market can secure access to primary physician services. On the other hand, waiting times for an appointment with a general practitioner are still unacceptably long. This indicates that free choice of provider and excess capacity are not sufficient measures to keep waiting times short.
Acknowledgements
The authors wish to thank Linda Grytten for translating the Norwegian manuscript into English, and Irene Skau for technical assistance.