Implications
By 5 weeks of age conventionally reared meat chickens have reduced mobility, spending more time sitting and lying than standing and walking. In two predominant strains of meat chicken Slow start incubation, employing lower egg shell temperature (EST) for the first 15 days of incubation, delayed hatch, reduced chick length (from the beak tip to the top of the middle toe nail) but increased chick weight at take-off (removal of chicks from the hatching tray at 21.5 days of incubation). Chick length at take-off may more accurately reflect the time the chick hatched rather than chick quality. Importantly, Slow start incubation significantly increased the standing time of 5-week-old birds of both strains, offering a practical approach to improving the leg strength of meat chickens.
Introduction
The reduced mobility experienced by meat chickens, which is especially evident during the finishing stages of their production (Knowles et al., Reference Knowles, Kestin, Haslam, Brown, Green, Butterworth, Pope, Pfeiffer and Nicol2008), has driven the exploration of approaches to improve their leg health. As the growth rates of conventionally reared meat chickens continue to increase, the bird is spending an increasing proportion of its existence in the egg. Bone development occurs during embryogenesis (Brookes and May, Reference Brookes and May1972; Ballock and O’Keefe, Reference Ballock and O’Keefe2003), and therefore, events that the embryo is exposed to in ovo that influence bone growth can impact the chick’s leg strength at hatch, with possible consequences throughout the life of the bird.
The opportunity to use incubation conditions to modify the bone development and leg strength of broiler birds has received considerable attention. However, there are several challenges in comparing the outcomes of these studies due to the different experimental methods used including how incubation temperature is measured. Some reports refer to incubator air temperature (Oviedo-Rondón et al., Reference Oviedo-Rondón, Small, Wineland, Christensen, Mozdziak, Koci, Funderburk, Ort and Mann2008; Oviedo-Rondón et al., Reference Oviedo-Rondón, Wineland, Funderburk, Small, Cutchin and Mann2009a; Willemsen et al., Reference Willemsen, Kamers, Dahlke, Han, Song, Ansari Pirsaraei, Tona, Decuypere and Everaert2010; Shim and Pesti, Reference Shim and Pesti2011), whereas others have used EST (Lourens et al., Reference Lourens, van den Brand, Meijerhof and Kemp2005; Lourens et al., Reference Lourens, van den Brand, Heetkamp, Meijerhof and Kemp2007; Ipek et al., Reference Ipek, Sahan, Baycan and Sozcu2014; Groves and Muir, Reference Groves and Muir2014; Muir and Groves, Reference Muir and Groves2018). Concurrently, the stage of embryonation (E) at which temperature treatments have been introduced and, the duration of the temperature treatments, have differed in addition to different bird genotypes and the age of the breeder flock. Finally, the leg health of meat chickens can be assessed using a variety of methods, which is in part a reflection of the age of the bird and the preference of the research team. For example, assessment of bone development in ovo and at hatch typically includes characteristics such as bone length, bone weight, bone symmetry and bone ash (BA) (Hammond et al., Reference Hammond, Simbi and Stickland2007; Oviedo-Rondón et al., Reference Oviedo-Rondón, Small, Wineland, Christensen, Mozdziak, Koci, Funderburk, Ort and Mann2008; Oviedo-Rondón et al., Reference Oviedo-Rondón, Wineland, Small, Cutchin, McElroy, Barri and Martin2009b; Muir and Groves, Reference Muir and Groves2018). In contrast, throughout the growing period assessment of leg health and bone disorders can include evaluation of foot pad dermatitis, hock bruising, femoral head necrosis, tibial dyschondroplasis (TD), gait score and latency-to-lie (LTL) (Oviedo-Rondón et al., Reference Oviedo-Rondón, Wineland, Small, Cutchin, McElroy, Barri and Martin2009b; Groves and Muir, Reference Groves and Muir2014; Škrbić et al., Reference Škrbić, Pavlovski, Lukić and Petrićević2015; Ipek and Sozcu, Reference Ipek and Sozcu2016; Groves and Muir, Reference Groves and Muir2017). The results from these experiments have been equivocal, preventing the recommendation of specific incubation conditions that will consistently benefit the leg strength of commercial meat chickens.
Short-term exposure to hot or cold air temperature during incubation affects skeletal growth in the young embryo (Brookes and May, Reference Brookes and May1972; Oviedo-Rondón et al., Reference Oviedo-Rondón, Small, Wineland, Christensen, Mozdziak, Koci, Funderburk, Ort and Mann2008, Reference Oviedo-Rondón, Wineland, Small, Cutchin, McElroy, Barri and Martin2009b). Studies comparing high air temperature (39°C) late in incubation (day 17 to 21 E) with a constant control temperature (37.5°C) throughout incubation, demonstrated that higher temperatures reduced the relative weight and length of the femur and tibia while the combination of higher temperature with lower oxygen concentration increased the relative asymmetry of shank weight (Oviedo-Rondón et al., Reference Oviedo-Rondón, Small, Wineland, Christensen, Mozdziak, Koci, Funderburk, Ort and Mann2008). However, compensatory growth during the late stages of incubation can result in no significant differences in skeletal development at hatch (Yalcin and Siegel, Reference Yalcin and Siegel2003). Multistage incubators, where eggs at different stages of embryonic development are held under the same incubator climate settings, often result in overheating of eggs (Hulet, Reference Hulet2007). This has led to more frequent toe deformities and higher gait scores compared to single stage incubators (Oviedo-Rondón et al., Reference Oviedo-Rondón, Wineland, Funderburk, Small, Cutchin and Mann2009a), where all eggs are at a similar stage of embryo development and incubator climate settings can be adjusted accordingly.
Other assessments of incubation conditions have utilized EST rather than incubator air temperature, as EST gives a more accurate measure of the temperature experienced by the embryo (Lourens et al., Reference Lourens, van den Brand, Meijerhof and Kemp2005). A very high EST (39.4°C) appears to be most debilitating for bone development at hatch in terms of bone length and weight (van der Pol et al., Reference van der Pol, van Roovert-Reijrink, Maatjens, van den Anker, Kemp and van den Brand2014), compared to either high (38.6°C), control (37.8°C) or low (36.9°C) EST. Interestingly Ipek and Sozcu (Reference Ipek and Sozcu2016) found control EST (37.8°C to 38.2°C) and, high EST (38.9°C to 40.0°C), during days 10 to 18 E, resulted in poorer gait scores in 6-week-old birds compared to incubation under low EST (33.3°C to 36.7°C) during the same period.
With a focus on improving leg health, we have identified that EST’s below the recommended temperature of 37.8°C for the first 13 to 15 days of incubation, named Slow start incubation, can increase BA at hatch and LTL of a fast feathering dam line (Groves and Muir, Reference Groves and Muir2014). Similar benefits of Slow start incubation were observed with the BA of Cobb 500 birds at hatch (Muir and Groves, Reference Muir and Groves2018), in addition to a reduced predisposition to TD (Groves and Muir, Reference Groves and Muir2017). In all studies, the Slow start incubation delayed hatch time, reducing the duration of chick sojourn, that is, the time the hatched chick spends in the hatcher tray. Shim and Pesti (Reference Shim and Pesti2011) were the first to flag a possible consequence of chick hatch time and therefore the duration of the sojourn, on leg health. They suggested that earlier hatching chicks have a greater chance of becoming dehydrated, which may affect bone development. In our studies chicks with a longer sojourn were not dehydrated when compared to later hatching chicks with a shorter sojourn (Muir and Groves, Reference Muir and Groves2018). Despite this the exact impact of chick sojourn on bone development and leg strength requires further exploration in purpose designed experiments.
While Slow start incubation has consistently delayed hatch time and improved leg strength in a fast feathering parent line and increased BA at hatch in Cobb 500 chicks, it is still unknown whether these benefits will be consistent across meat chicken genotypes. Meat chicken genotypes that exhibit a higher growth rate display different behaviours including reduced levels of locomotion, compared to slower growing strains (Bizeray et al., Reference Bizeray, Leterrier, Constanin, Picard and Faure2000; Reiter and Kutritz, Reference Reiter and Kutritz2001). Faster early growth has also been associated with poorer leg health (Kestin et al., Reference Kestin, Su and Sørensen1999; Škrbić et al., Reference Škrbić, Pavlovski, Lukić and Petrićević2015) and TD (Groves and Muir, Reference Groves and Muir2017). Further, variations in embryo physiology between genotypes results in different embryonic growth rates (Tona et al., Reference Tona, Onagbesan, Kamers, Everaert, Bruggeman and Decuypere2010; Nangsuay et al., Reference Nangsuay, Meijerhof, van den Anker, Heetkamp, Kemp and van den Brand2015), and hatch times. The effect of changed incubation conditions and altered hatch time on bone development and leg strength of different genotypes requires evaluation.
Therefore, this experiment was designed to compare the effect of a Standard and Slow start incubation EST, during the setting phase (from day 0 until day 18 E), on the leg strength of two predominant strains of commercial meat chickens. Hatch time and overall hatchability were recorded. At a common take-off time (removal of chicks from the incubator) of 516 h of incubation, chick weight, chick length and BA were measured. The ability of the male birds to stand when 5 weeks of age was evaluated using a LTL test.
Material and methods
Fertile eggs
Two hundred and sixteen fertile eggs (day 0 E) of each strain (Cobb 500, identified as Strain 1 and Ross 308, identified as Strain 2) of meat chicken were obtained from their respective 32 to 35-week-old breeder flocks. Eggs were transported to the Poultry Research Foundation, The University of Sydney, Camden, and stored at 16°C for 6 days. Each egg was weighed before being preheated to 25°C 10 h before setting the eggs in the incubators.
Incubators
E2A incubators (Multiquip Pty Ltd, Austral, NSW, Australia), as reported in Muir and Groves (Reference Muir and Groves2018), each with a capacity of 288 eggs, were used during the setting phase (day 0 to 18 E) of incubation. These incubators have forced ventilation, evaporative humidity, digital temperature control and automated turning, which was programmed to turn every hour during the setting phase. The incubators were housed in an environmentally controlled room maintained at 25°C, at the Poultry Research Foundation, The University of Sydney, Camden, NSW, Australia (Muir and Groves, Reference Muir and Groves2018).
On day 18 of incubation, all eggs were transferred into one AussiesetTM incubator (Bellsouth Pty Ltd, Narre Warren, VIC, Australia) where they remained until chick take-off from the incubator at 21.5 days of incubation. The AussiesetTM incubator had digital temperature control, forced ventilation and spray humidifiers (Muir and Groves, Reference Muir and Groves2018).
Throughout the setting phase EST was measured on four eggs per E2A incubator, one on each of the four levels of the incubator (Muir and Groves, Reference Muir and Groves2018). Egg shell temperatures were determined using Remote Intelligent Multisensors (TSIC716 Advanced sensor technology; Netic Pty Ltd, Ryde, NSW, Australia) which were attached to the equator of the egg using thermal paste (Silicon heat transfer compound, Unick Chemical Corp., Taoyuan City, Taoyuan, Taiwan). The sensors were connected to a remote monitor (Uptime Devices, Ryde, NSW, Australia) which was connected to a notebook computer containing the Netic Sensor Man (Netic Pty Ltd) software programme (Muir and Groves, Reference Muir and Groves2018). Egg shell temperature was recorded every minute. If required, the incubator settings were adjusted to match the intended EST treatment.
Experimental design
Egg incubation
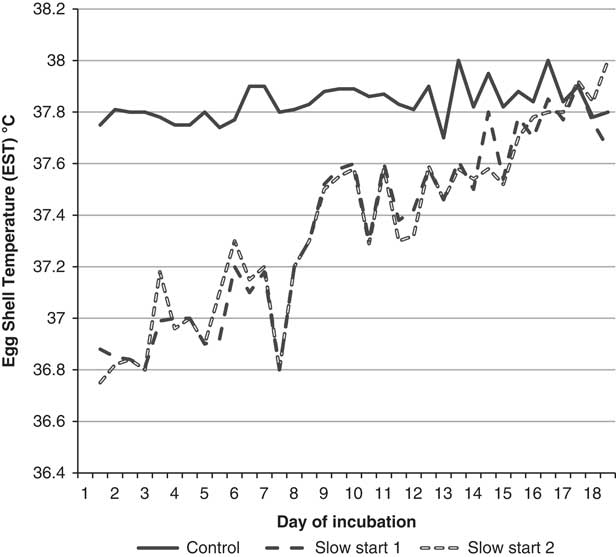
Eggs from Strains 1 and 2 were incubated under two EST incubation profiles. Seventy-two eggs of each breed were held in each incubator. One incubator was allocated to the Control EST treatment, which held the eggs between 37.75°C and 38°C EST from day 0 until day 18 of incubation. To offset the possibility of a lower hatch rate, two incubators were allocated to the Slow start EST treatment, each containing 72 eggs of each strain. These incubators had a lower initial EST, starting at 36.75°C which gradually increased to reach 37.8°C at day 16 (384 h) of incubation. The humidity in all incubators was held between 50% and 60% throughout the setting phase (Muir and Groves, Reference Muir and Groves2018). At 18 days of incubation (432 h) each egg was weighed, to measure per cent egg weight loss during the setting phase and then transferred into an individual cell in a hatching tray. All hatching trays were held in a single incubator which initially ran at 37.4°C air temperature and 65% humidity. Air temperature was then gradually decreased to 36.9°C by day 21 (504 h) of incubation (Muir and Groves, Reference Muir and Groves2018). The hatching trays that were holding eggs from the two strains and incubation profiles were evenly distributed throughout the incubator.
As outlined by Muir and Groves (Reference Muir and Groves2018) each egg was candled at transfer to the hatcher, and non-viable eggs were removed and broken open to determine stage of embryo failure (Hill, Reference Hill2008). Each viable egg was placed into an identified individual cell within the hatching tray. In this way each hatched chick was identifiable and could be traced to its incubation treatment.
Hatching procedures
Hatching trays were observed every 6 h from 468 until 516 h of incubation, to identify the 6 h window during which each chick hatched. Chicks were taken-off from the hatching trays at 516 h (21.5 days) of incubation, identified by a uniquely numbered wing tag and then weighed. At take-off a subset of chicks from both strains arising from each incubator treatment were randomly selected for sample collection. For Slow start incubation a similar number of chicks of each strain were selected for sampling from each incubator. At sampling chicks were managed as previously described by Muir and Groves (Reference Muir and Groves2018). Briefly, each chick was weighed and their chick length was measured (taken from the tip of the beak to the top of the toe nail on the middle toe (Hill, Reference Hill2008)). A sample of blood was collected from the jugular vein and the serum retrieved to measure Ca and P. Each sample chick was then euthanized, their yolk sac removed and weighed and, their gender recorded. Finally, the right femur was collected for BA analysis.
Any eggs that had failed to hatch by take-off were broken open and the stage of embryo failure identified. Final hatchability for each strain and both EST incubation treatments was calculated.
Bird grow-out phase (from hatch until 35 days of age).
Remaining birds were placed in floorpens within three rooms in a controlled environment building. Two rooms (each 12 m2) were evenly divided into four floorpens (each 3 m2), one floorpen being randomly allocated to each of the strain by incubation profile treatments, that is, four treatments per room. As additional chicks had hatched from the Slow start incubation of both strains, the third room housed two floorpens (each 3 m2) one for each strain of bird that had been incubated under the Slow start profile. Chicks arising from the two Slow start incubators were allocated across all floorpens that were housing their respective strain for the Slow start incubation. At day 21 the birds were moved to a controlled environment deep litter shed, where they remained in the same pen groups, but within larger pens (4.5 m2). In both housing facilities new wood shavings covered the floor, water was available through nipple drinkers and feed was initially provided in one scratch tray and one tube feeder/pen, with the scratch tray being replaced with a second tube feeder when the birds were 1-week old. The chicks were fed bagged broiler starter (0.7 kg/bird), grower (1.2 kg/bird) and finisher (3.1 kg/bird) rations (Farmyard Broiler feeds, Weston Feeds, Enfield, NSW, Australia; Groves and Muir, Reference Groves and Muir2017). Individual bird weights, pen feed consumption and feed conversion ratio (FCR) was determined when birds were 7, 14, 28 and 35 days of age.
At 35 days of age the standing ability of all visibly male birds from all treatment groups was assessed in a modified LTL test (Berg and Sanotra, Reference Berg and Sanotra2003; Groves and Muir, Reference Groves and Muir2013). Briefly, individual birds were placed in a tub containing ∼3 cm of tepid (30°C to 33°C) water, and timed for a maximum of 5 min, or until it sat down. The bird was then removed from the tub, humanely euthanized and TD assessed (Groves and Muir, Reference Groves and Muir2017).
Laboratory procedures
Calcium and phosphorus analysis
Calcium and phosphorus concentrations were determined in serum, as described by Muir and Groves (Reference Muir and Groves2018). These assays were conducted by The University of Sydney, Veterinary Teaching Hospital, Camden. Following clotting blood samples were centrifuged at 1455 × g for 10 min at 4°C and the serum retrieved. Total Ca was estimated using the metallochromagen Arsenazo III reagent (Catalogue No. TR29226; Thermo Fisher Scientific Inc., Middletown, VA, USA) which forms a coloured chromophore with Ca ions at pH 6.75, measured at 650 nm. Inorganic P concentration was measured using an inorganic P reagent (direct UV method without reduction) producing unreduced phosphomolybdate and measured at 340 nm (Catalogue No. TR30026, Thermo Fisher Scientific Inc., Middleton, VR, USA). Colourimetric assessments were conducted using a Konelab 20 XTi (Thermo Electron, Waltham, MA, USA) clinical chemistry analyser.
Bone ash
Any remaining soft tissue was removed from the femur. The bone was then weighed, placed in a drying oven at 105°C for 24 h, following which the dry bone weight was recorded. The bone was then placed into a muffle furnace at 200°C and the temperature increased by 100°C increments, with corresponding time pause, until 600°C. After 8 h samples were removed from the furnace, allowed to cool in a dessicator and ash weights were recorded (Muir and Groves, Reference Muir and Groves2018).
Statistical analysis
All statistical analyses were undertaken using the computerized statistics package STATISTICA version 6.1 (StatSoft Inc., Tulsa, OK, USA). Chick weight and the production data were compared using ANOVA, while proportional data (e.g. hatchability) were compared using contingency (χ 2) table analysis. Embryo losses were compared using odds-based parameters for frequency data and Mantel-Haenszel χ 2 analysis.
As the LTL assessment was terminated at 5 min, the actual LTL time for birds still standing at that time could not be measured. Hence LTL results (in seconds) were compared across treatments using Kaplan–Meier Survival Analysis and data for birds remaining standing at 300 s (5 min) were censored. Comparisons between two treatment groups of birds in LTL were made using Gehan’s Wilcoxon test, whereas comparisons between more than two treatment groups were completed using the χ 2 test.
Results
The EST recorded from four eggs in each incubator every minute throughout the setting phase, were averaged for every 12 h period. The resulting EST profile for each incubator until 18 days of incubation, is presented in Figure 1. Note as two incubators were run to the Slow start conditions, records for both incubators are presented. The EST conditions within these two incubators were similar, and both are notably different from the EST of the Control incubator until day 16 of incubation.
Mean egg shell temperature (EST) during chick egg incubation under either Control or Slow Start temperature profile, recorded by temperature sensors attached to eggs, from days 0 to 18 of incubation.

Mean egg weight at the start of incubation (data not shown) was significantly different between the two strains of bird (Strain 1: 62.6 g, Strain 2: 59.8 g, P < 0.0001). However, there were no significant differences in the average percentage egg weight loss during the setting phase (Strain 1: 10.3%, Strain 2:10.7% loss, P = 0.07).
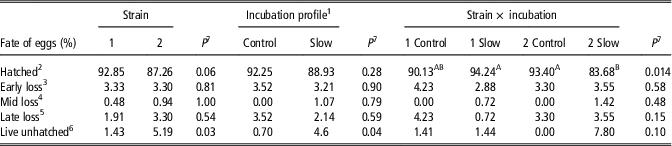
There was no difference in the hatchability of eggs from the same strain of bird in the two Slow start incubators. There was however a significant interaction between Strain and incubation profile on chick hatchability (Table 1). The highest hatchability was observed with Strain1 Slow start and Strain 2 Control incubation chicks (94.24% and 93.40% hatch, respectively), with Strain 2 Slow start demonstrating a significantly lower hatchability of 83.68%. The 90.13% hatchability of Strain 1 Control chicks was not significantly different from the previous three groups (Table 1).
Fate of fertile chicken eggs and the stage at which the chick embryo ceased to be viable in unhatched eggs

1 Control incubation where eggs were incubated at egg shell temperatures (EST) between 37.75°C and 38°C during the setting phase (i.e. from the start of incubation until eggs were transferred to the hatching trays at day 18 of incubation). Slow start incubation where eggs were initially incubated at 36.75°C EST with gradual increase in temperature reaching 37.8°C EST at day 16 of incubation.
2 Percentage of fertile eggs which hatched.
3 Embryonic development limited to membrane or blood ring stages as a percentage of fertile eggs.
4 Embryos lost with a large eye but without feathers and <8 cm length as a percentage of fertile eggs.
5 Feathered embryos lost >8 cm as a percentage of fertile eggs.
6 Chick >17 cm, alive but not hatched.
7 P values for embryo losses (including live unhatched) were determined using odds-based parameters for frequency data and the Mantel-Haenszel technique.
A,B Values for Strain × Incubation within a row with different letter superscripts differ significantly (P < 0.05).
The stage of embryo failure is also presented in Table 1. There were no significant differences in early, mid and late losses. However, the percentage of chicks that were live but unhatched was significantly different with Strain 2 experiencing 5.19% loss of live unhatched chicks, compared to 1.43% in Strain 1. Slow start incubation resulted in a 4.6% loss of live but unhatched chicks, compared to 0.7% with the Control incubation (P = 0.04).
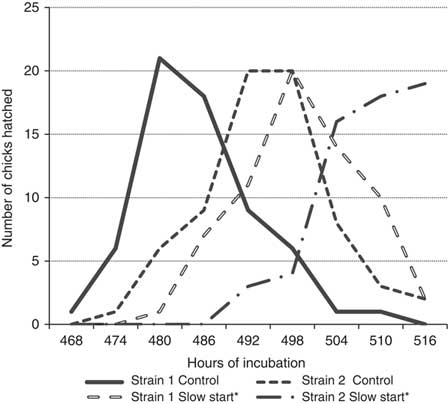
The number of newly hatched chicks at 6-hourly observations from 468 to 516 h incubation, for both Strains and incubation profiles are shown in Figure 2. The mean hatch time of each treatment is presented in Table 2. Overall Strain 1 chicks hatched significantly earlier (mean hatch time 491.7 h), than Strain 2 (500.2 h). The Control incubation also generated a significantly earlier mean hatch time (489.3 h), compared to Slow start (502.7 h). For both Strains the Slow start incubation delayed mean hatch time by more than 13 h compared to their Control incubation. The effect of Slow start on incubation duration and time of hatch was most apparent with the Strain 2 chicks, where the first chicks only hatched between 486 and 492 h incubation, and, the number of newly hatched chicks every 6 h window was still increasing at take-off (Figure 2). A similar proportion of male (49%) and female (51%) chicks hatched from both incubation profiles and bird strains (data not shown).
Distribution of chick hatch times in 6-hourly intervals for Strains 1 and 2 chicks following incubation in the Control and Slow Start 1 incubator. *A similar pattern was observed in Slow start 2 incubator (data not shown).

Mean chick hatch time and chick weight at take-off for all hatched chicks

1 Control incubation where eggs were incubated at egg shell temperatures (EST) between 37.75°C and 38°C during the setting phase (i.e. from the start of incubation until eggs were transferred to the hatching trays at day 18 of incubation). Slow start incubation where eggs were initially incubated at 36.75°C EST with gradual increase in temperature reaching 37.8°C EST at day 16 of incubation.
2 Hours after the start of incubation.
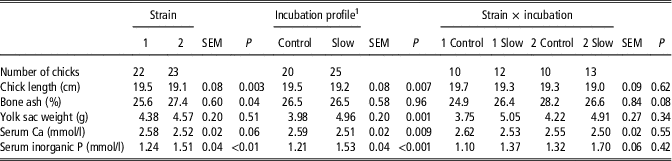
Chick weight at hatch, determined from all hatched chicks (Table 2) was significantly higher in Strain 1 than Strain 2 chicks and, following Slow start compared to the Control incubation. Several other observations were also made on chicks that were euthanized for sampling at take-off (Table 3). Independently, Strain 1 and the Control incubation resulted in significantly longer chicks than the Strain 2 or Slow start incubation, respectively. Bone ash was significantly higher in Strain 2 compared to Strain 1 chicks, but incubation profile had no significant effect on BA. Yolk sac weight was significantly higher following the Slow start compared to the Control incubation, but there was no significant difference in yolk sac weight between the two Strains. There was a strong trend for a higher serum Ca concentration in Strain 1 (P = 0.06) compared to Strain 2 chicks and, a significantly (P = 0.009) higher serum Ca concentration following Control incubation compared to Slow start. Inorganic serum P was significantly higher in Strain 2 compared to Strain 1 chicks and, following Slow start incubation compared to the Control incubation.
Mean chick length, bone ash, yolk sac weight and serum Ca and P at take-off

1 Control incubation where eggs were incubated at egg shell temperatures (EST) between 37.75°C and 38°C during the setting phase (i.e. from the start of incubation until eggs were transferred to the hatching trays at day 18 of incubation). Slow start incubation where eggs were initially incubated at 36.75°C EST with gradual increase in temperature reaching 37.8°C EST at day 16 of incubation.
For the production parameters of bird weight, feed intake (FI) and FCR, significant effects were observed from days 0 to 7 only, which are presented in Table 4 (Production data from days 8 to 35 are not shown). At 7 days of age, independently Strain 1 and chicks from the Control incubation profile achieved the highest mean weight, compared to Strain 2 and Slow start incubated chicks, respectively. Interestingly there were interactions between Strain and incubation profile on FI/bird and FCR. Strain 1 chicks incubated under the Control profile consumed significantly more feed and, had a significantly higher FCR than the other Strain and incubation treatment combinations. The FCR of Strain 2 Control incubated chicks was second highest. Slow start incubation of both Strains resulted in the most efficient FCR between days 0 to 7 and, they were not significantly different to each other.
Mean production parameters for chicken Strains 1 and 2 at 7 days of age

FCR = feed conversion ratio.
1 Control incubation where eggs were incubated at egg shell temperatures (EST) between 37.75°C to 38°C during the setting phase (i.e. from the start of incubation until eggs were transferred to the hatching trays at day 18 of incubation). Slow start incubation where eggs were initially incubated at 36.75°C EST with gradual increase in temperature reaching 37.8°C EST at day 16 of incubation.
A,B,C Values for Strain × Incubation within a row with different letter superscripts differ significantly (P < 0.05).
At 5 weeks of age the median LTL of Strain 1 and 2 birds was not significantly different, however, birds incubated under Slow start conditions had a significantly longer median LTL (161 s) than the Control incubation (106 s) (P = 0.0005; Table 5). Interestingly of the Slow start incubation, Strain 1 birds had a numerically longer median LTL than Strain 2, but they were not significantly different. Following Control incubation, Strain 1 also had the longer median LTL, but this was not significantly different to the LTL of Strain 2 birds following a Control incubation. There was a very low prevalence of TD across all treatments (data not shown).
Latency-to-lie (LTL) of chicken Strains 1 and 2 at 35 days of age following Control and Slow start incubation

1 Control incubation where eggs were incubated at egg shell temperatures (EST) between 37.75°C to 38°C during the setting phase (i.e. from the start of incubation until eggs were transferred to the hatching trays at day 18 of incubation). Slow start incubation where eggs were initially incubated at 36.75°C EST with gradual increase in temperature reaching 37.8°C EST at day 16 of incubation.
2 Number of birds that sat down before the 5 min end point of the LTL test.
3 Number of birds that were standing at the 5 min end point of the LTL test.
A,B Values for Strain × Incubation within a row with different letter superscripts differ significantly (P < 0.05).
Discussion
The outcomes of this study have clearly identified a benefit of lower early incubation EST or Slow start incubation, for the leg strength and standing ability of commercial meat chickens. Many investigations into the effect of incubation temperatures on leg strength in meat chickens have assessed on-going constant or intermittent low or high temperatures throughout incubation (Yalcin and Siegel, Reference Yalcin and Siegel2003; Hammond et al., Reference Hammond, Simbi and Stickland2007; Oviedo-Rondón et al., Reference Oviedo-Rondón, Small, Wineland, Christensen, Mozdziak, Koci, Funderburk, Ort and Mann2008; Willemsen et al., Reference Willemsen, Kamers, Dahlke, Han, Song, Ansari Pirsaraei, Tona, Decuypere and Everaert2010; Shim and Pesti, Reference Shim and Pesti2011; Ipek et al., Reference Ipek, Sahan, Baycan and Sozcu2014). To the best of our knowledge our work, including Groves and Muir (Reference Groves and Muir2014), Groves and Muir (Reference Groves and Muir2017), Muir and Groves (Reference Muir and Groves2018) and the current study are the first investigations into the opportunities for improved leg strength when incubation EST starts at ∼1°C below the recommended 37.8°C temperature and gradually increases from that point reaching 37.8°C EST between 13 and 16 days of incubation. As the buds of the skeletal limbs start to develop from days 5 and 6 E (van der Pol et al., Reference van der Pol, van Roovert-Reijrink, Maatjens, van den Anker, Kemp and van den Brand2014) and bone ossification and growth continues throughout incubation, including rapid rates of bone growth before hatch (Shim and Pesti, Reference Shim and Pesti2011), it follows that incubation temperature throughout the entire incubation period can influence bone development, growth and strength. With repeated observations of the benefits of Slow start incubation to the leg strength in meat chickens, the exact mechanisms by which this incubation profile improves leg strength, including when the chickens are 5 to 6 weeks old, needs to be fully elucidated.
In the present study Slow start incubation significantly increased the standing time of both commercial strains of meat chicken in the LTL test by at least 55 s. This improvement is similar to that achieved in a fast feathering parent line (Groves and Muir, Reference Groves and Muir2014) which formed the basis for a Slow start incubation to improve leg strength in meat chickens.
With a constant low or high EST van der Pol et al. (Reference van der Pol, van Roovert-Reijrink, Maatjens, van den Anker, Kemp and van den Brand2014) did not find any differences in BA at hatch. In the current study BA at hatch was also not significantly altered by incubation conditions, and especially not increased with the Slow start incubation, which is at odds with that observed with the fast feathering dam line (Groves and Muir, Reference Groves and Muir2014) and Cobb 500 chicks (Muir and Groves, Reference Muir and Groves2018). The exact reason for this difference between studies is not apparent. However, the initial low incubation temperatures in the Slow start programs used by Groves and Muir (Reference Groves and Muir2014), Muir and Groves (Reference Muir and Groves2018) and, the present study did differ, such that the EST at each stage of embryonic development may have been slightly different (van der Pol et al., Reference van der Pol, van Roovert-Reijrink, Maatjens, van den Anker, Kemp and van den Brand2014) and, in conjunction with chick strain, could have impacted BA at hatch. In addition, in this study serum inorganic P was significantly higher in the Slow start chicks at hatch, whereas when Slow start increased BA at hatch (Muir and Groves, Reference Muir and Groves2018) serum P was significantly lower in Slow start than Control incubated chicks. Further, in the fast feathering parent line (Groves and Muir, Reference Groves and Muir2014) BA was positively correlated with LTL, but that was not observed in the current study. It may be that in commercial strains of meat chickens BA at hatch cannot be used as a predictor of later leg strength.
As different strains of meat chickens have different embryonic growth trajectories (Tona et al., Reference Tona, Onagbesan, Kamers, Everaert, Bruggeman and Decuypere2010), it is not surprising that the two Strains in this study presented different hatch window characteristics under both incubation profiles. Strain 1 Control incubated chicks hatched an average 8.5 h earlier than Strain 2 Control incubated chicks. The Slow start incubation delayed mean hatch time by between 13 and 14 h for both strains, but, based on the fate of fertile eggs was a consequence of the Slow start incubation impacting the two strains differently. Slow start incubation of Strain 1 increased percent hatchability, with fewer early and late losses of embryos compared to their Control incubation. In contrast Strain 2 Slow start incubation reduced hatchability with a marked increase in the number of live unhatched chicks. Other studies have also reported extended incubation period, later hatch time and increased embryo deaths in the later stages of incubation with lower incubation temperatures (Ipek et al., Reference Ipek, Sahan, Baycan and Sozcu2014; van der Pol et al., Reference van der Pol, van Roovert-Reijrink, Maatjens, van den Anker, Kemp and van den Brand2014). Strain associated differences in embryonic development, hatch time and weight at hatch have also been reported (Suarez et al.,Reference Suarez, Wilson, McPherson, Mather and Wilcox1996; Suarez et al., Reference Suarez, Wilson, Mather, Wilcox and McPherson1997; Tona et al., Reference Tona, Onagbesan, Kamers, Everaert, Bruggeman and Decuypere2010; Nangsuay et al., Reference Nangsuay, Meijerhof, van den Anker, Heetkamp, Kemp and van den Brand2015). Tona et al. (Reference Tona, Onagbesan, Kamers, Everaert, Bruggeman and Decuypere2010) noted faster embryonic development of Ross 308 compared to Cobb 500 embryos during the 2nd week of incubation, with differences not only in incubation duration but also in the metabolism of nutrients (Nangsuay et al., Reference Nangsuay, Meijerhof, van den Anker, Heetkamp, Kemp and van den Brand2015). Ross 308 eggs had higher energy levels than Cobb 500 eggs and, following incubation at 37.8°C EST, the chicks hatched ∼4 h later than Cobb 500 and used more energy throughout their longer incubation. Nangsuay et al. (Reference Nangsuay, Meijerhof, van den Anker, Heetkamp, Kemp and van den Brand2015) proposed that the higher glycogen store of Cobb embryos allowed for their shorter incubation period and earlier hatch time. In the present study the longer incubation period of Slow start incubated Strain 2 embryos may have depleted their energy stores to such a level that they were unable to hatch by 516 h of incubation and hence the higher incidence of live but unhatched chicks.
Later hatching chicks from the Slow start incubation had higher mean chick weight and heavier residual yolk sacs at take-off. Similar observations have been reported in association with cooler incubation temperatures and later hatching chicks (Groves and Muir, Reference Groves and Muir2017), but these are not consistent findings (van der Pol et al., Reference van der Pol, van Roovert-Reijrink, Maatjens, van den Anker, Kemp and van den Brand2014). The processes involved in the chick’s utilization of nutrients held in the residual yolk sac has not been clearly elucidated and is worthy of further investigation. Interestingly, in contrast to Lourens et al. (Reference Lourens, van den Brand, Heetkamp, Meijerhof and Kemp2007) and van der Pol et al. (Reference van der Pol, van Roovert-Reijrink, Maatjens, van den Anker, Kemp and van den Brand2014), in this study the earlier hatching chicks were significantly longer than the later hatching chicks at take-off (516 h of incubation), a characteristic we have also observed in previous studies (Groves and Muir, Reference Groves and Muir2017; Muir and Groves, Reference Muir and Groves2018). As earlier hatching chicks have lighter yolk sacs than their later hatching counterparts, it is assumed that they draw on nutrients from the yolk sac to grow in length during their sojourn, resulting in their lighter BW at take-off. However, this means that a longer chick at take-off at 516 h incubation may not necessarily be a sign of better chick quality (Meijerhof, Reference Meijerhof2009; Ipek et al., Reference Ipek, Sahan, Baycan and Sozcu2014) but a reflection of how early the chick emerged from the egg.
Strain 1 Control incubated chicks which had an earlier average hatch time than other Strain by incubation profile chicks, consumed significantly more feed, gained more weight but had a significantly poorer FCR during the 1st week post-hatch. This corresponds with our previous observation of higher Day 7 BWs in earlier hatching chicks (Groves and Muir, Reference Groves and Muir2017). The longer sojourn and lighter yolk sac weights at take-off of earlier hatching chicks may generate a greater appetite and therefore higher FI and weight gain once food is available to them. In both cases the increased weight gain was only observed during the early post hatch period, following which production parameters were not significantly different. Early hatch and rapid early growth has been associated with TD in Cobb 500 chicks (Groves and Muir, Reference Groves and Muir2017), but TD was not observed with sufficient prevalence for further analysis in this study.
Following evaluation of a constant very high, high, control or low EST for improvements in bone development of Ross 308 chicks at hatch, van der Pol et al. (Reference van der Pol, van Roovert-Reijrink, Maatjens, van den Anker, Kemp and van den Brand2014) concluded that it was not possible to recommend one specific constant EST throughout fertile egg incubation to achieve improved leg strength. In conjunction with our previously reported experiments (Groves and Muir, Reference Groves and Muir2014; Muir and Groves, Reference Muir and Groves2018), this study has added to the evidence that Slow start incubation significantly improves leg strength in meat type chickens. However, the ideal starting EST needs to be assessed for each Strain of bird, to avoid the potentially detrimental impact of a lower EST on the developing embryo as seen in this study with Strain 2. It should also be noted that the effect of limited oxygen concentration during the final week or plateau phase of incubation, can negatively impact embryo metabolism and development more than EST (Lourens et al., Reference Lourens, van den Brand, Heetkamp, Meijerhof and Kemp2007). As oxygen concentration was not measured in this study, its effect on the embryo during Slow start incubation is currently unknown.
In conclusion Slow start incubation, that is, starting incubation ∼1°C cooler than the recommended 37.8°C, and then gradually stepping up the EST to reach 37.8°C at 16 days of incubation, will improve the standing ability of meat chickens. This was a constant observation across the two strains of meat chicken used in this study and, concurs with previous exploration of this incubation profile with a fast feathering parent line. The exact starting temperature needs to be evaluated for each strain, to avoid the incidence of live unhatched chickens as observed in Strain 2 in this study. Slow start incubation offers a practical approach to improving the leg strength of meat chickens.
Acknowledgements
This research was financially supported by Agricultures Australia, Chicken Meat. The authors thank Joy Gill and Melinda Hayter of the Poultry Research Foundation, The University of Sydney, Camden, Australia, for assistance with bird husbandry and laboratory procedures.
Declaration of interest
None of the authors has a conflict of interest with regards to the contents of this manuscript.
Ethics statement
The described experimental procedures were approved by the University of Sydney Animal Ethics Committee (protocol number: N00/6-2013/2/6006). All procedures complied with the Australian Code of Practice for the Care and Use of Animals or Scientific Purposes, as prepared by the National Health and Medical Research Council, 1997.
Software and data repository resources
None of the data were deposited in an official repository.