


Introduction
Worldwide, increasing rates of poor mental well-being among children and young people constitute a major public health challenge [Reference McGorry, Mei, Dalal, Alvarez-Jiminez, Blakemore and Browne1]. Mental disorders are a substantial cause of premature death and are the largest cause of disability, associated with major human and economic consequences [Reference McGorry, Mei, Dalal, Alvarez-Jiminez, Blakemore and Browne1–Reference Patton, Sawyer, Santelli, Ross, Afifi and Allen3]. To address this development and reduce the need for more intensive interventions by the healthcare and social sectors, there is a need for preventive and mental health-promoting initiatives [Reference McGorry, Mei, Dalal, Alvarez-Jiminez, Blakemore and Browne1, Reference Arango, Diaz-Caneja, McGorry, Rapoport, Sommer and Vorstman4].
headspace is a preventive and mental health-promoting service for young people, with locally adapted models in 15 countries [5]. headspace Denmark was established by the nongovernmental organization The Social Network in 2013 [5]. headspace Denmark provides free and anonymous counseling services for young people aged 12–25 years experiencing challenges related to their mental well-being. If additional support is needed beyond headspace’s counseling services, they will be referred to other relevant services, for example, the healthcare sector or civil society organizations, also known as bridging [5].
In 2019, an evaluation of headspace Denmark was conducted [Reference Rickwood, McEachran, Saw, Telford, Trethowan and McGorry6]. The results showed a high level of satisfaction among users and indicated that the intervention had a positive impact on young people’s well-being and life satisfaction. However, a key limitation was the lack of a control group for comparison. Therefore, the present evaluation of headspace Denmark was launched in 2022 to address these methodological challenges and strengthen the evidence base for interventions aimed at improving young people’s mental health and well-being. The evaluation comprises three studies: an effectiveness evaluation, a process evaluation, and a cost-effectiveness evaluation [7]. This paper presents the results from the 6-month effectiveness evaluation. The aim of this study is to examine the effectiveness of the Danish headspace intervention on young people’s well-being, loneliness, self-efficacy, life satisfaction, and health-related quality of life.
Methods
Study design
The methodology is described in detail in the study protocol [7] and the statistical analysis plan (Open Science Framework: https://doi.org/10.17605/OSF.IO/9KZFD). The study employed a quasi-experimental design, where the intervention group was matched to a comparable control group, using propensity score matching.
Setting
Participants were recruited from 30 headspace centers, distributed throughout all regions of Denmark.
Eligibility criteria
The inclusion criteria for the intervention group were young people aged 12–25 years who had participated in at least one counseling session in a headspace center.
Intervention and comparator
The intervention group was matched to a comparable control group, that is, young people living in municipalities without a headspace center, using propensity score matching. Each young person in the intervention group was matched to six nonexposed controls, based on several background characteristics obtained from the Danish national registries, serving as prognostic proxy measures for potential contact with headspace. The specific details of the propensity score matching procedure can be found elsewhere [7], and the complete list of the matching variables is shown in Supplementary Material 1.
Sample size calculation
A conservative estimate suggested that 1,900 participants (400 in the intervention group and 1,500 in the control group) would provide a statistical power of 90% to detect a standardized mean difference (SMD) of 0.18 in an unpaired two-sided t-test. To account for dropout in survey responses at both baseline and 6-month follow-up, the desired sample size was set at 1,500 in the intervention group and 10,000 in the control group.
Data collection and outcomes
Both the intervention and control groups were asked to complete a questionnaire at baseline and at 6-month follow-up. Five outcome measures were included: well-being, loneliness, self-efficacy, life satisfaction, and health-related quality of life. These were measured using the following validated psychometric scales: WHO-5 [Reference Bjørkedal, Christensen, Poulsen, Ranning, Thorup and Nordentoft8], Three-Item Loneliness Scale [Reference Topp, Østergaard, Søndergaard and Bech9], General Self-Efficacy Scale [Reference Hughes, Waite, Hawkley and Cacioppo10], Cantril’s Ladder [Reference Scholz, Doña, Sud and Schwarzer11], and EQ-5D-5L [Reference Levin and Currie12, Reference Jensen, Sørensen, Gudex, Jensen, Pedersen and Ehlers13]. A detailed description of the scales can be found elsewhere [7]. No hierarchical testing or other control of multiple testing was applied since all five outcome measures covered different hypothesized effects of the intervention and no outcome measure has yet been singled out in past studies with any conviction.
Statistical analyses
Baseline characteristics were presented for the intervention and control groups. For categorical variables, counts (n) and percentages (%) were reported, and for numerical variables, means and standard deviations (SDs) were reported. Differences between the two groups were tested using Wilcoxon’s nonparametric test for numerical data and the Chi-square (χ 2) test for categorical data.
Representativeness and dropout analysis
The headspace users participating in the study were compared to the general headspace user population to assess whether they were representative in terms of age, sex, and region.
A dropout analysis was conducted to assess differences in dropout between those who completed the baseline questionnaire and those who completed the follow-up questionnaire. This was analyzed using logistic multiple regression, where key background factors were tested for associations with dropout. Associations with dropout were reported using odds ratios (ORs) and p-values.
Repeated propensity score matching
After collecting all baseline data, the matching procedure was repeated for the entire pool of individuals in the intervention and control groups at a 1:1 ratio to ensure optimal balance across all matching parameters, including both the original proxy variables and the five outcome measures at baseline.
Effectiveness analysis
Mean differences from baseline to 6-month follow-up were reported for both the intervention and control groups for the five outcome measures. For continuous outcomes, linear regression was performed to test differences between the two groups, adjusting for baseline values of the given outcome variable. Additionally, a predefined subgroup analysis stratified by age was conducted, with separate models for participants <18 years and those ≥18 years. Further post hoc subgroup analyses were performed, stratified by sex assigned at birth and level of well-being at baseline, defined as WHO-5 < 50 versus WHO-5 ≥ 50 [Reference Bjørkedal, Christensen, Poulsen, Ranning, Thorup and Nordentoft8].
Effect sizes were reported as standardized effect sizes using Cohen’s D. According to Cohen’s original guidelines [Reference Jensen, Jensen, Gudex, Pedersen, Sørensen and Ehlers14], effect sizes of 0.2, 0.5, and 0.8 are interpreted as small, medium, and large, respectively. However, this study adopted lower thresholds of 0.1, 0.2, and 0.3 for small, medium, and large effects, respectively [Reference Cohen15], since preventive and health-promoting interventions typically yield smaller effect sizes than clinically relevant effect sizes (MCID: Minimal Clinically Important Difference), due to their low intensity and broad target population. Therefore, it is recommended to assess the expected Minimum Relevant Effect Size and adjust the thresholds accordingly [Reference Jensen, Jensen, Gudex, Pedersen, Sørensen and Ehlers14, Reference Richard, Bond and Stokes-Zoota16].
Missing data
Missing data were handled using multiple imputations. The multiple imputation approach was based on a comprehensive imputation model that included key baseline parameters from the registries along with baseline measurements of the five outcome variables.
Sensitivity analyses
To examine the robustness of the results to the various analytical choices, two sensitivity analyses were conducted. One excluded multiple imputations and was based solely on the 1:1 matching. The other excluded the 1:1 matching and was based solely on multiple imputations.
Population attributable fraction
Post-hoc, an estimation of Population Attributable Fractions (PAFs) [Reference Richard, Bond and Stokes-Zoota16] was deemed relevant to describe the effect at the population level. PAF is an epidemiological measure used to estimate the proportion of the negative outcome in the entire population that could be prevented by the intervention. To estimate PAF, it was assumed that at any given time, ~30% of individuals aged 12–25 years experience poor well-being [Reference Matthay, Hagan, Gottlieb, Tan, Vlahov and Adler17, Reference Würtzen, Clausen, Andersen, Santini, Erkmen and Pedersen18] and that 70% of the headspace user group experiences poor well-being (WHO-5 score < 50 at baseline [Reference Bjørkedal, Christensen, Poulsen, Ranning, Thorup and Nordentoft8]). Four scenarios for headspace coverage were considered: (A) headspace targets a high-risk group where 70% experience poor well-being: (1) headspace reaches 20% of this target group, or (2) headspace reaches 80% of this target group. (B) A hypothetical scenario where headspace is widely available to all 12- to 25-year-olds: (3) headspace reaches 1% of this broader population, or (4) headspace reaches 10% of this broader population.
Results
Included and excluded participants
The inclusion period was 14.5 months from September 2022, and follow-up data were collected until mid-August 2024.
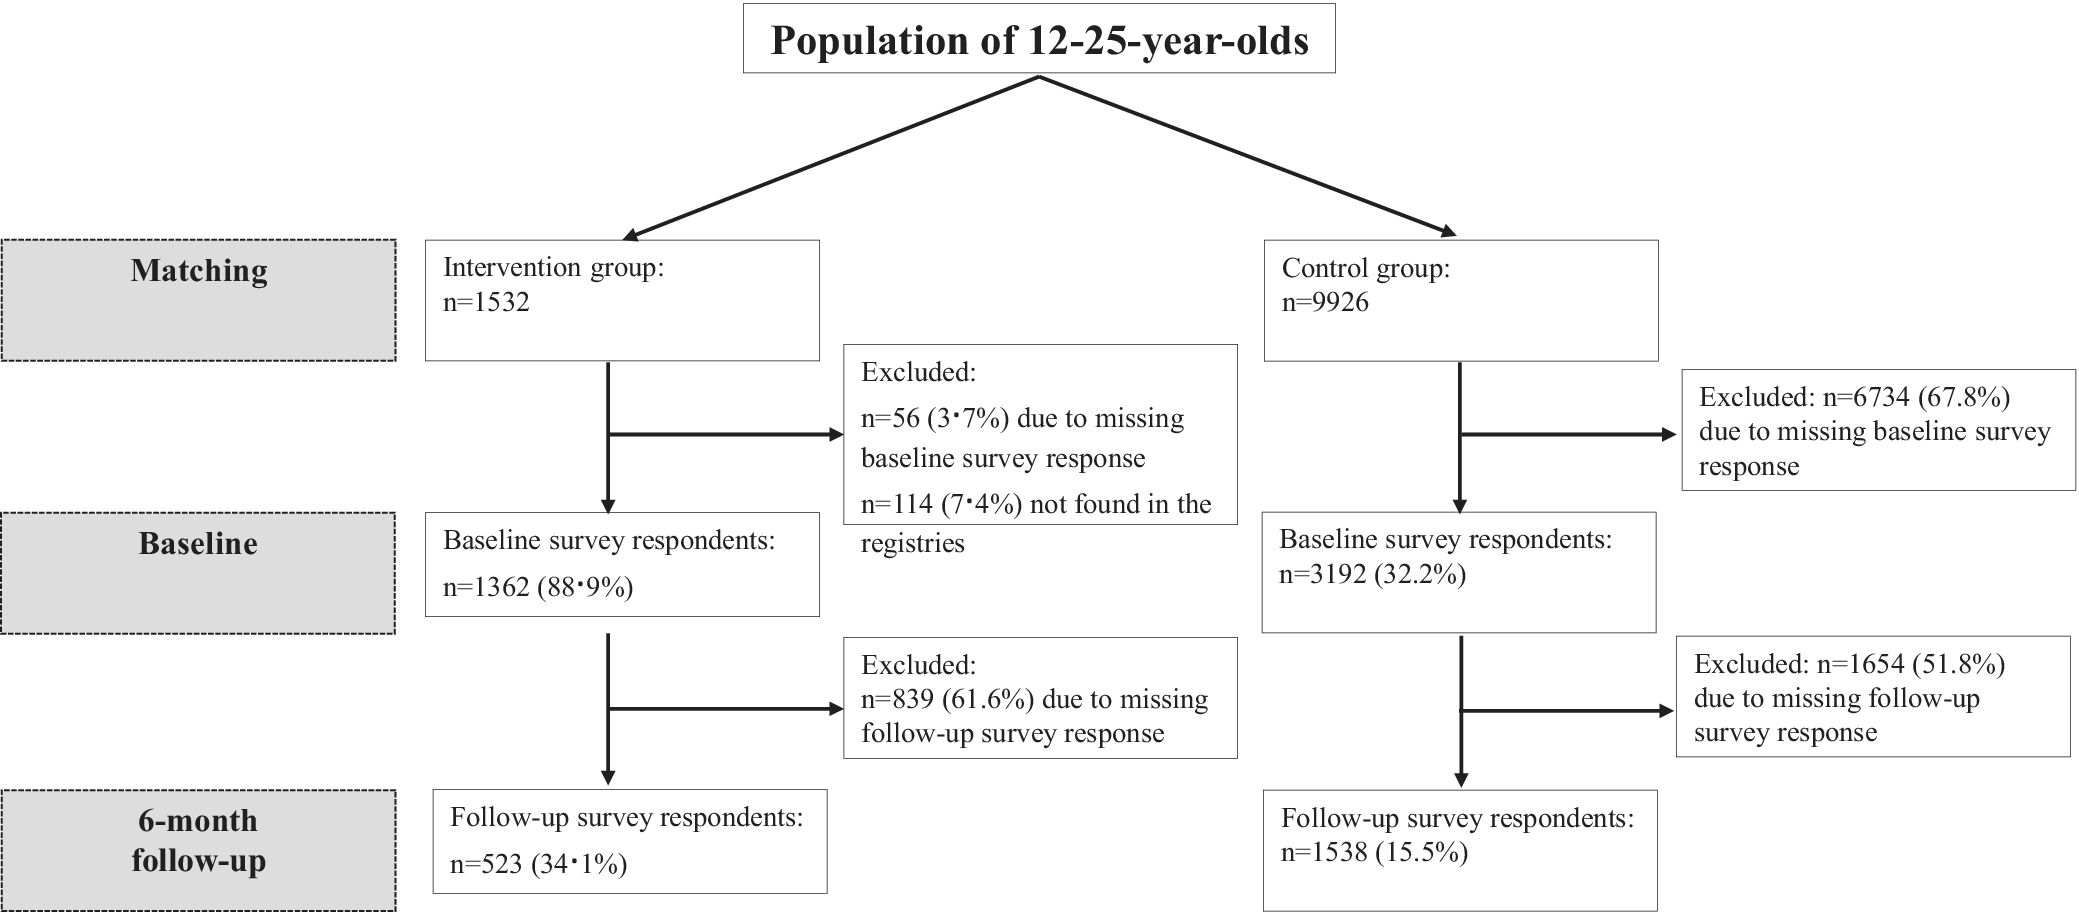
Figure 1 presents a flowchart of inclusion and exclusion of participants in the intervention and control group, respectively. A total of 1,532 headspace users were included in the intervention group. Of these, 56 (3.7%) did not complete the baseline survey, and 114 (7.4%) could not be identified in the national registries. Thus, the final number of participants in the intervention group was 1,362 (88.9%). In the control group, the baseline questionnaire was sent to 9,926 individuals aged 12–25 years, of whom 32.2% (n = 3,192) responded. At 6-month follow-up, 15.5% (n = 1,538) of the total control group completed the survey, compared to 34.1% (n = 523) in the intervention group.
Flowchart of inclusion and exclusion in the intervention and control groups.

Figure 1. Long description
The flowchart begins at the top with a single box labeled Population of 12-25-year-olds. This splits into two main columns. On the left is the Intervention group and on the right is the Control group.
Phase 1: Matching.
- Intervention group starts with n=1532.
- Control group starts with n=9926.
Phase 2: Baseline.
- From the Intervention group, 56 (3.7%) were excluded due to missing baseline survey response and 114 (7.4%) were not found in the registries. This leaves 1362 (88.9%) Baseline survey respondents.
- From the Control group, 6734 (67.8%) were excluded due to missing baseline survey response. This leaves 3192 (32.2%) Baseline survey respondents.
Phase 3: 6-month follow-up.
- From the Intervention baseline respondents, 839 (61.6%) were excluded due to missing follow-up survey response. This leaves 523 (34.1%) Follow-up survey respondents.
- From the Control baseline respondents, 1654 (51.8%) were excluded due to missing follow-up survey response. This leaves 1538 (15.5%) Follow-up survey respondents.
Baseline characteristics
Table 1 presents the baseline characteristics of the intervention and control group, respectively. Since the two groups were pre-matched, the values align accordingly. In the intervention group, the majority of participants were women (n = 1,069; 75.4%), with an average age of 18.8 years, and ~7% (n = 102) had a non-Danish ethnic background. In the intervention group, 14.0% (n = 198) had received outpatient psychiatric treatment, and 3.5% (n = 49) had been hospitalized in a psychiatric ward within the past 5 years.
Baseline characteristics

Table 1. Long description
The table is structured with five columns: Variables, Intervention group (n = 1,532), Control group (n = 9,926), p-value, and Total matching pool (n = 67,871).
Key demographic and categorical data (n and percentage):
- Sex: Females represent approximately 75 percent of both groups (p = 0.895).
- Ethnicity: Danish ethnicity is dominant at approximately 93 percent in both groups (p = 0.674).
- Family type: Households with two parents account for 64 percent in both groups (p = 0.769).
- Educational level: The majority in both groups have primary and lower secondary school education (65.3 percent intervention vs 66.4 percent control).
- Response at baseline: Significantly higher in the intervention group (96.3 percent) compared to the control group (32.2 percent, p < 0.001).
Key continuous data (mean and standard deviation):
- Age: Mean age is 18.78 for intervention and 18.72 for control (p = 0.509).
- School absenteeism: 0.81 days for intervention and 0.83 days for control (p = 0.881).
- Parents’ income: Log values are 12.47 for intervention and 12.43 for control (p = 0.152).
Outcome measures (psychometric scales) showing significant differences (all p < 0.001):
- W H O 5: 42.10 (intervention) vs 51.52 (control).
- Three Item Loneliness Scale: 6.23 (intervention) vs 5.45 (control).
- General Self Efficacy Scale: 24.57 (intervention) vs 27.89 (control).
- Cantril’s Ladder: 5.00 (intervention) vs 6.20 (control).
- E Q 5 D 5 L: 9.96 (intervention) vs 8.40 (control).
a The total matching pool is reported after the initial raw matching, based on the following variables: sex, age, ethnicity, and household type.
b Parents’ income is reported as log (average annual income). This can be converted to the taxable income, that is, after employment deduction, transport deduction, and labor market contribution. For the intervention group’s parents, the average value of 12.47 corresponds to DKK 260,407, and for the controls group’s parents, the average value of 12.43 corresponds to DKK 250,196.
The average well-being score (WHO-5) in the intervention group was 42.10 (SD = 19.93), which is interpreted as a “risk of depression or stress-related illnesses.” The average loneliness score (Three-Item Loneliness Scale) of 6.23 (SD = 1.85) indicated a high degree of loneliness, while the average self-efficacy score (General Self-Efficacy Scale) of 24.57 (SD = 5.48) indicated a moderate level of self-efficacy. The average life satisfaction score (Cantril’s Ladder) was 5.0 (SD = 2.48), which is interpreted as “low life satisfaction.” The average score for health-related quality of life (EQ-5D-5L) was 9.96 (SD = 3.24) on the sum score. Converted to Danish utility norm values, the intervention group scored 0.65 at baseline, which is markedly lower (~2.5 × SD) than the health-related quality of life of the general population of 18- to 29-year-olds in Denmark (norm 0.93).
Representativeness
Compared to the general population of Danish 12- to 25-year-olds, the intervention group had a higher proportion of women, a lower proportion of individuals with a non-Danish ethnic background, and a higher proportion from single-parent households (based on pre-matching data, not shown). After the initial matching, headspace users were more likely to have attended upper secondary education, and their parents had higher levels of education. They had more psychiatric contacts, and in the national school well-being surveys, they scored below the national average; however, they performed better in the national school tests in language and mathematics compared to the background population.
The headspace users included in the intervention group were also compared to the general headspace user population (shown in Supplementary Material 2) to assess their representativeness. The comparison showed that their sex assigned at birth and age distribution matched, and geographically, they were representatively distributed across the five regions.
Repeated propensity score matching
There was a significant difference in the five outcome measures at baseline between the intervention and control groups, which was unexpected, due to the matching. The intervention group exhibited “poorer” baseline scores on all five outcomes compared to the controls. To ensure optimal balance, the matching procedure was repeated at a 1:1 ratio. The results of this matching, shown in Supplementary Material 3, confirm that this approach created two identical and thus comparable groups. However, due to the 1:1 matching, 66 individuals from the intervention group were excluded, as they lacked complete data on the five baseline outcome variables.
Dropout analysis
The two dropout analyses are shown in Table 2. At baseline, the intervention group was significantly more likely to respond to the survey compared to the control group (OR = 73.2; p < 0.001). Lower response rates were observed for males (OR = 0.71; p < 0.001), individuals with high school absenteeism (OR = 0.94; p = 0.007), and those with lower school well-being (OR = 0.94; p = 0.032). At follow-up, the intervention group was less likely to respond (OR = 0.53; p < 0.001). There was no significant association between the five baseline outcome measures and the odds of completing the follow-up questionnaire.
Dropout analyses

Table 2. Long description
The table is organized into five columns: Variables, Baseline O R, Baseline p-value, Follow-up O R, and Follow-up p-value.
* Cases: The intervention group shows a high O R of 73.23 at baseline (p < 0.001) and 0.53 at follow-up (p < 0.001) compared to the control group (1.00).
* Sex: Males have an O R of 0.71 at baseline (p < 0.001) and 0.84 at follow-up (p = 0.027) compared to females (1.00).
* Age: O R is 1.03 at baseline (p = 0.003) and 1.05 at follow-up (p = 0.005).
* Educational level: Compared to no education (1.00), primary and lower secondary school shows 0.94 at baseline and 1.28 at follow-up.
* Mental healthcare utilization: Minimum 1 psychiatric emergency contact within the last 5 years shows 1.29 at baseline (p = 0.002) and 0.96 at follow-up.
* Family type: Compared to two parents (1.00), single father households show 1.05 at baseline and 0.90 at follow-up; single mother households show 0.93 at baseline and 1.07 at follow-up.
* School absenteeism: O R is 0.94 at baseline (p = 0.007) and 0.99 at follow-up.
* Parents’ educational level: Compared to primary/lower secondary (1.00), Master’s degree shows 1.18 at baseline (p = 0.010) and 1.18 at follow-up (p = 0.086).
* National school test results: Danish language reading shows 1.11 at baseline (p = 0.001) and 1.07 at follow-up. Math statistics shows 1.08 at baseline (p = 0.012) and 1.09 at follow-up (p = 0.040).
* National school well-being survey: Social well-being shows 0.94 at baseline (p = 0.032) and 0.97 at follow-up.
* Outcome measures (psychometric scales): Only follow-up data is provided. W H O 5 is 1.00, Three Item Loneliness Scale is 1.04, General Self Efficacy Scale is 1.00, Cantril’s Ladder is 0.98, and E Q 5 D 5 L is 1.01.
Note: (+/−) indicates the sign of significant interactions with the intervention group (vs. the control group).
a The differences between those who completed the baseline questionnaire and all individuals who received it.
b The differences between those who completed the 6-month follow-up questionnaire and those who completed the baseline questionnaire.
Effectiveness analysis
In total, 50.5% (n = 247) of the individuals in the intervention group and 31.3% (n = 481) in the control group experienced an improvement in well-being, estimated as the Minimum Clinically Relevant Difference, defined as a 10-point increase on the WHO-5 scale based on observed data. When estimated as the Minimum Significantly Relevant Difference, defined as an improvement >3 SDs, 57.7% (n = 282) of the individuals in the intervention group and 40.0% (n = 615) of the control group indicated improved well-being.
Table 3 presents the results of the effectiveness analysis. The final model showed a statistically significant effect (Cohen’s D = 0.11; p = 0.018) of the intervention on participants’ well-being at 6-month follow-up, that is, well-being improved more in the intervention group than in the control group. The increase in scores between baseline and follow-up was larger in the intervention group than in the control group (8.4 vs. 6.2 points), with a model-estimated difference of 2.18 points (95% CI: 0.39; 3.97).
Effectiveness analysis

Table 3. Long description
The table is divided into two main sections: Linear regression – observed data and Linear regression – final model. Both sections use the same columns: Variables, Time, Intervention group, Control group, Estimate, 95% C I, p-value, S E, and Cohen’s D.
In the Observed Data section:
* W H O – 5: Intervention group rose from 42.10 to 51.62; Control group rose from 51.52 to 53.77. Estimate 3.132, p < 0.001, Cohen’s D 0.16.
* Three Item Loneliness: Intervention group fell from 6.23 to 5.68; Control group fell from 5.45 to 5.34. Estimate -0.11, p 0.149, Cohen’s D -0.06.
* General Self Efficacy: Intervention group rose from 24.57 to 26.65; Control group rose from 27.89 to 28.32. Estimate 0.662, p 0.005, Cohen’s D 0.12.
* Cantril’s Ladder: Intervention group rose from 5.00 to 5.89; Control group rose from 6.20 to 6.37. Estimate 0.209, p 0.014, Cohen’s D 0.08.
* E Q – 5 D – 5 L: Intervention group fell from 9.96 to 8.91; Control group fell from 8.40 to 8.23. Estimate -0.366, p 0.003, Cohen’s D -0.11.
* E Q – 5 D – 5 L utility: Intervention group rose from 0.65 to 0.73; Control group rose from 0.76 to 0.78. Estimate 0.025, p 0.015, Cohen’s D 0.09.
In the Final Model section:
* W H O – 5: Intervention group rose from 42.13 to 50.55; Control group rose from 42.15 to 48.37. Estimate 2.179, p 0.018, Cohen’s D 0.11.
* Three Item Loneliness: Intervention group fell from 6.20 to 5.68; Control group fell from 6.23 to 5.81. Estimate -0.12, p 0.175, Cohen’s D -0.06.
* General Self Efficacy: Intervention group rose from 24.60 to 26.64; Control group rose from 24.64 to 26.09. Estimate 0.563, p 0.070, Cohen’s D 0.10.
* Cantril’s Ladder: Intervention group rose from 5.01 to 5.88; Control group rose from 5.11 to 5.75. Estimate 0.138, p 0.142, Cohen’s D 0.05.
* E Q – 5 D – 5 L: Intervention group fell from 9.97 to 8.85; Control group fell from 9.92 to 9.04. Estimate -0.203, p 0.174, Cohen’s D -0.06.
* E Q – 5 D – 5 L utility: Intervention group rose from 0.65 to 0.75; Control group rose from 0.64 to 0.73. Estimate 0.019, p 0.116, Cohen’s D 0.07.
a Observed model is based on data before the repeated (1:1) matching and multiple imputations. Final model is based on data after the 1:1 matching and with multiple imputations.
b For WHO-5, a positive improvement in well-being is reflected by an increase in the total score.
c For Three-Item Loneliness Scale, a positive improvement in feelings of loneliness is reflected by a decrease in the total score.
d For General Self-Efficacy Scale, a positive improvement in self-efficacy is reflected by an increase in the total score.
e For Cantril’s Ladder, a positive improvement in life satisfaction is reflected by an increase in the total score.
f For EQ-5D-5L, a positive improvement in health-related quality of life is reflected by a decrease in the total score.
Furthermore, the effect size for the intervention’s effect on participants’ self-efficacy was 0.10, though not statistically significant (p = 0.070). From baseline to follow-up, self-efficacy increased in both groups, but the increase was greater in the intervention group than in the control group (2.0 vs. 1.5 points), with a model-estimated difference of 0.56 (95% CI: −0.04; 1.17).
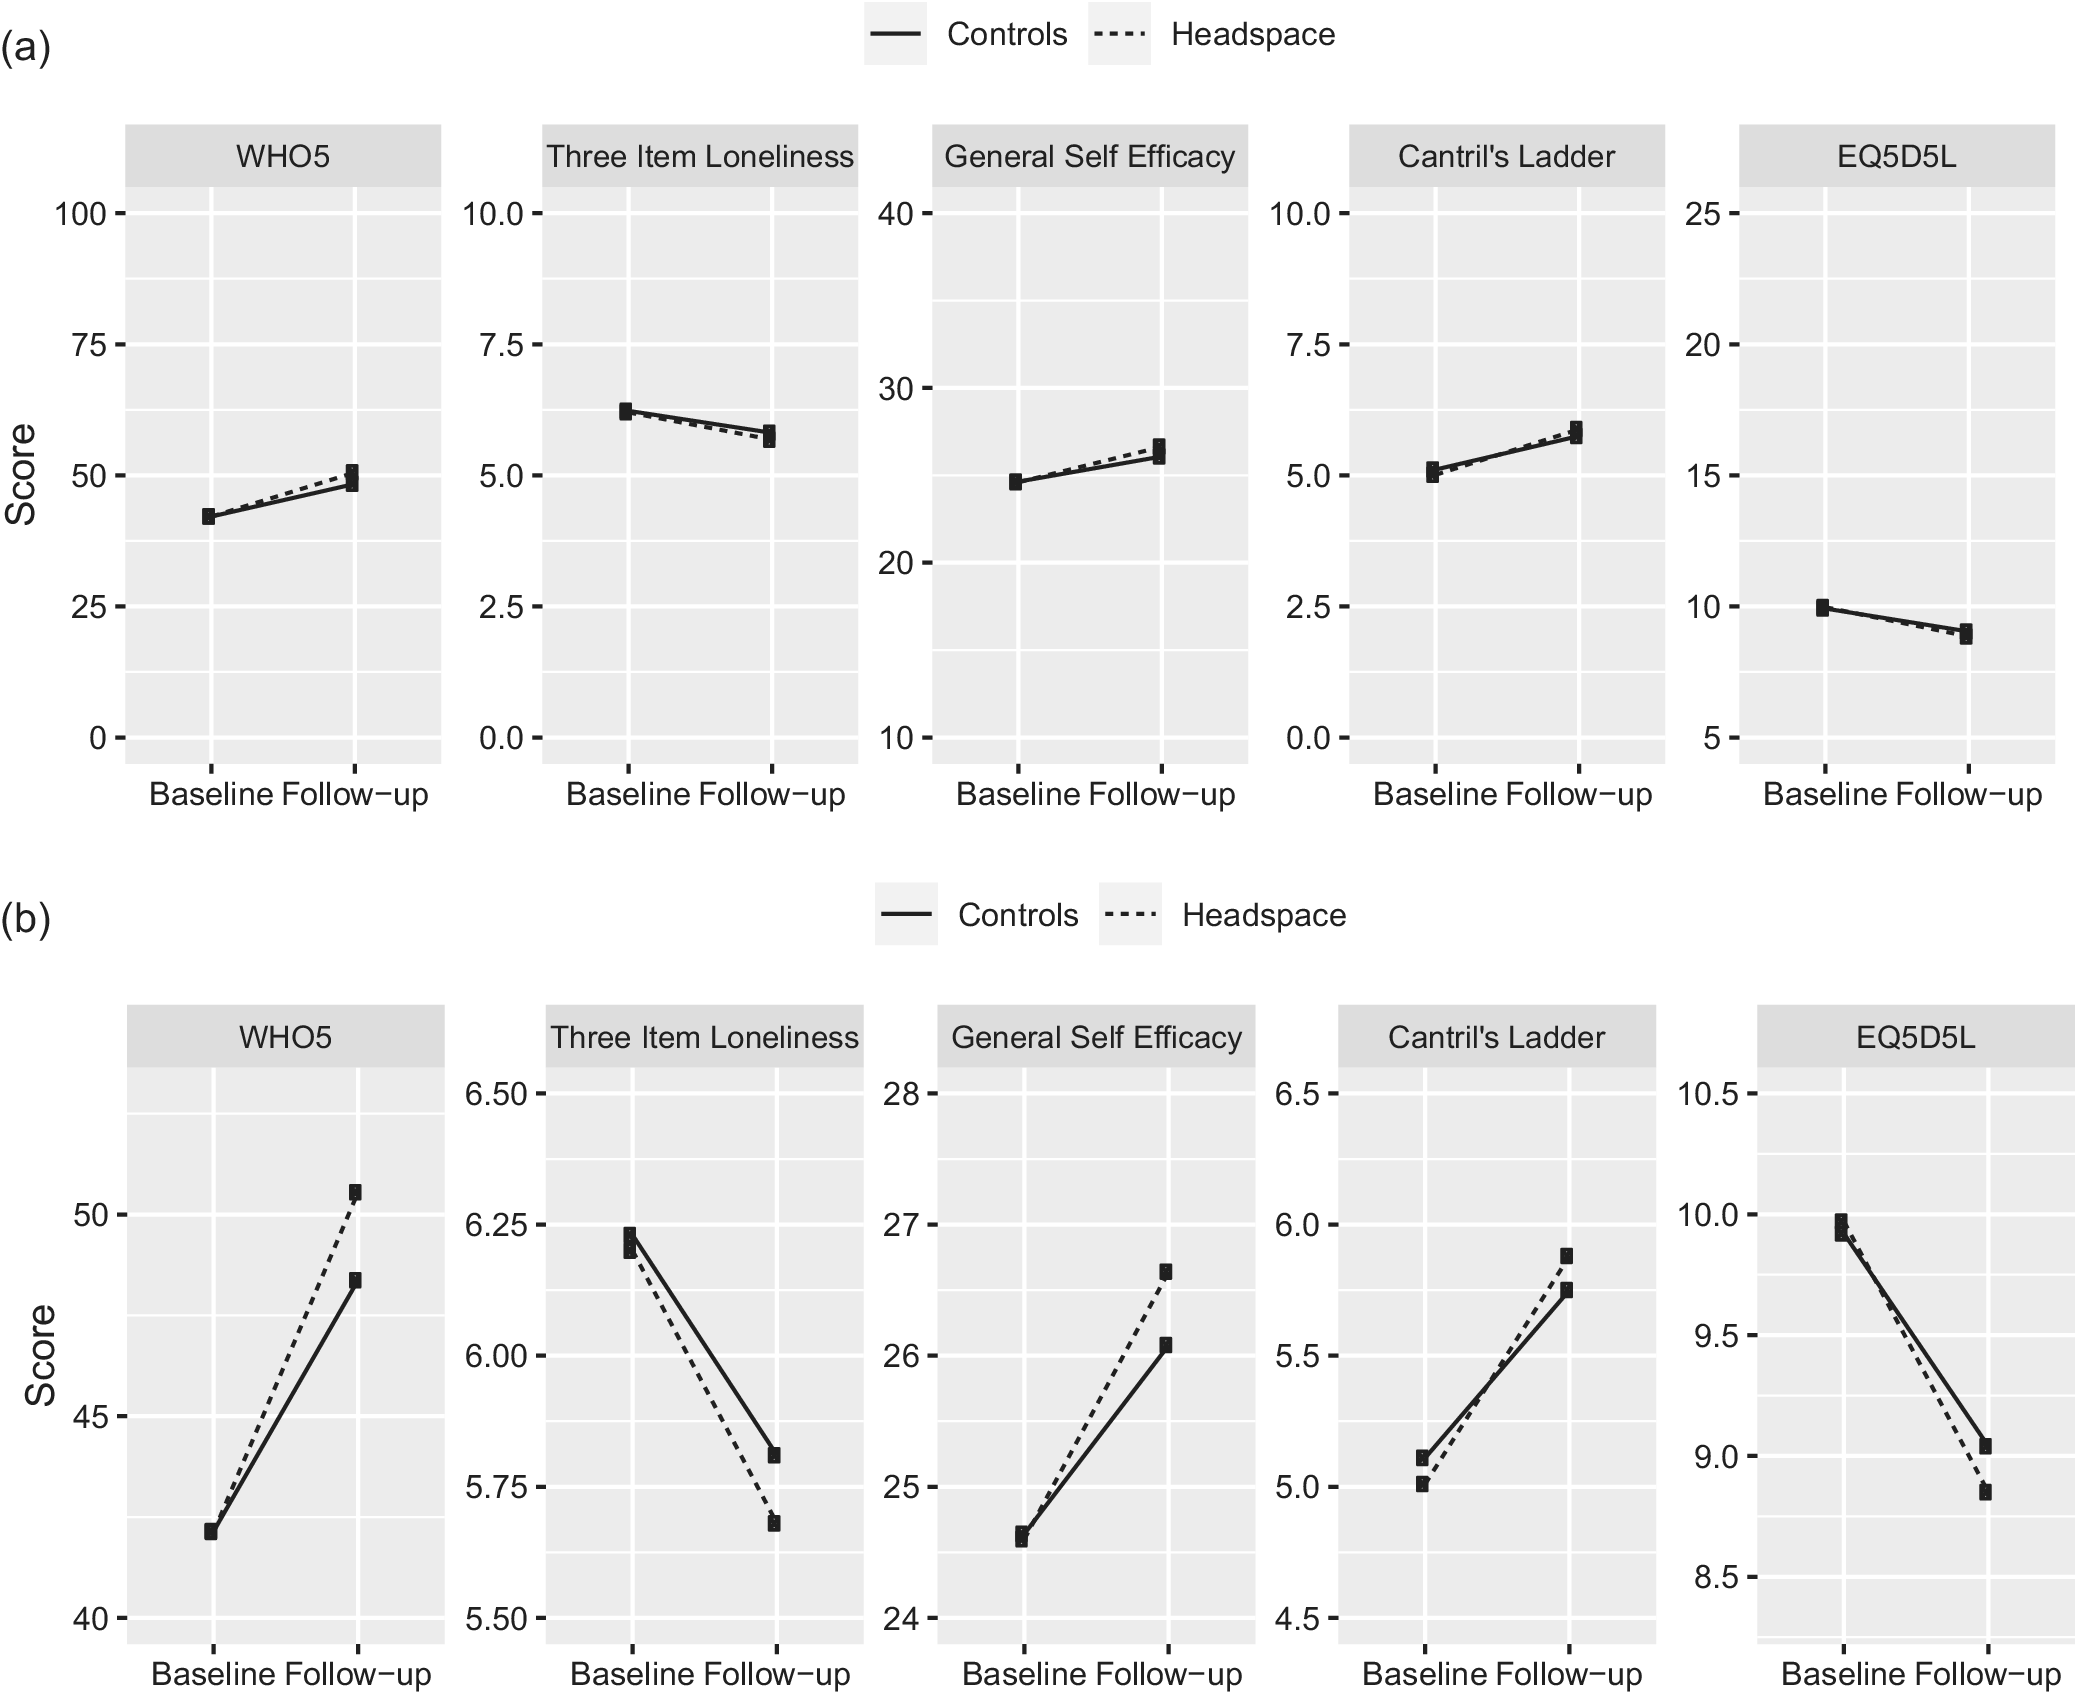
No statistically significant effect of the intervention on loneliness, life satisfaction, and health-related quality of life was observed. However, a positive development in favor of the intervention group, across all five outcome measures between baseline and follow-up, was observed (Figure 2).
The five outcome measures at baseline versus 6-month follow. (A) Shown on the full range of each psychometric scale (Y axis). Note: Based on the final model, including multiple imputations and 1:1 matching. For WHO-5, a positive improvement in well-being is reflected by an increase in the total score. For Three-Item Loneliness Scale, a positive improvement in feelings of loneliness is reflected by a decrease in the total score. For General Self-Efficacy Scale, a positive improvement in self-efficacy is reflected by an increase in the total score. For Cantril’s Ladder, a positive improvement in life satisfaction is reflected by an increase in the total score. For EQ-5D-5L, a positive improvement in health-related quality of life is reflected by a decrease in the total score. (B) Shown on a zoom-in on the locally relevant range of each psychometric scale (Y axis). Note: Based on the final model, including multiple imputations and 1:1 matching. For WHO-5, a positive improvement in well-being is reflected by an increase in the total score. For Three-Item Loneliness Scale, a positive improvement in feelings of loneliness is reflected by a decrease in the total score. For General Self-Efficacy Scale, a positive improvement in self-efficacy is reflected by an increase in the total score. For Cantril’s Ladder, a positive improvement in life satisfaction is reflected by an increase in the total score. For EQ-5D-5L, a positive improvement in health-related quality of life is reflected by a decrease in the total score.

Figure 2. Long description
The figure consists of two horizontal rows of five line graphs each. Row a shows the full scale range for each measure, while row b provides a zoomed-in view of the data range. Each graph plots Score on the Y axis against time points Baseline and Follow-up on the X axis. Two groups are represented: Controls (solid line) and Headspace (dashed line).
From left to right, the panels are:
1. W H O 5: Both groups show a linear increase from baseline to follow-up. In the zoomed view, the Headspace group shows a steeper improvement than the Controls.
2. Three Item Loneliness: Both groups show a linear decrease. In the zoomed view, the Headspace group reaches a lower loneliness score than the Controls at follow-up.
3. General Self Efficacy: Both groups show a linear increase. The zoomed view indicates the Headspace group achieves a higher score at follow-up compared to Controls.
4. Cantril’s Ladder: Both groups show a linear increase in life satisfaction. The zoomed view shows the Headspace group slightly higher than Controls at follow-up.
5. E Q 5 D 5 L: Both groups show a linear decrease in score, indicating improved health-related quality of life. The zoomed view shows the Headspace group achieving a lower score than Controls at follow-up.
Subgroup analyses
Three subgroup analyses were performed, stratified by age, sex assigned at birth, and degree of well-being at baseline, as shown in Supplementary Material 4. These analyses were, however, associated with a high degree of uncertainty.
Sensitivity analyses
Two sensitivity analyses were conducted, as shown in Supplementary Material 5. There were differences in the results between the observed model, the two “intermediate calculations” (one model with multiple imputations and one with 1:1 matching), and the final model that combined multiple imputations and 1:1 matching. However, since the first three models did not account for uncertainties and biases related to missing responses and imbalances between the intervention and control groups at baseline, these models were not valid or reliable.
Population attributable fraction
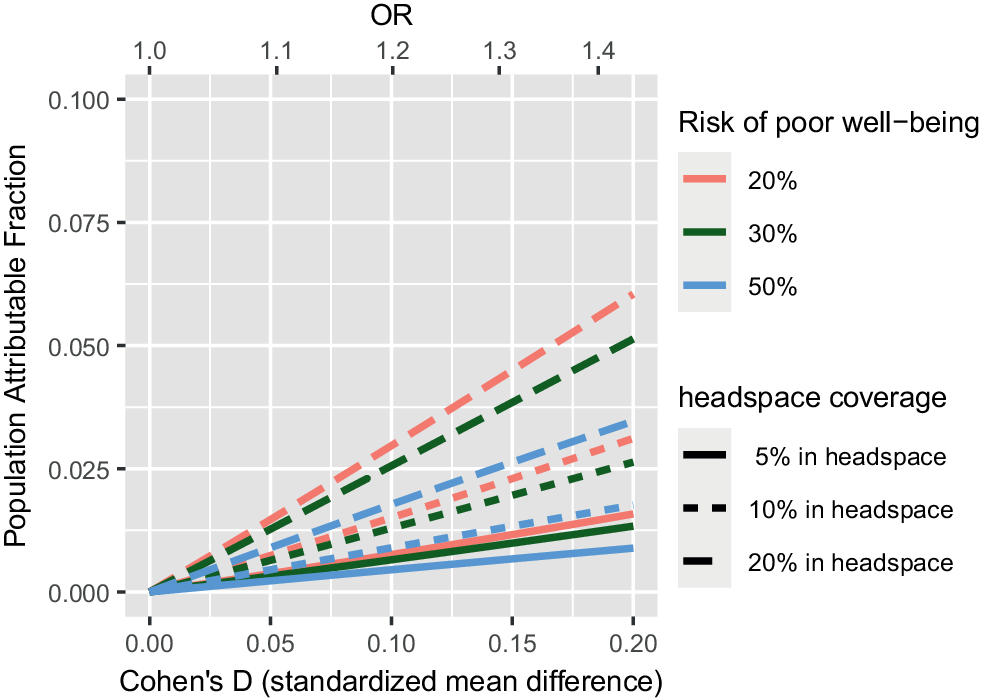
The results of the post-hoc PAF calculations are presented in Figure 3. With an effect size of Cohen’s D = 0.1, as identified for WHO-5, the PAF – referring to the proportion of low well-being in the youth population that could be prevented by the headspace intervention – would be around 1%, given a prevalence of low well-being among headspace users of 70% and a scenario where the headspace intervention reaches 20% of the affected population. If coverage increases, so that 80% of the target group is reached by the intervention, the PAF would be around 4%.
Population attributable fraction under four different scenarios.

Figure 3. Long description
The graph features three axes. The primary X-axis at the bottom is Cohen’s D (standardized mean difference) ranging from 0.00 to 0.20. The secondary X-axis at the top is O R (Odds Ratio) ranging from 1.0 to 1.4. The Y-axis is Population Attributable Fraction ranging from 0.000 to 0.100.
Two legends are positioned on the right. The first, Risk of poor well-being, uses colors: light red for 20%, dark green for 30%, and blue for 50%. The second, headspace coverage, uses line styles: solid for 5% in headspace, dashed for 10% in headspace, and long-dashed for 20% in headspace.
All data lines originate at (0,0) and show a linear increase as Cohen’s D increases. The steepest slopes belong to the 20% in headspace (long-dashed) lines, followed by 10% (dashed), and 5% (solid). Within each line style group, the 20% risk (light red) has the highest trajectory, followed by 30% risk (dark green), and 50% risk (blue) has the lowest trajectory. The highest point on the graph is reached by the light red long-dashed line (20% risk, 20% headspace), ending at approximately 0.06 on the Y-axis when Cohen’s D is 0.20.
Discussion
This study, investigating the effectiveness of the headspace intervention, is the first of its kind, nationally and internationally. Overall, the evaluation demonstrated a statistically significant effect of the intervention on the participants’ well-being. For self-efficacy, loneliness, life satisfaction, and health-related quality of life, there was a positive trend in favor of the intervention group, but it was not statistically significant.
The effect size for the association between the headspace intervention and the improvement in participants’ well-being was small. This was expected, as it is well documented that preventive and health-promoting interventions yield smaller effect sizes compared to clinically relevant effect sizes observed in randomized controlled trials (RCTs) [Reference Jensen, Jensen, Gudex, Pedersen, Sørensen and Ehlers14, Reference Cohen15]. Thus, the interpretation of the effect size should be considered in the context of the intervention’s low-intensity, short-term, preventive and health-promoting, and population-based nature [Reference Jensen, Jensen, Gudex, Pedersen, Sørensen and Ehlers14–Reference Richard, Bond and Stokes-Zoota16]. Despite the small effect size, the positive change in well-being was important, as the average well-being score for the intervention group crossed the threshold that distinguishes low versus high well-being (WHO-5 = 50) [Reference Bjørkedal, Christensen, Poulsen, Ranning, Thorup and Nordentoft8], although still far from the maximum score for “optimal” well-being. These findings align with the Australian headspace evaluation, which showed a clinically significant improvement in well-being, psychosocial functioning, and quality of life, and half of the participants moving from being categorized as a clinical population to a nonclinical population [Reference Anker, Andersen, Gamst-Jensen, Tavenier, Rasmussen and Andersen19]. However, this evaluation did not include a control group or account for a low response rate [Reference Anker, Andersen, Gamst-Jensen, Tavenier, Rasmussen and Andersen19]. An evaluation of the Dutch @ease initiative, similar to headspace Denmark, also showed a positive development in users’ well-being and functioning; however, it was not statistically significant [20].
In subgroup analyses, it was demonstrated that headspace had an effect across all age groups. Previous studies have shown that individuals <18 years of age can be difficult to retain in both health-promoting interventions and treatment, which can result in lower or absent effects, but this was not the case [Reference Cheung, Ten Klooster, Smit, De Vries and Pieterse21]. Furthermore, individuals experiencing the highest levels of distress at baseline benefited the most from headspace.
We will explore whether headspace can help prevent mental disorders in the long run [Reference McGorry, Mei, Dalal, Alvarez-Jiminez, Blakemore and Browne1, Reference Castelpietra, Knudsen, Agardh, Armocida, Beghi and Iburg2] and whether it is cost-effective in the 3-year follow-up of this study.
To evaluate if the small effect size at the individual level translated into a larger effect at the population level, the PAF was estimated [Reference Richard, Bond and Stokes-Zoota16]. This showed that if 80% of the target group is reached by the intervention, the overall burden of poor well-being among young people in Denmark could be reduced by ~4%, and if 20% is reached, the burden could be reduced by 1%. These calculations are based on assumptions; thus, the results are not definitive. Despite a relatively small PAF, the headspace intervention can still be valuable in cumulative efforts, particularly as it is relatively easy to scale up and if it has low associated costs.
The effect size for the positive association between the headspace intervention and the improvement in participants’ self-efficacy was small and only close to being statistically significant. However, the effect size is within the expected range for this type of intervention [Reference Jensen, Jensen, Gudex, Pedersen, Sørensen and Ehlers14, Reference Richard, Bond and Stokes-Zoota16]. Self-efficacy affects the risk of developing mental disorders, the chances for recovery, and how one engages in health-promoting interventions or treatments [Reference Ottosen, Berger and Lindeberg22–Reference Jaiswal, Carmichael, Gupta, Siemens, Crowley and Carlsson25]. Therefore, strengthening young people’s self-efficacy through the headspace intervention is a valuable investment with significant preventive potential.
No statistically significant effects were found for headspace users’ feelings of loneliness, life satisfaction, or health-related quality of life; however, a positive trend was observed over time in both groups. This may reflect factors such as natural fluctuations in well-being, regression to the mean, or the possibility that they received other types of support [Reference Gloster, Miché, Wersebe, Mikoteit, Hoyer and Imboden26, Reference Linden27]. The psychometric scales used may not have captured the challenges that young people face, for example, EQ-5D-5L was originally developed for adults [Reference Levin and Currie12]. In the evaluation of headspace Australia, MyLifeTracker [Reference Kwan, Rickwood and Telford28] – a scale developed based on aspects of everyday life and quality of life that young people themselves find valuable – was used instead of EQ-5D-5L and proved a significant effect on quality of life.
headspace reached a group of young people with poor mental health. However, a social skewing was indicated, as headspace users were less likely to have an ethnic minority background and more likely to come from families with well-educated parents. However, they might still live in less well-functioning homes, as other factors that could negatively impact their mental health, such as childhood trauma, are not captured in national registry data [Reference Kirkbride, Anglin, Colman, Dykxhoorn, Jones and Patalay29].
Strengths and limitations
This effectiveness evaluation is the first of its kind to measure the effectiveness of headspace against a comparable control group. Therefore, the findings are more reliable than existing studies on headspace’s impact. The statistical power of the analyses was sufficient to detect differences down to 0.1 SMD [Reference Borm, Fransen and Lemmens30].
There are also limitations. First, response rates at follow-up were low, leading to a high dropout rate and differences between those completing the survey and those dropping out. Second, it was not possible to conduct an RCT, which would have been the ideal study design, as Danish headspace centers are obliged not to exclude anyone seeking their services. However, the quasi-experimental design approximated the conditions of an RCT. Third, not registering the number of counseling sessions received made it impossible to explore a potential dose–response relationship. Finally, the study did not investigate what kind of support or treatment the control group received.
Implications
Whether headspace contributes to preventing mental disorders in the long term will be examined in the 3-year follow-up. This will evaluate the potential reductions in psychiatric diagnoses, healthcare utilization, the achieved educational levels, and labor market participation, as well as social service use among young people in the intervention group and compare this to the costs of the intervention.
Future research should further investigate who is not being reached by the intervention, so that new strategies for identifying vulnerable individuals can be applied. Furthermore, research is needed to understand the characteristics of those who do not benefit from the intervention, as well as to examine what outcomes they experience after being referred from headspace to, for example, psychiatric treatment.
Conclusion
This study is the first of its kind to assess the effects on young people of participating in counseling sessions at headspace Denmark – a nationwide, health-promoting, and preventive service for 12- to 25-year-olds. The evaluation demonstrated a statistically significant effect of the intervention on users’ well-being at 6-month follow-up. In the long term, there is potential for a public health and socioeconomic benefit from the intervention, which will be further explored in the 3-year follow-up of this study.
Supplementary material
The supplementary material for this article can be found at http://doi.org/10.1192/j.eurpsy.2026.12254.
Data availability statement
Open access to data is restricted by EU and local legislation, but data can be shared upon reasonable request.
Acknowledgments
The authors would like to thank the analysis consultants at headspace, Mille Sofie Regner Nielsen and Sofie Valentin Weiskopf, who have contributed information about the headspace initiative and registration data from headspace’s annual reports. We are also very thankful to all the volunteer counselors and center managers in the Danish headspace centers for recruiting participants.
ChatGPT (GPT-4, accessed via OpenAI, May 2025 version) was used to assist with translation and proofreading of the manuscript to enhance the language quality, without generating new scientific content or interpreting results. The prompt used was: “Please help proofread this academic paper for grammar and style, keeping scientific terminology intact.” All AI-assisted outputs were reviewed and edited by the authors to ensure accuracy and appropriateness.
Financial support
The study was funded by TrygFonden (Grant number 153506) and The Social Network.
Competing interests
The authors declare none.
Ethical standards
The effectiveness evaluation was conducted in accordance with the study protocol, the Helsinki Declaration in its latest form, good clinical practice guidelines, and national and EU legislation on data management. Informed consent was obtained in accordance with Danish and European legislation, and all service users who participated were assured anonymity (Privacy number P-2022-602). Since the evaluation was not a biomedical study and because the intervention was conducted at the headspace centers, the protocol did not require acceptance from the Ethics Committee in the Capital Region of Denmark (Case number of correspondence with the Ethics Committee: 21061429).




 Open access


Comments
No Comments have been published for this article.