I. INTRODUCTION
Considerable attention has been paid to oxides containing transition metal elements for the last several decades from a point of view of their unique electronic structures and curious physical properties including electrical conduction, dielecric properties, magnetism, and optical properties. Among many sorts of oxides, those having perovskite and its related structures, in particular, exhibit intriguing electrical and magnetic properties. One of the prototypes of properties the oxides with perovskite structure manifest is ferroelectricity. Several kinds of oxides such as BaTiO3, Pb(Zr,Ti)O3, (Pb,La)(Zr,Ti)O3, and KNbO3 are ferroelectric at room temperature, and they are practically utilized as capacitors, piezoelectric devices, surface acoustic wave devices, and second-order nonlinear optical materials. Another interesting and important example of the properties can be found in so-called high-T c superconductors. The copper oxide-based superconductors mainly discovered at the end of 80's such as (La,Ba)2CuO4, YBa2Cu3O7, Bi2Ca2Sr2Cu3O10, and so forth have perovskite-related structures. SrTiO3 also crystallizes in a perovskite structure and becomes a superconductor when oxygen vacancy is introduced or dopants such as La3+ and Nb5+ are incorporated although its critical temperature is rather low; T c = 0.1–0.7 K depending on the concentration of defect or dopant.Reference Schooley, Hosler, Ambler, Becker, Cohen and Koonce1–Reference Olaya, Pan, Rogers and Price4 For SrTiO3, a recent study has revealed that two-dimensional (2D) electron gas is generated and leads to superconducting transition at 200 mK at an interface between SrTiO3 and LaAlO3 although both the oxides are insulators.Reference Reyren, Thiel, Caviglia, Fitting Kourkoutis, Hammerl, Richter, Schneider, Kopp, Rüetschi, Jaccard, Gabay, Muller, Triscone and Mannhart5 Also, 2D electron gas confined in Nb-doped SrTiO3 quantum well formed in between SrTiO3 layers gives rise to a very large thermoelectric Seebeck coefficient.Reference Ohta, Kim, Mune, Mizoguchi, Nomura, Ohta, Nomura, Nakanishi, Ikuhara, Hirano, Hosono and Koumoto6 It is well-known that the SrTiO3 itself shows quantum paraelectric behavior at low temperatures.
As for magnetic properties of oxides with perovskite structure, compounds containing transition metal ion with mixed valence state, such as (La,Sr)MnO3 and (La,Sr)CoO3, show ferromagnetism at room temperature owing to the double exchange interaction between transition metal ions. These oxides are fairly rare examples of ferromagnetic oxides; most of the oxides are rather antiferromagnetic or ferrimagnetic below their magnetic transition temperature. Because the ferromagnetism observed in these oxides is closely associated with the conduction of charged carriers, the oxides, in particular manganese oxide-based compounds, have arrested a great deal of attention from a point of view of application to spintronics. Indeed, for the compounds such as (La,Ca)MnO3, (La,Sr)MnO3, (La,Ba)MnO3, and (Pr,Ca)MnO3, giant magnetoresistance or colossal magnetoresistance has been observed.Reference Jin, Tiefel, McCormack, Fastnacht, Ramesh and Chen7–Reference Tomioka, Asamitsu, Moritomo and Tokura12 Furthermore, some of the oxides with perovskite-related structure are regarded as multiferroics in which magnetically and dielectrically ordered states such as ferromagnetism and ferroelectricity coexist because of strong coupling between spin and phonon mode in the materials.Reference Cheong and Mostovoy13, Reference Tokura14 For instance, BiMnO3, which has a strained perovskite structure, shows ferromagnetic–paramagnetic phase transition at 105 K and, at the same time, manifests ferroelectric–paraelectric transition at 750–770 K.Reference Kimura, Kawamoto, Yamada, Azuma, Takano and Tokura15 Similar behavior was observed for BiFeO3Reference Wang, Neaton, Zheng, Nagarajan, Ogale, Liu, Viehland, Vaithyanathan, Schlom, Waghmare, Spaldin, Rabe, Wuttig and Ramesh16 and TbMnO3.Reference Kimura, Goto, Shintani, Ishizaka, Arima and Tokura17
EuTiO3 is also an oxide with perovskite structure and possesses interesting electrical and magnetic properties. The stable phase of EuTiO3 as well as SrTiO3 crystallizes in a cubic perovskite structure at room temperature and atmospheric pressure. The lattice constant of EuTiO3 is 0.3905 nm at ambient temperature and pressure. This value is just the same as the lattice constant of SrTiO3, as naturally expected from the similarity in ionic radii between Sr2+ and Eu2+. In addition, not only SrTiO3 but also EuTiO3 exhibits quantum paraelectric behavior at low temperatures. On the other hand, magnetic moment due to 4f Reference Jin, Tiefel, McCormack, Fastnacht, Ramesh and Chen7 spins localized at the Eu2+ site brings about magnetic properties that are peculiar to EuTiO3 but are absent in SrTiO3. It is known that the ensemble of magnetic moments of Eu2+ ions forms a G-type antiferromagnetic ordering in EuTiO3 below 5.3 K.Reference McGuire, Shafer, Joenk, Alperin and Pickart18, Reference Chien, DeBenedetti and Barros19 Moreover, a strong coupling between spin and soft phonon mode exists in EuTiO3, as demonstrated by the experimental fact that not only magnetic susceptibility but also dielectric constant manifests a drastic change at the Néel temperature, i.e., T N = 5.3 K.Reference Katsufuji and Takagi20 EuZrO3, which adopts an orthorhombic perovskite structure at room temperatureReference Viallet, Marucco, Saint, Herbst-Ghysel and Dragoe21, Reference Zong, Fujita, Akamatsu, Murai and Tanaka22 and shows antiferromagnetic transition at 4.1 K,Reference Zong, Fujita, Akamatsu, Murai and Tanaka22 exhibits a similar magnetodielectric effect. The dielectric constant of EuZrO3 is strongly dependent on an applied magnetic field below the Néel temperature.Reference Kolodiazhnyi, Fujita, Wang, Zong, Tanaka, Sakka and Takayama-Muromachi23 These phenomena are of interest in relation to the multiferroics mentioned above.
Recently, theoretical approaches have been performed to study the dependence of magnetic and dielectric properties on a strain or a change in lattice volume for EuTiO3, and interesting results have been derived. Fennie and RabeReference Fennie and Rabe24 predicted that both ferromagnetic and ferroelectric states are stabilized when a biaxial compressive stress is applied to induce a strain >1.2% in the plane parallel to the surface of EuTiO3 thin film although the stable phase of EuTiO3 is antiferromagnetic and quantum paraelectric at low temperatures as described above. In their calculations, the biaxial compressive strain is introduced in the surface of thin film while the lattice volume is kept constant, so that the lattice is elongated in a direction perpendicular to the film surface. Ranjan et al.Reference Ranjan, Nabi and Pentcheva25 performed theoretical calculations based on the local density approximation + U approach and found that ferromagnetic state becomes more stable than G-type antiferromagnetic state as either the lattice volume of EuTiO3 or the on-site Coulomb repulsion U for a 4f electron of Eu2+ ion is increased. Akamatsu et al.Reference Akamatsu, Kumagai, Oba, Fujita, Murakami, Tanaka and Tanaka26 carried out hybrid Hartree–Fock density functional calculations and revealed that as the lattice volume of EuTiO3 is isotropically increased, the exchange coupling constant between nearest-neighboring Eu2+ ions increases and changes its sign from negative to positive above a critical value of lattice volume. This means that the increase in lattice volume leads to the stabilization of ferromagnetic phase in EuTiO3. The result deduced by Akamatsu et al. is described below in detail.
On the other hand, experimental approaches have also been performed to study the relation between a strain or a lattice volume and magnetic as well as dielectric properties of EuTiO3. Fujita et al.Reference Fujita, Wakasugi, Murai, Zong and Tanaka27 found that the as-deposited EuTiO3 thin film on an SrTiO3 (001) substrate has a lattice constant elongated by 2.4% in a direction perpendicular to the film surface and behaves as a ferromagnet at low temperatures, whereas post-annealed EuTiO3 possesses a lattice constant just the same as those of bulk EuTiO3 and SrTiO3 substrate and shows antiferromagnetic transition at 5.1 K, as expected for the stable phase of EuTiO3. This fact suggests that the ferromagnetic behavior is brought about by the increase in lattice volume observed for the as-deposited EuTiO3 thin film, as theoretically predicted for the relation between the magnetic structure and the lattice volume of EuTiO3. By following the theoretical calculations performed by Fennie and Rabe,Reference Fennie and Rabe24 Lee et al.Reference Lee, Fang, Vlahos, Ke, Jung, Fitting Kourkoutis, Kim, Ryan, Heeg, Roeckerath, Goian, Bernhagen, Uecker, Hammel, Rabe, Kamba, Schubert, Freeland, Muller, Fennie, Schiffer, Gopalan, Johnston-Halperin and Schlom28 carried out the spin-polarized generalized gradient approximation + U approach to the EuTiO3 thin film and clarified that tensile as well as compressive strain give rise to the stabilization of ferromagnetic and ferroelectric phase of EuTiO3. They also experimentally demonstrated that the EuTiO3 thin film under tensile strain caused by the DyScO3 substrate becomes a ferroelectric ferromagnet due to the strong spin-lattice coupling. They observed that the intensity of second-harmonic wave generated in the EuTiO3 thin film on the DyScO3 substrate gradually increases with a decrease in temperature below about 250 K. This phenomenon was related to the fact that the ferroelectric state is stabilized below this temperature.
The above-mentioned theoretical and experimental results seem to indicate that there exists a correlation between the strain or the lattice volume and the magnetic structure of EuTiO3, but experimental study on the effect of a systematic variation in lattice volume on the magnetic properties of EuTiO3 has not been performed. In the present investigation, we achieve a systematic variation in the lattice volume of the EuTiO3 thin film by changing the type of substrate compound so that the lattice mismatch between the thin film and the substrate leads to a strain in the plane parallel to the film surface. For the growth of thin films, a pulsed laser deposition (PLD) method is utilized. We demonstrate that magnetization at low temperatures correlates with the lattice volume of the EuTiO3 thin film; the experimental result qualitatively supports the theoretical prediction. On the other hand, when an SiO2 glass plate is used as a substrate and it is kept at room temperature during the deposition process, the amorphous EuTiO3 thin film is obtained. Interestingly, the amorphous EuTiO3 thin film is ferromagnetic at low temperatures and the Curie temperature of the amorphous phase is comparable with the Néel temperature of the crystalline EuTiO3. The amorphous Eu2TiO4 thin film also exhibits ferromagnetic transition, and the Curie temperature is higher than that of its crystalline counterpart.Reference Akamatsu, Fujita, Zong, Takemoto, Murai and Tanaka29 These are very rare phenomena; amorphous oxides exhibiting ferromagnetic transition have been never found thus far, and the magnetic phase transition temperature is usually lower by one order of magnitude for amorphous oxide than for its crystalline counterpart with the identical composition. In this paper, we report on these fairly interesting phenomena.
II. EXPERIMENTAL
A. Sample preparation
A PLD method was performed for the synthesis of crystalline EuTiO3 thin films. Eu2Ti2O7, the structure of which is pyrochlore, was used as a target material. A sintered body of Eu2Ti2O7 was prepared via conventional solid-state reaction between Eu2O3 and TiO2. The EuTiO3 thin films were grown on the (001) plane of single-crystalline LaAlO3, SrTiO3, and DyScO3, having the perovskite structure similar to EuTiO3, as a substrate, so that the different lattice constant among the substrate compounds could give rise to the difference in lattice volume among EuTiO3 thin films deposited on the substrates. The lattice constant of EuTiO3, LaAlO3, SrTiO3, and DyScO3 is 0.3905 nm, 0.3790 nm, 0.3905 nm, and 0.3944 nm, respectively. Hence, considering the lattice mismatch between the EuTiO3 thin film and the substrate compounds, shrinkage and elongation of lattice in the plane parallel to the surface of the EuTiO3 thin film were anticipated for LaAlO3 and DyScO3 substrates, respectively, and neither shrinkage nor elongation was expected for the SrTiO3 substrate. The target material was irradiated with a pulsed KrF excimer laser operating at a power of 180 mJ, a wavelength of 248 nm, and a repetition rate of 5 Hz. The substrate was set 2.5 cm apart from the target and kept at 650 °C. The deposition was performed under an oxygen partial pressure of 1.0 × 10⁻⁵ Pa.
Amorphous thin films with nominal compositions of EuTiO3 and Eu2TiO4 were also prepared by using the PLD method. Polycrystalline EuTiO3 was utilized as a target material for the amorphous EuTiO3 thin film. The target material was synthesized via conventional solid-state reaction. Reagent-grade Eu2O3 and TiO2 were weighed so that the prescribed composition was obtained and mixed thoroughly. The mixture was pressed into a pellet, and the pellet was sintered at 1400 °C for 12 h in air. The resultant material was pulverized, mixed thoroughly, and pressed into a pellet. The pellet was sintered at 1200 °C for 24 h in a reducing atmosphere of 95 vol% Ar and 5 vol% H2. The process of pulverizing and sintering in the reducing atmosphere was repeated four times. The sintered body thus obtained was used as the target. On the other hand, as for the target material to prepare amorphous Eu2TiO4, reagent-grade Eu2O3 was first reduced into EuO by mixing Eu2O3 powder with slightly excess amount of graphite powder, making a pellet, and sintering at 1450 °C for 6 h in a graphite crucible under the reducing atmosphere. A sintered body of EuO thus obtained was pulverized and mixed thoroughly with TiO2 powder to reach the prescribed composition. The mixture was sintered at 1500 °C for 10 h in a graphite crucible under the reducing atmosphere. The resultant material was used as a target for the preparation of amorphous Eu2TiO4 thin film. The target material was set 2.5 cm away from the SiO2 glass substrate. The deposition of thin films was performed by irradiating the target with a KrF excimer laser operating at a wavelength of 248 nm, a repetition rate of 10 Hz, and a fluence of 2–3 mJ/cm2. The substrate was kept in a vacuum chamber with a base pressure of 10−6 Pa and was not intentionally heated.
B. Measurements
Rutherford backscattering spectrometry (RBS) was carried out using a 2.0 MeV He2+ to estimate the composition and thickness of the resultant thin films. Atomic force microscopy (AFM) was performed to observe the surface morphology of the thin films from a point of view of the atomistic level. X-ray diffraction (XRD) with Cu Kα radiation was utilized to identify crystalline phases and to evaluate the lattice constant for crystalline EuTiO3 thin films deposited on several kinds of substrate. XRD measurements were also carried out to confirm that no crystalline phases were present in the amorphous thin films. For the crystalline EuTiO3 thin films, x-ray reciprocal space mappings were obtained by using a four-circle XRD apparatus. High-resolution transmission electron microscopy (HRTEM), selected area electron diffraction (SAED), and x-ray absorption spectroscopy were also performed for the amorphous thin films. The extended x-ray absorption fine structure (EXAFS) spectra were obtained for Eu L 3-edge to examine the local structure of Eu ion in the amorphous thin films. Details of the procedure of measurement and analysis of EXAFS were described elsewhere.Reference Zong, Fujita, Akamatsu, Nakashima, Murai and Tanaka30 Variation of magnetization with temperature and magnetic field was examined by using a superconducting quantum interference device. The magnetic field was applied parallel to the surface of the thin films.
III. RESULTS AND DISCUSSION
A. Lattice volume expansion-induced ferromagnetism of the EuTiO3 thin film
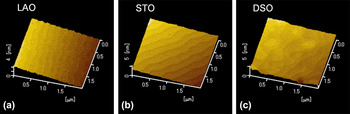
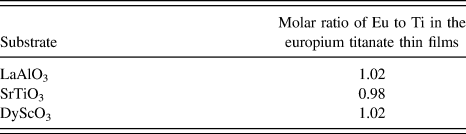
The molar ratio of Eu to Ti, estimated by the Rutherford backscattering, in the thin films deposited on LaAlO3, SrTiO3, and DyScO3 substrates is shown in Table I. The experimental error in the molar ratio was evaluated to be 0.15–0.70%. The molar ratio of Eu to Ti is almost equal to 1 for all the thin films, indicating that the as-deposited thin films are stoichiometric as far as the molar ratio of cations is concerned. Also, it was demonstrated by the out-of-plane and in-plane XRD measurements that the thin films are composed of a single phase of EuTiO3 (although the XRD patterns are not shown here). The data obtained from the XRD measurements, i.e., the reciprocal space mappings, are discussed below in detail. Figure 1 illustrates the AFM image for the EuTiO3 thin films on the different types of substrate. LAO, STO, and DSO indicated in the figure denote the LaAlO3, SrTiO3, and DyScO3 substrates, respectively. So-called stepped and terraced structure is observed, suggesting that the surface of the thin films is atomically flat and smooth.
AFM images of EuTiO3 thin films grown on (a) LaAlO3, (b) SrTiO3, and (c) DyScO3 substrates. LAO, STO, and DSO denote LaAlO3, SrTiO3, and DyScO3, respectively.

Molar ratio of Eu to Ti in the as-deposited europium titanate thin films grown on different sorts of the substrate. The molar ratio is almost equal to 1 in all the thin films, suggesting that stoichiometric EuTiO3 was synthesized.
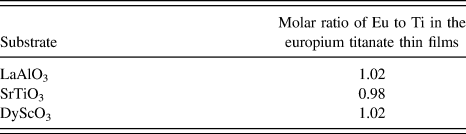
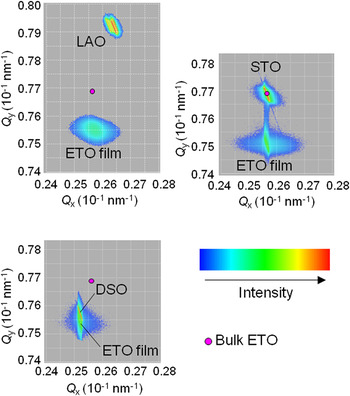
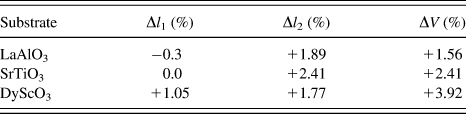
Figure 2 depicts the reciprocal space mappings of 103 reflections for EuTiO3 thin films deposited on LaAlO3, SrTiO3, and DyScO3 substrates. Q x and Q y stand for the reciprocal lattice vectors corresponding to the lattice vector parallel and perpendicular to the film surface, respectively. Bragg spots ascribed to the thin film and the substrate are observed in each of the reciprocal space mappings. The small circle shown in each of the illustrations denotes the reciprocal lattice for bulk EuTiO3. It is possible to evaluate a strain or a change in the lattice volume for EuTiO3 thin film by comparing the reciprocal lattice of the thin film with that of bulk EuTiO3. In the case that LaAlO3 is used as a substrate, Q y of the EuTiO3 thin film is much smaller than that of the bulk EuTiO3, whereas Q x is slightly larger for the EuTiO3 thin film than for the bulk EuTiO3. This fact indicates that the lattice of the EuTiO3 thin film is elongated in a direction perpendicular to the surface of the thin film and slightly shrinks in a direction parallel to the surface. In this case, the lattice of the EuTiO3 thin film is elongated by +1.89% in a direction perpendicular to the surface and shrinks by −0.3% in the plane parallel to the surface, respectively. Therefore, the change in lattice volume from the bulk EuTiO3 is evaluated to be +1.56%. Similar estimation of variation in lattice constant can be performed for the SrTiO3 and DyScO3 substrates. The results are summarized in Table II, where Δl 1 and Δl 2 denote the variation in lattice constant in a direction parallel and perpendicular to the surface of the thin film, respectively, and ΔV stands for the change in lattice volume for the EuTiO3 thin films. As expected from the degree of lattice mismatch, the lattice volume of the EuTiO3 thin film is the largest for the DyScO3 substrate and the smallest for the LaAlO3 substrate. For the SrTiO3 substrate, an intermediate value is obtained.
Reciprocal space mappings of 103 reflections for EuTiO3 thin films as well as LaAlO3, SrTiO3, and DyScO3 substrates. Q x and Q y stand for the reciprocal lattice vectors corresponding to the lattice vectors parallel and perpendicular to the surface of the EuTiO3 thin film, respectively. The small circle shown in each of the mappings denotes the reciprocal lattice of bulk EuTiO3.

Variation in lattice constant and lattice volume for EuTiO3 thin films grown on LaAlO3, SrTiO3, and DyScO3 substrates. A relative difference in the values between the thin film and the bulk EuTiO3 is listed. Δl 1 and Δl 2 denote the change in lattice constant in a direction parallel and perpendicular to the surface of the thin film, respectively. ΔV stands for the change in lattice volume relative to the bulk EuTiO3.
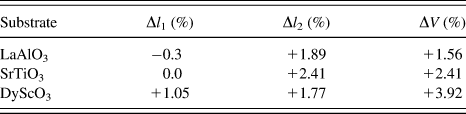
Whereas the in-plane lattice constant of the EuTiO3 thin film is varied by altering the kind of substrate compound, the out-of-plane lattice constant of the EuTiO3 thin film is increased when compared with the bulk EuTiO3 irrespective of the sort of substrate compound. As a result, the lattice volume of the EuTiO3 thin film becomes larger than that of bulk EuTiO3 even when LaAlO3, whose lattice constant is smaller than that of bulk EuTiO3, is used as a substrate. In general, when the lattice constant is larger for material of thin film than for the substrate material, the in-plane lattice constant of the thin film becomes shorter, and the out-of-plane lattice constant becomes longer because of the compressive strain at the interface between the thin film and the substrate.Reference Lee, Fang, Vlahos, Ke, Jung, Fitting Kourkoutis, Kim, Ryan, Heeg, Roeckerath, Goian, Bernhagen, Uecker, Hammel, Rabe, Kamba, Schubert, Freeland, Muller, Fennie, Schiffer, Gopalan, Johnston-Halperin and Schlom28, Reference Takahashi, Onoda, Kawasaki, Nagaosa and Tokura31 For instance, the out-of-plane lattice constant of the EuTiO3 thin film deposited on the (LaAlO3)0.3(Sr2AlTaO6)0.7 substrate, the lattice constant of which is smaller than that of the bulk EuTiO3, becomes longer by about 0.89%.Reference Takahashi, Onoda, Kawasaki, Nagaosa and Tokura31 Compared with this value, however, the elongation of the lattice in the out-of-plane direction is more significant for the present EuTiO3 thin film deposited on the LaAlO3 substrate (see Table II). Moreover, such elongation of lattice in the out-of-plane direction of the EuTiO3 thin film takes place even for the DyScO3 substrate whose lattice constant is larger than that of the bulk EuTiO3, as shown in Table II. One possible origin of the large elongation of lattice in a direction perpendicular to the surface of the present EuTiO3 thin films is that single atomic layers such as EuO and TiO2 layers may be inserted into the perovskite structure during the deposition process to form a compound like the Ruddlesden–Popper phase. However, this possibility can be ruled out, considering the fact that postannealing of as-deposited EuTiO3 thin films grown on SrTiO3 substrate makes the lattice constant shrink to be just the same as the lattice constant of the bulk EuTiO3.Reference Fujita, Wakasugi, Murai, Zong and Tanaka27 Some oxygen-related point defects may cause the phenomenon, although experimental evidence is absent at this moment, and hence, further study is needed to solve the problem.
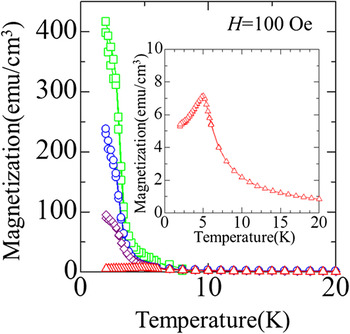
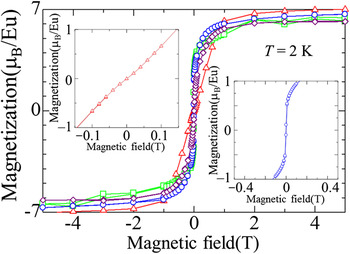
Magnetic properties are shown in Figs. 3 and 4 for the EuTiO3 thin films deposited on LaAlO3, SrTiO3, and DyScO3 substrates. Figure 3 depicts the temperature dependence of magnetization measured at an applied magnetic field of 100 Oe for EuTiO3 thin films grown on LaAlO3 (denoted by diamond), SrTiO3 (circle), and DyScO3 (square) substrates as well as for the bulk EuTiO3 (triangle). The inset of the figure is a magnified view of the magnetization data for the bulk EuTiO3. It is seen that the bulk EuTiO3 manifests an antiferromagnetic transition at about 5 K, as reported in the literature.Reference McGuire, Shafer, Joenk, Alperin and Pickart18, Reference Chien, DeBenedetti and Barros19 In contrast, different behavior is observed for the EuTiO3 thin films; the magnetization drastically increases below about 5 K as the temperature is decreased for all the EuTiO3 thin films. Figure 4 illustrates the variation of magnetization with magnetic field at 2 K for EuTiO3 thin films grown on LaAlO3 (denoted by diamond), SrTiO3 (circle), and DyScO3 (square) substrates as well as for the bulk EuTiO3 (triangle). The insets show the magnetization at low magnetic fields for EuTiO3 thin films grown on the SrTiO3 substrate (right inset: circle) and for the bulk EuTiO3 (left inset: triangle). It is obvious that the magnetic field dependence of magnetization is different between the EuTiO3 thin film and the bulk EuTiO3; the EuTiO3 thin film grown on the SrTiO3 substrate manifests magnetic field dependence of magnetization peculiar to a ferromagnet, whereas a spin-flip transition characteristic of an antiferromagnet is clearly observed for the bulk EuTiO3. The ferromagnetic behavior is seen for the EuTiO3 thin films grown on LaAlO3 and DyScO3 substrates as well. The results are in good agreement with the temperature dependence of magnetization illustrated in Fig. 3. It is also found in Fig. 4 that the saturation magnetization for the EuTiO3 thin films is 6.4–6.8 μB, where μB is the Bohr magnetron. These values are almost identical to the theoretical magnetic moment of Eu2+, i.e., 7 μB, suggesting that almost all the europium ions are present as a divalent state in the thin films. The fact that the valence state of almost all the europium ions in the thin films is +2 was confirmed by conversion electron 151Eu Mössbauer spectroscopy.Reference Fujita, Wakasugi, Murai, Zong and Tanaka27 For instance, the fraction of Eu2+ in the total number of europium ion is 96% and 98% for as-deposited and annealed EuTiO3 thin films grown on the SrTiO3 substrate, respectively. The fraction of Eu2+ and Eu3+ in EuTiO3, or strictly speaking, the composition of which is EuTiO3−δ, is very important because it may affect the magnetic properties. An increase in the fraction of Eu3+ possibly raises the concentration of conduction electron, leading to the ferromagnetic order of Eu2+ ions through the mechanism of magnetic polaron or Ruderman–Kittel–Kasuya–Yoshida interaction. The fact that the fraction of Eu3+ is fairly small in the preset EuTiO3 thin films rules out the possibility of these mechanisms for the ferromagnetism observed in the present thin films. This is further supported by the fact that the evident antiferromagnetic transition occurs in the annealed EuTiO3 thin film, whereas the ferromagnetism is observed in the as-deposited EuTiO3 thin film although the fraction of Eu3+ in the annealed EuTiO3 thin film is almost the same as that in the as-deposited EuTiO3 thin film.Reference Fujita, Wakasugi, Murai, Zong and Tanaka27
Dependence of magnetization on temperature for EuTiO3 thin films grown on LaAlO3 (diamond), SrTiO3 (circle), and DyScO3 (square) substrates as well as for bulk EuTiO3 (triangle). The inset is a magnified view for bulk EuTiO3.

Dependence of magnetization on magnetic field at 2 K for EuTiO3 thin films grown on LaAlO3 (diamond), SrTiO3 (circle), and DyScO3 (square) substrates as well as for bulk EuTiO3 (triangle). The insets depict the magnetization at low magnetic fields for EuTiO3 thin film grown on the SrTiO3 substrate (right inset: circle) and for bulk EuTiO3 (left inset: triangle).

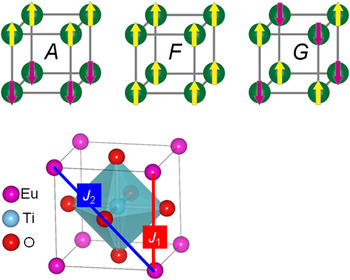
A look at magnetization shown in Fig. 3 reveals that the low-temperature magnetization is the highest for the DyScO3 substrate, intermediate for the SrTiO3 substrate, and lowest for the LaAlO3 substrate. Considering the above-mentioned experimental fact that the lattice volume of EuTiO3 thin film depends on the sort of substrate compound and increases in the order of DyScO3 > SrTiO3 > LaAlO3, it seems that the low-temperature magnetization monotonically increases with an increase in the lattice volume of the EuTiO3 thin film. This tendency is coincident with the result derived by theoretical approaches.Reference Ranjan, Nabi and Pentcheva25, Reference Akamatsu, Kumagai, Oba, Fujita, Murakami, Tanaka and Tanaka26 Akamatsu et al.Reference Akamatsu, Kumagai, Oba, Fujita, Murakami, Tanaka and Tanaka26 calculated energy for different spin configurations in EuTiO3 as shown in Fig. 5 by using the hybrid Hartree–Fock density functional approach. When a prototype of spin-Hamiltonian for Heisenberg system
 $$H_{{\rm{spin}}} \, = \, - 2\mathop\sum\limits_{i > j} {J_{ij} {\bf{S}}_i } \cdot {\bf{S}}_j\quad,$$
Magnetic configurations and magnetic interactions in EuTiO3 lattice. A, F, and G denote A-type antiferromagnetic, ferromagnetic, and G-type antiferromagnetic states, respectively. J 1 and J 2 stand for the exchange-coupling constant between nearest-neighboring and next-nearest-neighboring Eu2+ ions, respectively.

is assumed, the energy of spin system is expressed by
 $$E_{\rm{F}} \, = \,E_0 \, + \,2S(S + 1)( - 12J_1 - 24J_2 )\quad,$$
and
 $$E_G \, = \,E_0 \, + \,2S(S + 1)(12J_1 - 24J_2 )\quad,$$
for ferromagnetic and G-type antiferromagnetic spin configurations in EuTiO3 lattice, respectively. Here, J 1 and J 2 stand for the exchange coupling constant for the nearest-neighboring and the next-nearest-neighboring Eu2+ ions, respectively (see Fig. 5). Equations (2) and (3) indicate that the difference in energy between ferromagnetic and G-type antiferromagnetic states depends only on the sign of J 1. In other words, whether the ferromagnetic or G-type antiferromagnetic state is stable for 4f spins in EuTiO3 is determined only by the exchange interaction among the nearest-neighboring Eu2+ ions. The hybrid Hartree–Fock density functional approach indicates that the exchange coupling constant J 1 monotonically increases as the lattice volume of EuTiO3 increases and that J 1 changes its sign from negative to positive when an increase in lattice volume of EuTiO3 exceeds about 5%.Reference Akamatsu, Kumagai, Oba, Fujita, Murakami, Tanaka and Tanaka26 Subsequently, the ferromagnetic state becomes more stable than the G-type antiferromagnetic state when the lattice volume is increased beyond this critical value. The result derived from the calculations that J 1 is positive and monotonically increases with an increase in the lattice volume above the critical value is qualitatively coincident with the present experimental result shown in Fig. 3 and Table II.
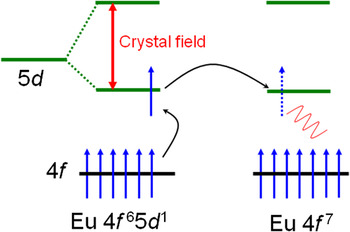
The calculations by Akamatsu et al. also suggest that the overlap between the 4f orbital of Eu2+ and the 3d orbital of Ti4+ in the EuTiO3 lattice becomes more significant as the lattice volume is decreased.Reference Akamatsu, Kumagai, Oba, Fujita, Murakami, Tanaka and Tanaka26 It should be noted that an overlap between the Eu 4f and the O 2p orbitals does not take place even when the lattice volume is decreased. The overlap between the 4f orbital of Eu2+ and the 3d orbital of Ti4+ can bring about the superexchange interaction between the nearest-neighboring Eu2+ ions, leading to antiferromagnetic configuration of magnetic moments of Eu2+ ions. This idea stems from the fact that the Eu 4f orbital is nonorthogonal to the Ti 3d orbital. According to Anderson's theory of superexchange interaction,Reference Anderson32 antiferromagnetic coupling is stabilized by the overlap between magnetic orbitals through intervening orbital, such as p state of nonmagnetic anion, which is nonorthogonal to the magnetic orbital. Hence, the superexchange interaction between Eu2+ ions via the Ti 3d states is expected to be antiferromagnetic. On the other hand, the indirect exchange coupling between 4f spins via 5d state of Eu2+ gives rise to ferromagnetic interaction between the nearest-neighboring Eu2+ ions.Reference Chien, DeBenedetti and Barros19, Reference Shafer33–Reference Souza-Neto, Haskel, Tseng and Lapertot35 The mechanism to bring about the ferromagnetic interaction is schematically illustrated in Fig. 6. The indirect exchange interaction is such a process that an electron excited from the 4f level into the vacant 5d level of an Eu2+ ion is transferred to the 5d level of the nearest-neighboring Eu2+ ion and interacts with 4f spins at the Eu2+ ion so that the spins in 5d and 4f states are parallel. These antiferromagnetic and ferromagnetic interactions compete with each other. The superexchange interaction via 3d state of Ti4+ becomes weaker as the lattice volume of EuTiO3 is increased because of the less overlapping between 4f orbital of Eu2+ and 3d orbital of Ti4+. At the same time, the indirect exchange coupling between 4f spins via 5d state of Eu2+ to bring about ferromagnetic configuration becomes weaker as the lattice volume of EuTiO3 is increased because the separation between the nearest-neighboring Eu2+ ions becomes longer as the lattice volume is increased.Reference Kunes, Ku and Pickett34, Reference Souza-Neto, Haskel, Tseng and Lapertot35 In EuTiO3, the superexchange interaction via Ti4+ 3d state becomes less dominant than the indirect exchange coupling via Eu2+ 5d state as the lattice volume becomes larger. Consequently, ferromagnetic phase is stabilized in EuTiO3 with expanded lattice volume.
Mechanism of indirect exchange interaction between Eu2+ ions to lead to ferromagnetic state. 4f spins interact ferromagnetically with each other via 5d state.

B. Ferromagnetism of amorphous EuTiO3 and Eu2TiO4 thin films
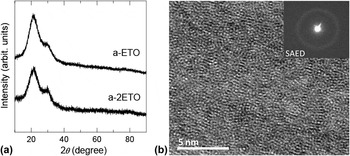
An attempt was made to synthesize amorphous EuTiO3 and Eu2TiO4 thin films on an SiO2 glass substrate by using the PLD method. According to the RBS measurements, the molar ratio of Eu to Ti is estimated to be 1.00:1.00 and 2.00:1.06 for thin films prepared from the target materials with EuTiO3 and Eu2TiO4 compositions, respectively; the molar ratio for the thin films is almost identical to that for the target materials. Figure 7 shows the XRD patterns for EuTiO3 and Eu2TiO4 thin films as well as HRTEM image and SAED pattern for EuTiO3. In the figure, a-ETO and a-2ETO stand for the thin films with EuTiO3 and Eu2TiO4 compositions, respectively. No sharp diffraction lines ascribable to crystalline phases but halo patterns peculiar to amorphous structure are observed in the XRD diagrams, suggesting that the thin films are amorphous and include no crystalline phases. The halo patterns at around 2θ = 30° and 20° are attributable to the thin film and an SiO2 glass substrate, respectively. The HRTEM image and the SAED pattern also indicate that the EuTiO3 thin film contains no crystalline phases, confirming that the thin film is amorphous. Similar results were derived for the Eu2TiO4 thin film from its HRTEM image and SAED pattern.
(a) X-ray diffraction patterns for amorphous EuTiO3 (a-ETO) and Eu2TiO4 (a-2ETO) thin films. (b) HRTEM image and SAED pattern for amorphous EuTiO3.Reference Akamatsu, Fujita, Zong, Takemoto, Murai and Tanaka29

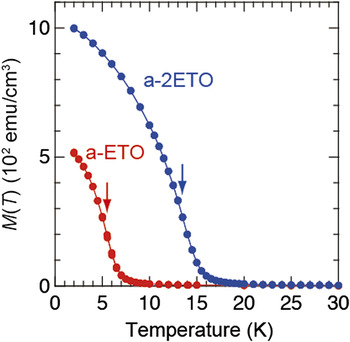
Figure 8 illustrates the variation of magnetization with temperature measured at an applied DC magnetic field of 100 Oe for the amorphous EuTiO3 and Eu2TiO4 thin films. The magnetization is very low at high temperatures; the temperature dependence of magnetic susceptibility at high temperatures is describable in terms of the Curie–Weiss law:
 $${\rm{\chi }} = {{NM_{\rm{B}} ^{\,\,\,\,2} {\rm{\mu }}_{\rm{B}} ^{\,\,\,\,2} } \over {3k_{\rm{B}} \left( {T - {\rm{\theta }}_{\rm{W}} } \right)}}\quad,$$
Dependence of magnetization on temperature at an applied dc magnetic field of 100 Oe for amorphous EuTiO3 (a-ETO) and Eu2TiO4 (a-2ETO) thin films. The arrows indicate an inflection point in each of the magnetization curves. The Curie temperature is defined as the temperature giving the inflection point.Reference Akamatsu, Fujita, Zong, Takemoto, Murai and Tanaka29

where χ is the magnetic susceptibility, T is the temperature, N is the number density of magnetic moment, μB is the Bohr magneton, M B is the effective number of Bohr magnetons, k B is the Boltzmann constant, and θW is the Weiss temperature. On the other hand, as the temperature is decreased, the magnetization increases drastically below a certain temperature. The behavior indicates that the thin films are ferromagnetic at low temperatures. The Curie temperature estimated as an inflection point (as indicated by an arrow in Fig. 8) in the magnetization as a function of temperature is T C = 5.5 K and 14 K for the amorphous EuTiO3 and Eu2TiO4, respectively. First of all, it is surprising that amorphous EuTiO3 exhibits the ferromagnetic phase transition although the stable phase of crystalline EuTiO3 is a G-type antiferromagnet as mentioned above. Besides, the Curie temperature, i.e., 5.5 K, is comparable with the Néel temperature of the crystalline counterpart, i.e., 5.3 K. Secondly, the ferromagnetic phase transition is observed for the amorphous Eu2TiO4 thin film as well as the crystalline phase of Eu2TiO4, and moreover, the Curie temperature of the amorphous phase, i.e., T C = 14 K, is rather higher than that of the crystalline counterpart, i.e., T C = 9 K.Reference Greedan and McCarthy36 The Weiss temperature derived from the fit of Eq. (4) to the magnetic susceptibility data at high temperatures is θW = +8.0 K and +17.6 K for the amorphous EuTiO3 and Eu2TiO4, respectively.Reference Akamatsu, Fujita, Zong, Takemoto, Murai and Tanaka29 These values are significantly higher than the Weiss temperature of their crystalline counterparts, i.e., θW = +3.8 KReference Chien, DeBenedetti and Barros19 and +10 KReference Souza-Neto, Haskel, Tseng and Lapertot35 for crystalline EuTiO3 and Eu2TiO4, respectively, clearly indicating that the amorphization enhances the ferromagnetic interaction among Eu2+ ions. Considering the effect of amorphization on the magnetic properties for other transition metal oxides, these phenomena are very rare. In most of the amorphous oxides or oxide glasses containing 3d transition metal and/or trivalent rare-earth ions, antiferromagnetic rather than ferromagnetic interaction is predominant among the magnetic ions.Reference Sanchez, Friedt, Horne and Van Duyneveldt37–Reference Akamatsu, Oku, Fujita, Murai and Tanaka46 Furthermore, it is usual that the magnetic transition temperature is decreased by one order of magnitude when crystalline oxides are converted into amorphous state with the composition unchanged. For instance, whereas crystalline α-Fe2O3 is known to show weak ferromagnetism below 950 K, amorphous Fe2O3 manifests a cluster spin glass transition at 35.1 ± 0.1 K.Reference Mukadam, Yusuf, Sharma, Kulshreshtha and Dey40 Also, amorphous BiFeO3 shows a spin glass transition at 20 K,Reference Nakamura, Soeya, Ikeda and Tanaka39 whereas crystalline BiFeO3 is antiferromagnetic with the Néel temperature of 643 K.Reference Bhide and Multani47 The ferromagnetic interaction observed even in an amorphous oxide is characteristic of the Eu2+ ion, as a positive Weiss temperature was observed for some oxide glasses containing a large amount of Eu2+ ions.Reference Schoenes, Kaldis, Thöni and Wachter48, Reference Akamatsu, Fujita, Murai and Tanaka49 The ferromagnetic phase transition was also observed for aluminoborosilicate glass containing 60.0 mol% of EuO, although the Curie temperature is as low as 2.2 K.Reference Akamatsu, Fujita, Murai and Tanaka49
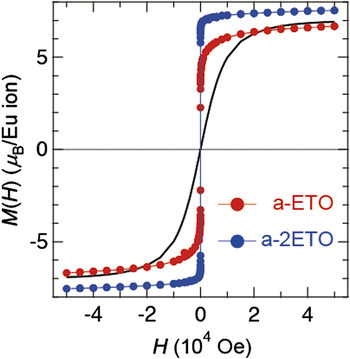
Figure 9 depicts the magnetic field dependence of magnetization measured at 2.0 K for the amorphous EuTiO3 and Eu2TiO4 thin films. In this figure, the theoretical magnetization curve calculated by using the Brillouin function for paramagnetic Eu2+ ion at 2.0 K is also shown. The slope of the magnetization curve at low magnetic fields is steeper for the amorphous EuTiO3 and Eu2TiO4 than for the Brillouin function. This fact suggests that the ferromagnetic interaction is dominant in the amorphous thin films. We can estimate the magnetic moment per Eu ion to be 7 μB from the saturation magnetization at high magnetic fields for both the thin films. This value is coincident with the theoretical one for 4f Reference Jin, Tiefel, McCormack, Fastnacht, Ramesh and Chen7 state of Eu2+, indicating that almost all the europium ions are present as a divalent state in the amorphous thin films.
Dependence of magnetization on magnetic field at 2.0 K for amorphous EuTiO3 (a-ETO) and Eu2TiO4 (a-2ETO) thin films. The solid curve represents the theoretical one calculated using the Brillouin function for paramagnetic Eu2+ ions at 2.0 K.Reference Akamatsu, Fujita, Zong, Takemoto, Murai and Tanaka29

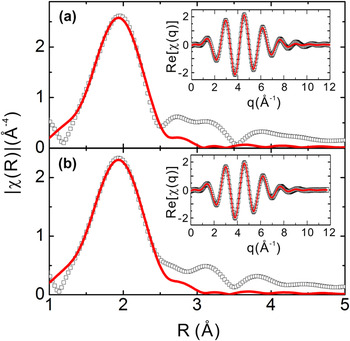
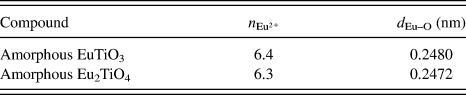
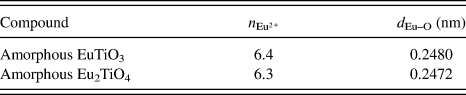
The reason why the ferromagnetic state is stabilized in the amorphous EuTiO3 and Eu2TiO4 thin films can be understood in terms of the local structure of Eu2+ in the amorphous phases and the above-mentioned mechanism to bring about the ferromagnetic interaction among Eu2+ ions. Figure 10(a) and 10(b) illustrate experimental EXAFS spectra (EXAFS oscillation curves χ(R)s as a function of radial distance) at Eu L 3-edge (denoted by open squares) for the amorphous EuTiO3 and Eu2TiO4 thin films, respectively. The insets depict the EXAFS oscillation curves in the q-space. The solid curves stand for the best-fits of theoretical ones to the first Eu–O coordination peaks. Structural parameters evaluated from the analysis, i.e., the average coordination number of Eu2+, n Eu2+, and the nearest Eu–O bond length, d Eu–O, are listed in Table III. For crystalline EuTiO3, n Eu2+ = 12 and d Eu–O = 0.275 nm, and for crystalline Eu2TiO4, the structure of which is K2NiF4-type, n Eu2+ = 9 and d Eu–O = 0.270 nm (an averaged value).Reference Chien, DeBenedetti and Barros19 Hence, both the coordination number of Eu2+ and the Eu–O bond length are much smaller for the amorphous EuTiO3 and Eu2TiO4 than for their crystalline counterparts. The coordination number and the Eu–O bond length in the amorphous phases are rather similar to those of crystalline EuO with the rock salt-type structure, for which n Eu2+ = 6 and d Eu–O = 0.257 nm.Reference McGuire, Shafer, Joenk, Alperin and Pickart18 The result of the structural analysis on the EXAFS spectra discloses the origin of the ferromagnetic interaction stronger in the amorphous thin films than in their crystalline counterparts. The indirect exchange interaction illustrated in Fig. 6 is proportional to J intrab 2/U fd2, where J intra is the intraatomic exchange coupling constant between the 4f and 5d levels of Eu2+, b is the transfer integral between the nearest-neighboring Eu2+ ions, and U fd is the difference in energy between the 4f and 5d levels. As readily seen from Fig. 6, U fd becomes smaller as the crystal field splitting of 5d level is greater, leading to stronger ferromagnetic interactions.Reference Chien, DeBenedetti and Barros19 For instance, the crystal field is much stronger in crystalline EuO than in crystalline EuTiO3 because the coordination number of Eu2+ is 6 in the former and 12 in the latter. Subsequently, the ferromagnetic interaction among Eu2+ ions is so strong that the Curie temperature as high as 77 K is observed in crystalline EuO,Reference Matthias, Bozorth and Van Vleck50 while antiferromagnetic transition takes place at rather low temperature like 5.3 K in crystalline EuTiO3. Since the coordination number of Eu2+ and Eu–O bond length in the amorphous EuTiO3 and Eu2TiO4 are rather close to those in crystalline EuO as demonstrated by the EXAFS spectra, the crystal field splitting of 5d level is larger in the amorphous EuTiO3 and Eu2TiO4 than in their crystalline counterparts, resulting in the enhancement of ferromagnetic interaction in the amorphous phases.
Eu L 3-edge EXAFS spectra in R-space (open squares) and theoretical curves (solid lines) fitted to the first-shell components of the experimental data for (a) EuTiO3 (a-ETO) and (b) Eu2TiO4 (a-2ETO) thin films. R is the radial distance from Eu and χ(R) is the EXAFS oscillation curve. The insets illustrate a comparison of the real part of Fourier filtered first-shell signals in q-space (open squares) and the theoretical curves (sold lines).Reference Zong, Fujita, Akamatsu, Nakashima, Murai and Tanaka30

Structural parameters obtained from EXAFS for Eu2+ in amorphous EuTiO3 (a-ETO) and Eu2TiO4 (a-2ETO) thin films. n Eu2+ and d Eu–O denote the average coordination number of Eu2+ and the nearest-neighboring Eu–O bond length, respectively.Reference Zong, Fujita, Akamatsu, Nakashima, Murai and Tanaka30
The stabilization of ferromagnetic state by the amorphization was also observed in EuZrO3.Reference Zong, Fujita, Akamatsu, Murai and Tanaka51 Crystalline EuZrO3 is an antiferromagnet with the Néel temperature of 4.1 K,Reference Zong, Fujita, Akamatsu, Murai and Tanaka22 whereas the amorphous EuZrO3 thin film prepared by the PLD method shows ferromagnetic transition at 8 K.Reference Zong, Fujita, Akamatsu, Murai and Tanaka51 It should be noted that the magnetic transition temperature is higher for the amorphous phase than for its crystalline counterpart. The mechanism based on the indirect exchange interaction leads to the ferromagnetic configuration of magnetic moments of Eu2+ ions in the amorphous EuZrO3 as well as the amorphous EuTiO3 and Eu2TiO4.
IV. CONCLUSIONS
We have synthesized single-crystalline EuTiO3 thin films on different kinds of substrate, i.e., LaAlO3, SrTiO3, and DyScO3 by using a PLD method so that the strain induced at the interface between the thin film and the substrate due to lattice mismatch leads to a change in lattice volume of the EuTiO3 thin film. All the as-deposited EuTiO3 thin films manifest elongation of lattice by about 2% in a direction perpendicular to the surface of the thin films, whereas the in-plain lattice constant of the thin films is determined by the lattice mismatch, so that the contraction and elongation of the lattice in a direction parallel to the surface of the EuTiO3 thin film are observed for LaAlO3 and DyScO3 substrates, respectively. Subsequently, the lattice volume of the EuTiO3 thin film increases in the order that DyScO3 > SrTiO3 > LaAlO3. We have examined the effect of lattice volume on magnetic properties of the resultant EuTiO3 thin films. The temperature and magnetic field dependence of magnetization indicates that all the EuTiO3 thin films exhibit ferromagnetic transition at low temperatures. Besides, the magnetization at low temperatures monotonically increases in the order that DyScO3 > SrTiO3 > LaAlO3; namely, the magnetization at low temperatures increases with an increase in lattice volume for the as-deposited EuTiO3 thin film. The result is qualitatively coincident with the calculations based on the hybrid Hartree–Fock density functional approach that the exchange coupling constant J 1 increases and changes its sign from negative to positive as the lattice volume of EuTiO3 is increased. The amorphous phase of EuTiO3 and Eu2TiO4 synthesized by the PLD method as a thin film form on the SiO2 substrate is also ferromagnetic when the temperature is decreased. It is interesting that amorphous EuTiO3 is ferromagnetic although the crystalline counterpart is antiferromagnetic; it is a very rare case that amorphization makes an antiferomagnetic coumpound ferromagnetic. Furthermore, the magnetic transition temperature of the amorphous phase is compared with or higher than that of the crystalline counterpart for EuTiO3 and Eu2TiO4, respectively. The larger ferromagnetic interaction in the amorphous phases can be explained in terms of the local structure of Eu2+ similar to the chemical environment around Eu2+ in ferromagnetic crystal EuO. It is concluded that the indirect exchange interaction via 5d state of Eu2+ overcomes the antiferromagnetic interaction in the magnetic interaction among the Eu2+ ions, leading to not only the lattice volume expansion-induced ferromagnetism observed for EuTiO3 but also the ferromagnetism caused by amophizaion for EuTiO3 and Eu2TiO4.
ACKNOWLEDGMENTS
This work was supported by JSPS Grant-in-Aid for Scientific Research B (Grant No. 22360273) and Grant-in-Aid for JSPS Fellows (Grant No. 22-1280).