In the previous article, we looked at identifying groups using latent class analysis (LCA), a method, that is used when a dataset of observed categorical variables is thought to be the result of data from two or more levels (classes) of an unobserved (latent) categorical variable and we wish to try and discover those classes. People from one class differ from people in the other classes in their pattern of responses on the variables – in their probabilities of responding (e.g. ‘no’ vs. ‘yes’; or ‘never’ vs. ‘sometimes’ or ‘always’) to each variable. Not only do the classes differ in this way, but within a class there is no association between the responses, that is the classes explain the association. As the data can be thought of as a mixing of data from the classes, an LCA is a particular kind of mixture analysis.
If we take the LCA concept and change it so that the dataset now comprises observed continuous variables; and the classes differ in their means on one or more variables; then the resulting model is called latent profile analysis (LPA). As with LCA, the model assumes that classes explain associations so that within classes the observed variables are now modelled as uncorrelated. A similar looking model to LPA, one which does not make the assumption of zero within-class correlations, is the finite mixture model (FMM) model, which tries to find underlying clusters of distributed data—univariate if there is only one variable, multivariate if there are two or more. The FMM typically assumes the data have a normal distribution. Depending on which assumptions you include it is easy to move between an LPA and an FMM and indeed obtain quite similar looking answers, but keep in mind that the conceptual models behind these are quite different.
As an example, we will consider some constructed data consistent with an LPA model, which for illustrative purposes we will take to consist of change scores on negative (N) and positive (P) symptoms from patients with schizophrenia following treatment.
The first view of these data is Fig. 1, which shows a scatter plot of the raw data. As is often the case in psychiatric data there are no stark clusters of data, however, the case for underlying classes is not dependent on clear visual evidence of groups of distinct groups of data—in this case distinct types of outcome following treatment.
Scatter plot showing observed N and P scores. Solid lines are means and dotted lines are one SD either side of mean. The solid symbols give the means of the LPA discussed later in the text.

A second view of these data is Fig. 2, which shows a three-dimensional graph of the frequencies of the two outcomes together. The graph has smoothed out some of the bumpiness of the raw data, but unlike the scatter plot it suggests some clustering of data; the peak, for example, corresponds to patients who have shown, relatively, little change on either N or P, and there appear to be two other humps in the data as well.
A two-dimensional histogram-like figure showing the joint frequencies of the two symptom types. The figure has been made to look smoother than the raw data does in order to emphasise the overall shape.

A third view of these data comes from fitting an FMM to the N scores. In Fig. 3, we show a histogram of these scores, superimposed on which are the two underlying normal distributions identified by the FMM. The first of the clusters (or classes) comprises 71% the sample and has mean of around zero, that is, a class where patients largely have not changed on N. The other class is 29% of the sample and here the patients have improved (the mean is 2.2, and with a SD of around 1.3, the effect size for the difference approaches 2). What the figure also shows is that while the histogram seemingly consists of one normal distribution (or as it is often put has a unimodal appearance) it can be made up of two distinct underlying distributions, that is, it can result from the mixture of the two (or more) distributions without looking multimodal.
A histogram of N scores onto which are superimposed the underlying normal distributions identified by a FMM analysis.

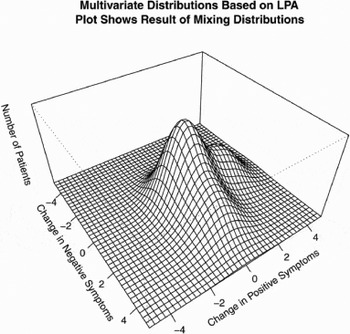
A fourth view of these data comes from fitting a three-class LPA model to the data. The solution identifies one class (51% of the sample) where there is a little change; one class (24%) where N changes but P does not; and a third (25%) where P changes but N does not. The means on N and P for the three classes can be seen in Fig. 1. In Fig. 4, we show the three multivariate distributions corresponding to the latent profiles. These are drawn in a way that make them less overlapping than they are really so that we can see the separate distributions. The more realistic, less distinct, merged distributions are shown in Fig. 5 and as would be expected it more closely resembles Fig. 2.
The three underlying distributions identified by the LPA are plotted in a way as to make them distinct. The largest bump corresponds to the 51% of patients showing little change, while the other two bumps are patients changing on N or P.


As with LCA, we need to show the usefulness of the putative LPA classes. Commonly, this is done by assigning patients to their most likely classes and seeing whether the classes also differ on other variables that plausibly would relate to whether a patient shows no improvement or improves in one domain but not the other. As you can imagine from the overlap in Fig. 2 or 4, some patients will seem as likely to be one class as another, and this obviously makes validating classed even more difficult.
Two final points: (a) there are statistical tests, which need to be used in deciding whether two classes are better than one, three better than two and so on; and (b) for many datasets the software will be unable to identify a consistent solution for the LPA or FMM, such that fitting one of these models will require extensive analytic effort.