Introduction
Enaphalodes rufulus (Haldeman) (red oak borer; Coleoptera: Cerambycidae) is a native wood-boring beetle with a two-year life cycle that is unusual in having synchronous adult emergence during only odd-numbered years (Hay Reference Hay1972a, Reference Hay1974). As the common name suggests, E. rufulus prefers to colonise oaks in the red oak group (Quercus Linnaeus, section Lobatae; Fagaceae), commonly northern red oak (Q. rubra Linnaeus), black oak (Q. velutina Lamarck), and scarlet oak (Q. coccinea Müenchhausen). It is also capable of attacking and infesting white oaks (section Quercus) (Donley Reference Donley1978).
Enaphalodes rufulus larvae feed on living oak phloem and, at the end of their development, construct galleries in host xylem. They are not normally considered tree killers, and populations have historically been recorded at low densities in stressed host trees (Hay Reference Hay1972a, Reference Hay1974). In the Ozark mountains of Arkansas and Missouri, United States of America during the late 1990s and early 2000s there was a widespread outbreak of E. rufulus wherein average attack densities in affected trees were 244/m2 compared to historical averages of 4/m2 (Stephen et al. Reference Stephen, Salisbury and Oliveria2001). The outbreak declined suddenly in the mid-2000s (Riggins et al. Reference Riggins, Galligan and Stephen2009), and was considered to be a part of a widespread oak decline event across the Ozark Mountains and plateau (Fierke et al. Reference Fierke, Kelley and Stephen2007; Haavik et al. Reference Haavik, Jones, Galligan, Guldin and Stephen2012b; Haavik et al. Reference Haavik, Billings, Guldin and Stephen2015).
Spatial distribution of insect oviposition and/or attacks has implications for competition and predation, potentially leading to changes in resource partitioning (Holt Reference Holt1984). Predation by ants (Hymenoptera: Formicidae), sap-feeding beetles (Coleoptera: Nitidulidae), and woodpeckers (Piciformes: Picidae) has been documented for E. rufulus (Hay Reference Hay1972b; Galford Reference Galford1985; Muilenburg et al. Reference Muilenburg, Goggin, Hebert, Jia and Stephen2008). Enaphalodes rufulus larvae were shown to be facultative intraguild predators in a laboratory setting (Ware and Stephen Reference Ware and Stephen2006). If facultative predation also occurred in field scenarios, that behaviour may account for some proportion of E. rufulus larval mortality attributed to unknown causes (Haavik et al. Reference Haavik, Crook, Fierke, Galligan and Stephen2012a). These interactions may affect both how female E. rufulus choose to distribute oviposition on selected hosts and the survival of E. rufulus larvae. Adult activity typically begins when light intensity and temperature increase, with females laying an average of 119 eggs individually, most of them in bark cracks and crevices, and most being laid within the first week following mating (Donley Reference Donley1978).
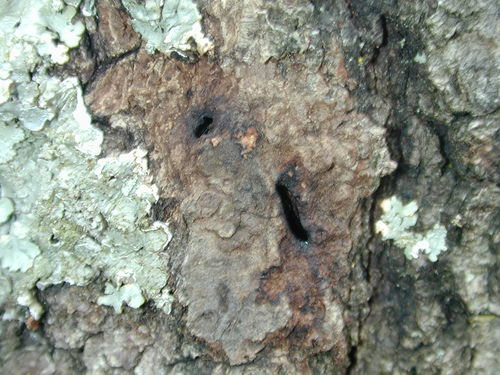
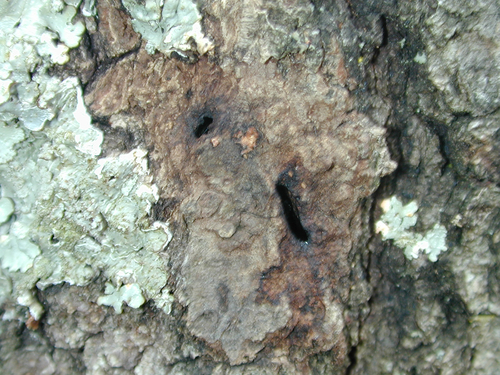
For the purposes of this study, “attack” was defined as the hole created as a larva ecloses from its egg case and bores through the outer bark to the phloem (Fig. 1). By this definition, attacks could be cumulative and potentially represent multiple E. rufulus generations. Previous literature (e.g., Fierke et al. Reference Fierke, Kinney, Salisbury, Crook and Stephen2005a; Haavik and Stephen Reference Haavik and Stephen2011) may refer to these entrance holes as attacks or to the phloem galleries created by first-year larvae. At the stand scale, certain site variables (e.g., density of northern red oak, topographic position, tree species richness and diversity) were important in determining E. rufulus impact (Fierke et al. Reference Fierke, Kelley and Stephen2007). Studies examining the spatial distribution of within-tree E. rufulus attacks found that adult females prefer to oviposit in the lower sections of the tree bole (Donley and Rast Reference Donley and Rast1984; Haavik and Stephen Reference Haavik and Stephen2011). However, these studies did not examine whether there was a spatial relationship between attack sites or larval development and the cardinal direction of the tree bole.
Enaphalodes rufulus larval attack holes are on a northern red oak, Quercus rubra, in the Ozark National Forest of Arkansas.
The examination of a unique data set collected during historically high populations of E. rufulus in Arkansas provides an opportunity to evaluate the within-tree spatial distribution of attacks relative to cardinal direction on sampled trees. While those outbreak conditions subsided by 2007 (Riggins et al. Reference Riggins, Galligan and Stephen2009), increased drought due to climate change may create future situations conducive to additional E. rufulus outbreaks (Haavik et al. Reference Haavik, Billings, Guldin and Stephen2015, Reference Haavik, Stephen, Fierke, Salisbury, Leavitt and Billings2008).
Our objective was to determine the spatial distribution of attack sites on trees infested by E. rufulus during outbreak years in Arkansas in relation to height on the tree bole and cardinal direction around the bole surface.
Materials and methods
Between January 2002 and May 2003, 50 trees were felled and destructively sampled across three locations in the Ozark National Forest of northern Arkansas (Fly Gap: 35.73642, −93.755744, n = 38; White Rock: 35.684897, −93.965141, n = 3; Oark: 35.714045, −93.544021, n = 9). Sample trees were selected based on the visible presence of E. rufulus, including emergence holes and/or symptoms of crown dieback (Fierke et al. Reference Fierke, Kinney, Salisbury, Crook and Stephen2005b). Due north was marked prior to felling, and later a north line was cut with a chainsaw along the length of the bole of each tree to enable subsequent determination of cardinal direction on all log samples (Fierke et al. Reference Fierke, Kinney, Salisbury, Crook and Stephen2005a).
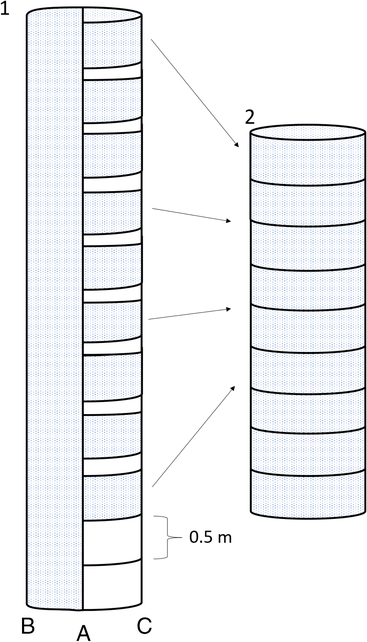
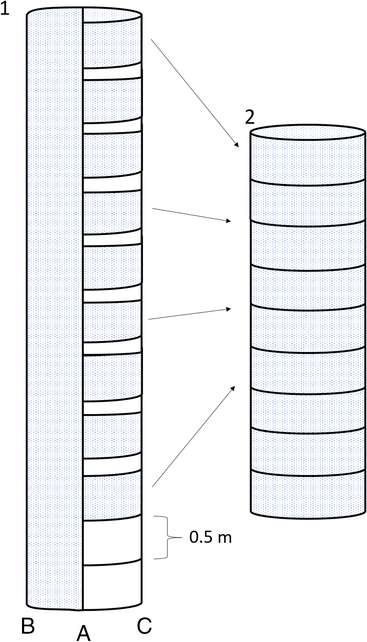
Trees were sampled using one of two methods: intensive whole-tree sampling (n = 14) or extensive partial-tree sampling (n = 36) (Fierke et al. Reference Fierke, Kinney, Salisbury, Crook and Stephen2005a; Crook et al. Reference Crook, Fierke, Mauromoustakos, Kinney and Stephen2007). Specifically, intensive whole-tree sampling involved counting and mapping all E. rufulus attacks across the entire length of the infested bole of a tree. Extensive partial-tree sampling involved counting and mapping attacks on nine, 0.5-m-long segments of the infested bole of a tree. The first sample unit of each extensively sampled tree was at approximately breast height, 1.5–2.0 m above the cut stump, which stood approximately 0.5 m off the ground. The remaining eight sections were sampled in 10% height increments along the length of the infested bole, from 10% to 90%, totalling 4.5 m of tree length. Extensive sampling was shown to be a statistically valid representation of whole-tree attacks (Fierke et al. Reference Fierke, Kinney, Salisbury, Crook and Stephen2005a). As described above, “attack” is defined in this manuscript as the entrance hole created in the outer bark when a larva successfully ecloses from its egg case and bores through bark to phloem. Data on multiple generations were not consistently collected across all sample trees; therefore, we were not able to evaluate individual generations. To control for variations in diameter and tree height, both measurements were standardised to be consistent across samples. The horizontal distance of each attack from the north line (run) was first converted to degrees around the circumference of the tree (i.e., N = 0°, S = 180°) and then divided by 360 to obtain a proportion from zero to one. The height of each attack along the length of the sample (rise) was standardised by dividing by the total height of the bole (intensive sampling) or by the total length of all samples (extensive sampling; 4.5 m) to obtain a proportion from zero to one (Fig. 2). Because extensive sampling only recorded attacks on specific sections of the infested tree bole, a portion of each tree was not sampled. Plotting attacks along the entire length of an extensively sampled tree would result in the appearance of no attacks on unsampled sections rather than the actual absence of data, and create artificial clustering. Attacks for all sampled trees totalled 48 140 across 50 trees, and attack densities were calculated for each sample tree. Age of sampled trees ranged from 50 to 105 years. Diameter at breast height for all sampled trees ranged from 18 to 49 cm, and height ranged from 14.5 to 30 m. Because attack sites were from previous generations and no insects were collected for this study, no voucher specimens were submitted.
Each half of tree “1” represents a whole tree. A chainsaw was used to cut a “north line” (A) into each tree. Intensively sampled trees (B) were dissected entirely, beginning at 0.5 m above ground. Extensively sampled trees (C) had nine, 0.5-m sections sampled, beginning at 1.5 m above ground, and continuing at 10% intervals along the length of the tree bole, totalling 4.5 m. To avoid artificial clustering, attacks were standardised along the combined length only of dissected samples (tree “2”).
Attacks were converted to a spatial point pattern, and complete spatial randomness with a homogenous Poisson process was tested using Ripley’s K function in the package “spatstat” in R (Baddeley et al. Reference Baddeley, Rubak and Turner2015). One hundred Monte Carlo simulations were performed to calculate envelopes of a theoretical complete spatial randomness distribution to which the observed distribution of attacks could be compared. Ripley’s K function is a descriptive statistic where
 $\hat{K}$
is calculated as:
 $$\hat K(r) = {\lambda ^{ - 1}}\sum\limits_{i \ne j} {{{I({d_{ij}} \prec t)} \over n}} $$
where d
ij
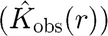
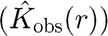
is equal to the Euclidean distance between the ith and jth points in the n dataset and r is the search radius. Because Ripley’s K is a descriptive statistic, no P-value is provided. Rather, the distances between the observed values
 $ (\hat{K}_{{\rm obs}}(r)) $
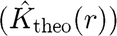
are compared to an envelope of theoretical distances calculated based on a complete spatial randomness homogenous Poisson process
 $ (\hat{K}_{{\rm theo}}(r)) $
. Values of
 $ (\hat{K}_{{\rm obs}}(r)) $
lying within the calculated envelopes indicate a complete spatial randomness distribution, while values lying above envelopes indicate a clustered distribution, and values lying below envelopes indicate a uniform distribution. The “density” function in R was used to visualise the distribution of attacks of both intensively and extensively sampled groups of trees by creating a kernel-smoothed function from a point pattern mapped across a standardised area of a tree bole. These analyses were completed initially on the extensively sampled trees. To test the validity of these analyses on the extensively sampled tree data set, the same analyses were performed on the intensively sampled trees. Within each sampling strategy, spatial distribution of attacks was analysed for low (extensive 0–3.9; intensive 0–8.9) and high (extensive 4–8; intensive 9–18) attack densities (attacks per m2).
Results
Across all trees, the number of attacks was on average 963 (± 133, SE) per tree and 193 per m2. Intensively sampled trees averaged 7 (± 2) attacks per m2 and extensively sampled trees averaged 3 (± 0.3) attacks per m2. Spatial distribution of attack sites does not vary among different levels of attack density. Both levels (low, high) were significantly clustered for both extensively and intensively sampled trees. Attacks typically occurred in the lower three-quarters of the tree bole, possibly due to the greater opportunity for oviposition sites in thicker bark or greater light intensity.
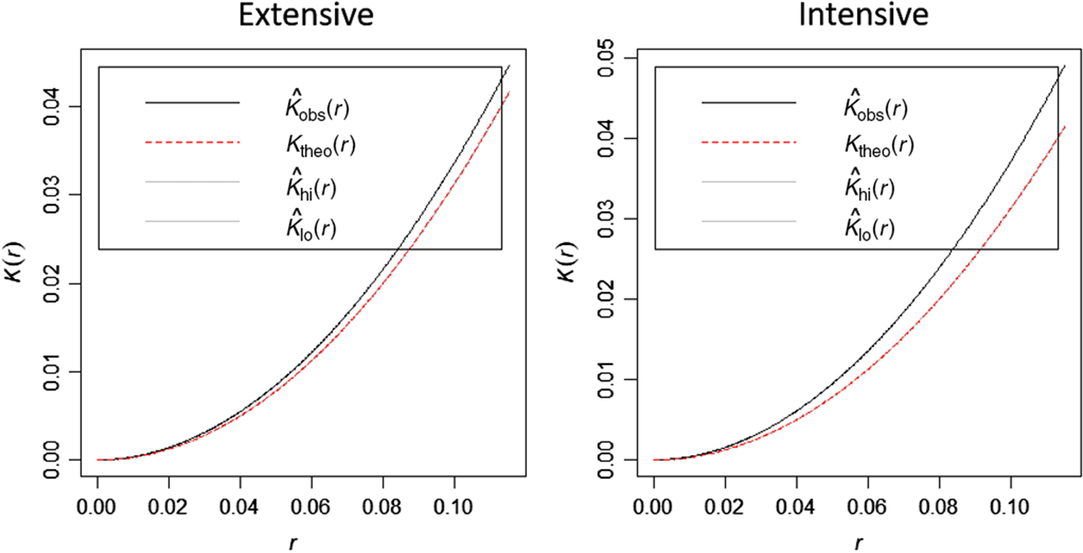
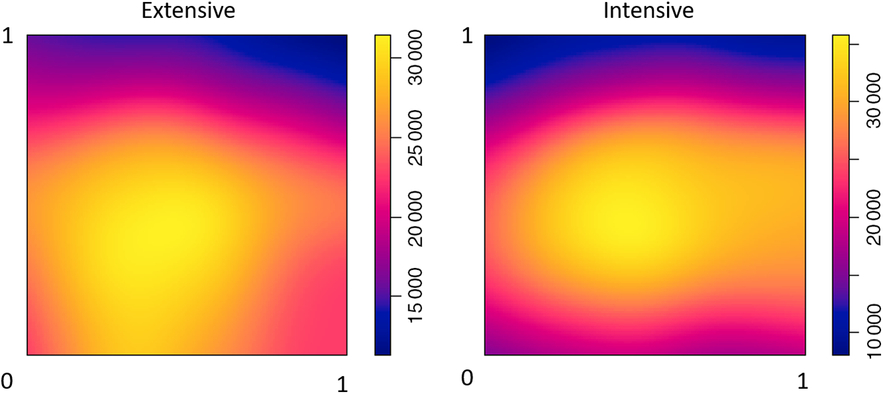
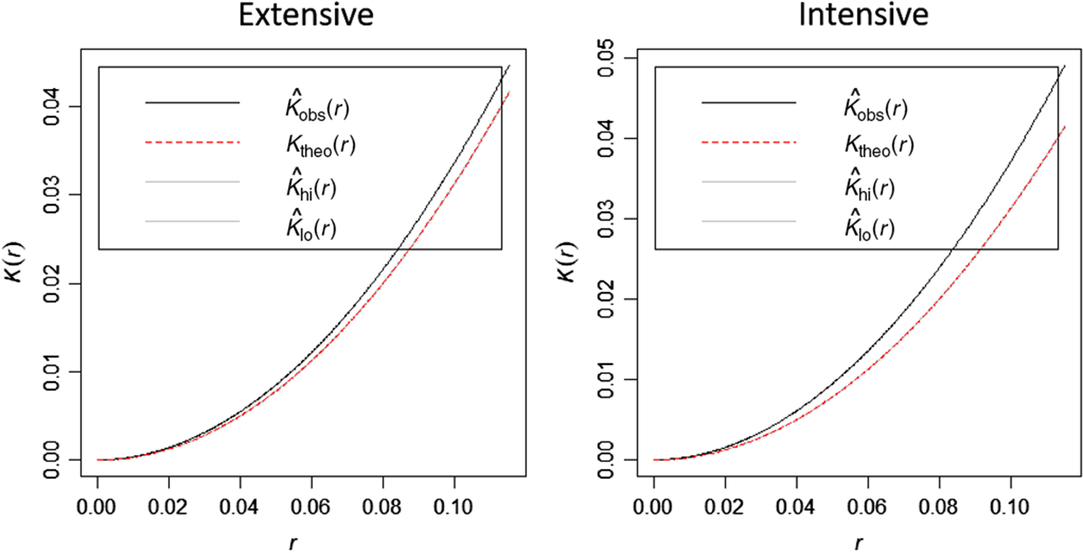
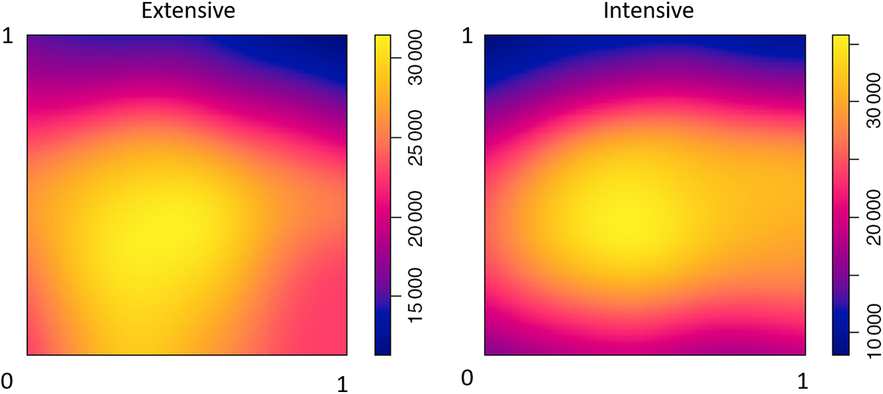
Attack distribution across both extensively and intensively sampled trees was significantly clustered, as evidenced by Ripley’s K function (Fig. 3). Using the same analyses as previously described, attack distribution for a randomly selected subsample of 10 trees was evaluated and confirmed as significantly clustered for all selected trees. Attacks were more likely to occur in the middle to lower part of the bole on the south-facing side of all trees as visualised by a kernel-smoothed point pattern. Extensively sampled trees, however, had more attacks towards the lower part of the tree bole (Fig. 4). Pattern of attacks was more variable among individual trees, but the overall pattern was consistent.
Ripley’s K test of extensively (n = 36, left) and intensively (n = 14, right) sampled trees. Observed Euclidean distance values
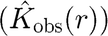 $ (\hat{K}_{{\rm obs}}(r)) $
of Enaphalodes rufulus attacks, as calculated in the methods section, lie above the theoretically derived expected values
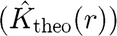 $ (\hat{K}_{{\rm theo}}(r)) $
. Due to a high sample size, the theoretical envelope depicted by
 $ (\hat{K}_{{\rm hi}}(r)) $
and
 $ (\hat{K}_{{\rm lo}}(r)) $
is small and tightly bound
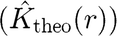 $ (\hat{K}_{{\rm theo}}(r)) $
, making it difficult to be seen. Because the observed values
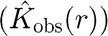 $ (\hat{K}_{{\rm obs}}(r)) $
lie above this theoretical envelope, the pattern indicates a clustered distribution of attacks within the sampled r search radius.
A kernel-smoothed intensity function of a point pattern created by standardising “rise” and “run” of extensively sampled attacks (n = 24 104; left) and intensively sampled attacks (n = 24 035; right) along the area of a standardised northern red oak tree bole. In this standardised plot, both side edges of the plot correspond to the north line of a sampled tree; the centre of the plot corresponds to the south line of a sampled tree; the bottom and top edges of the plot correspond to the base and crown, respectively, of a sampled tree. Cooler (blue) temperatures indicate lower density of attacks, and warmer (yellow) temperatures indicate higher density of attacks.
Discussion
The pattern of the majority of E. rufulus attacks occurring in the lower part of the bole is consistent with previous studies (Donley and Rast Reference Donley and Rast1984; Fierke and Stephen Reference Fierke and Stephen2010; Haavik and Stephen Reference Haavik and Stephen2011). Prior analyses on 15 northern red oaks also determined that there were no differences in cardinal direction of late-stage larval development, indicated by the presence of xylem scars (Fierke and Stephen Reference Fierke and Stephen2010), a finding that is not consistent with our current analysis of attack density. Although not measured in this study, differential mortality to developing larvae could explain why first instar density, but not late-stage larval development, was higher on the south-facing aspect of trees.
When considering the distribution of larval attacks on the south-facing side of oaks at middle to lower bole height, it is important to also consider mortality factors. While several insects and birds have been recorded as predators of E. rufulus larvae (Hay Reference Hay1972b; Galford Reference Galford1985; Muilenburg et al. Reference Muilenburg, Goggin, Hebert, Jia and Stephen2008), the majority of mortality measured in naturally attacked trees is caused by unknown factors. Cannabalism among E. rufulus larvae has been demonstrated in laboratory situations and contributed a significant amount of mortality (Ware and Stephen Reference Ware and Stephen2006). It is plausible that larvae in trees, particularly at high density, also show this behaviour, although this remains to be confirmed.
Buprestidae (Coleoptera) are known to respond to sunlight and warmth when selecting oviposition sites (e.g., Cárdenas and Gallardo Reference Cárdenas and Gallardo2013), and aggregated larval development on the south-facing side of hardwoods by other wood borers has been recorded (e.g., Timms et al. Reference Timms, Smith and de Groot2006). Agrilus biguttatus (Fabricius) (Coleoptera: Buprestidae) prefer to begin attacks on the south-facing side of declining oak trees, thereby inducing bark cracking and subcortical necrosis, expediting the decline process and potentially releasing additional volatiles that attract additional wood borers to that location (Vansteenkiste et al. Reference Vansteenkiste, Tirry, Van Acker and Stevens2004). Stress from E. rufulus attacks induces similar tree defences (Fierke and Stephen Reference Fierke and Stephen2008), and this stress could potentially make trees more attractive to other adults seeking an appropriate host. Stressed oaks are attractive to other oak-inhabiting wood-boring beetles such as Agrilis bilineatus (Weber) (e.g., Dunn et al. Reference Dunn, Kimmerer and Nordin1986), and plant volatiles are known as attractants to many insects (e.g., Dunn and Potter Reference Dunn and Potter1991; Pajares et al. Reference Pajares, Ibeas, Diez and Gallego2004). Enaphalodes rufulus adults, however, are not known to be attracted to host volatiles, and although males produce chemicals that are recognised as pheromone components for other Cerambycidae species, they have not been successful in attracting E. rufulus adults (Hanks and Millar Reference Hanks and Millar2016).
If E. rufulus females respond to oviposition by other females, it is possible that eggs laid earlier in the flight period may produce larvae that have more access to resources and are able to cannibalise later-arriving eggs and larvae. The idea of temporal resource partitioning has not been investigated for E. rufulus but has been established for oak-inhabiting wood borers outside the United States of America (e.g., Torres-Vila et al. Reference Torres-Vila, Zugasti- Martínez, Mendiola-Díaz, De-Juan-Murillo, Sánchez-González and Conejo-Rodríguez2017), and deserves further investigation as a potential natural population regulation mechanism.
Acknowledgements
The authors thank Dana Kinney, Vaughn Salisbury, Damon Crook, Melissa Fierke, Stephen Wingard, Josh Jones, Brent Kelley, Vanessa Muilenburg, Tracy Dahl, Leah Chapman, Megan Hardy, Jarrett Bates, Matt McCall, and Ricky Corder for field and laboratory assistance. We also thank J.M. Guldin for scientific advice and support. Laurel J. Haavik provided valuable comments on an earlier version of this manuscript. Funding for this research was provided by the University of Arkansas Agricultural Experiment Station, and grants from the United States Department of Agriculture Forest Service.