Introduction
The term ‘charge regulation’ generally describes how the charge state of a poly-protic molecule is changed when approached by alien molecular matter. For example, when a protein comes into close proximity of a lipid membrane, the protonation state (and consequently the charge distribution) changes in order to lower the free energy. The origin of the mechanism is due to protons that migrate to and from titratable sites, thereby enabling the molecule to adapt to changing chemical environments.
Charge regulation was described already in the 1920s by Linderstrøm-Lang at the Carlsberg breweries (Gitlin et al. Reference Gitlin, Carbeck and Whitesides2006; Linderstrøm-Lang, Reference Linderstrøm-Lang1924) and Kirkwood and Shumaker later used statistical mechanical perturbation theory to show how correlations between the charge distributions of two proteins lead to attractive intermolecular interactions (Kirkwood & Shumaker, Reference Kirkwood and Shumaker1952a). This theoretical prediction of so-called fluctuation forces was later elegantly verified using light scattering (Timasheff et al. Reference Timasheff, Dintzis, Kirkwood and Coleman1955). Since then there has been a range of studies addressing charge regulation for protein–protein interactions (Aguilar et al. Reference Aguilar, Anandakrishnan, Ruscio and Onufriev2010; Elcock & Mc-Cammon, Reference Elcock and Mccammon2001; Grant, Reference Grant2001; Kirkwood & Shumaker, Reference Kirkwood and Shumaker1952b; Lund & Jönsson, Reference Lund and Jönsson2005; Mason & Jensen, Reference Mason and Jensen2008; Phillies, Reference Phillies1974), protein–surface interactions (Biesheuvel & Wittemann, Reference Biesheuvel and Wittemann2005; Biesheuvel et al. Reference Biesheuvel, Van Der Veen and Norde2005; Hartvig et al. Reference Hartvig, Van De Weert, Ostergaard, Jorgensen and Jensen2011; Lund et al. Reference Lund, Åkesson and Jönsson2005; Shen & Frey, Reference Shen and Frey2005; Ståhlberg & Jönsson, Reference Ståhlberg and Jönsson1996; Sukhishvili & Granick, Reference Sukhishvili and Granick2003; Tsao, Reference Tsao2000), polyelectrolytes (Biesheuvel & Wittemann, Reference Biesheuvel and Wittemann2005; da Silva et al. Reference Da Silva, Lund, Jönsson and Åkesson2006; Gong et al. Reference Gong, Genzer and Szleifer2007; de Vos et al. Reference De Vos, Leermakers, De Keizer, Cohen Stuart and Kleijn2010; Shubin & Linse, Reference Shubin and Linse1997; Ullner et al. Reference Ullner, Jönsson and Widmark1994), charge ladders (Gitlin et al. Reference Gitlin, Mayer and Whitesides2003, Reference Gitlin, Carbeck and Whitesides2006; Menon & Zydney, Reference Menon and Zydney2000; Sharma et al. Reference Sharma, Negin and Carbeck2003) and surface interactions (Biesheuvel, Reference Biesheuvel2001; Boon & van Roij, Reference Boon and Van Roij2011; Borkovec & Behrens, Reference Borkovec and Behrens2008; Carnie, Reference Carnie1993; Chan & Pashley, Reference Chan and Pashley1980; Dan, Reference Dan2002; Keh & Li, Reference Keh and Li2007; Ninham & Parsegian, Reference Ninham and Parsegian1971; Popa et al. Reference Popa, Sinha, Finessi, Maroni, Papastavrou and Borkovec2010). While charge regulation is most often ascribed to proton equilibria, any binding ion may contribute to charge fluctuations (Kurut & Lund, Reference Kurut and Lund2012). Despite the generic nature of the charge regulation mechanism, it is rarely – though with some notable exceptions (Hill, Reference Hill1956; Tanford, Reference Tanford1961; Wyman & Gill, Reference Wyman and Gill1990) – mentioned in text books on physical chemistry. In this text, we give a molecular overview of the mechanism, including tools to predict why and when it becomes important.
The charge regulation mechanism
Phenomenological description
Proteins and a range of other macromolecules contain acidic and basic residues that – depending on solution conditions – can be either protonated or de-protonated. This gives the molecule an often complex electric charge distribution that in turn affects interactions with other molecular matter. To phenomenologically describe the charge regulation mechanism, consider first the equilibrium process of a single ionizable site,
 $${\rm HA} \rightleftharpoons {\rm H}^{ \plus } \plus {\rm A}^{ \minus }. $$
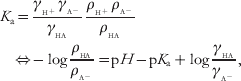
The corresponding equilibrium constant is
 $$\eqalign{ K_{\rm a} \equals \tab {{\gamma _{_{{{\rm H}^{ \plus } }} } \gamma _{_{{{\rm A}^{ \minus } }} } } \over {\gamma _{_{{{\rm HA}}} } }}{{\rho _{_{{{\rm H}^{ \plus } }} } \rho _{_{{{\rm A}^{ \minus } }} } } \over {\rho _{_{{{\rm HA}}} } }} \cr \Leftrightarrow\tab \minus \log {{\rho _{_{{{\rm HA}}} } } \over {\rho _{_{{{\rm A}^{ \minus } }} } }} \equals {\rm p}H \minus {\rm p}K_{{\rm a}} \plus \log {{\gamma _{_{{{\rm HA}}} } } \over {\gamma _{_{{{\rm A}^{ \minus } }} } }}\comma \cr} $$
where ρ are average concentrations and γ are activity coefficients that take into account excess interactions not accounted for in the reference state (typically infinite dilution). Due to thermal motion, protons migrate to and from the site and the fraction ρHA/ρA− directly defines the average charge state of the site. To introduce charge regulation let us now consider the situation where pH equals pK a. At this condition, it is clear from Eq. (2) that the average charge state is determined solely by the activity coefficients. As γ accounts for interactions with other solutes, it consequently changes when the site moves into close proximity of other molecules. At equilibrium, the chemical potential or activity, ai=ρiγi must be constant throughout the medium and if the activity factor changes, so must the concentration. Thus, one could re-write Eq. (2) in terms of ρ(R) and γ(R), where R is a spatial coordinate describing the microscopic position of the site, relative to another molecule.
Statistical mechanical description
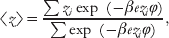
It was shown above how the charge regulation mechanism can be explained from basic thermodynamic arguments and we now take a slightly more microscopic route. Consider again a single titratable site that can be either protonated or de-protonated and is exposed to an external electric potential, ϕ, due to all other charges in the system. The canonical ensemble average for the charge, z, then becomes,
 $$\langle z\rangle \equals {{\sum {z_{i} \exp {\rm \ }\lpar \minus \beta ez_{i} \varphi \rpar } } \over {\sum {\exp {\rm \ }\lpar \minus \beta ez_{i} \varphi \rpar } }},$$
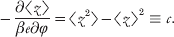
where β=1/kT is the inverse thermal energy, e is the electron unit charge and the sums run over all possible charge states. This expectation value for the charge is equivalent to the average charge discussed in the previous section and it is clear that any change in the external potential, i.e. chemical environment, will influence 〈z〉. Perturbing the system with a small change in ϕ we immediately get that
 $$ \minus {{\partial \langle z\rangle } \over {\beta e\partial \varphi }} \equals \langle z^{\setnum{2}} \rangle \minus \langle z\rangle ^{\setnum{2}} \equiv c.$$
Here we introduce the capacitance, c, which is simply the variance of the mean charge and a measure of how much charge can be induced upon exposure to an external electric potential. An identical analysis can be made for the total charge of a macromolecule. Equation (4) is a typical example of linear response where the capacitance is the response function to an external perturbation of the system (Fornés, Reference Fornés2000; Kubo, Reference Kubo1966).
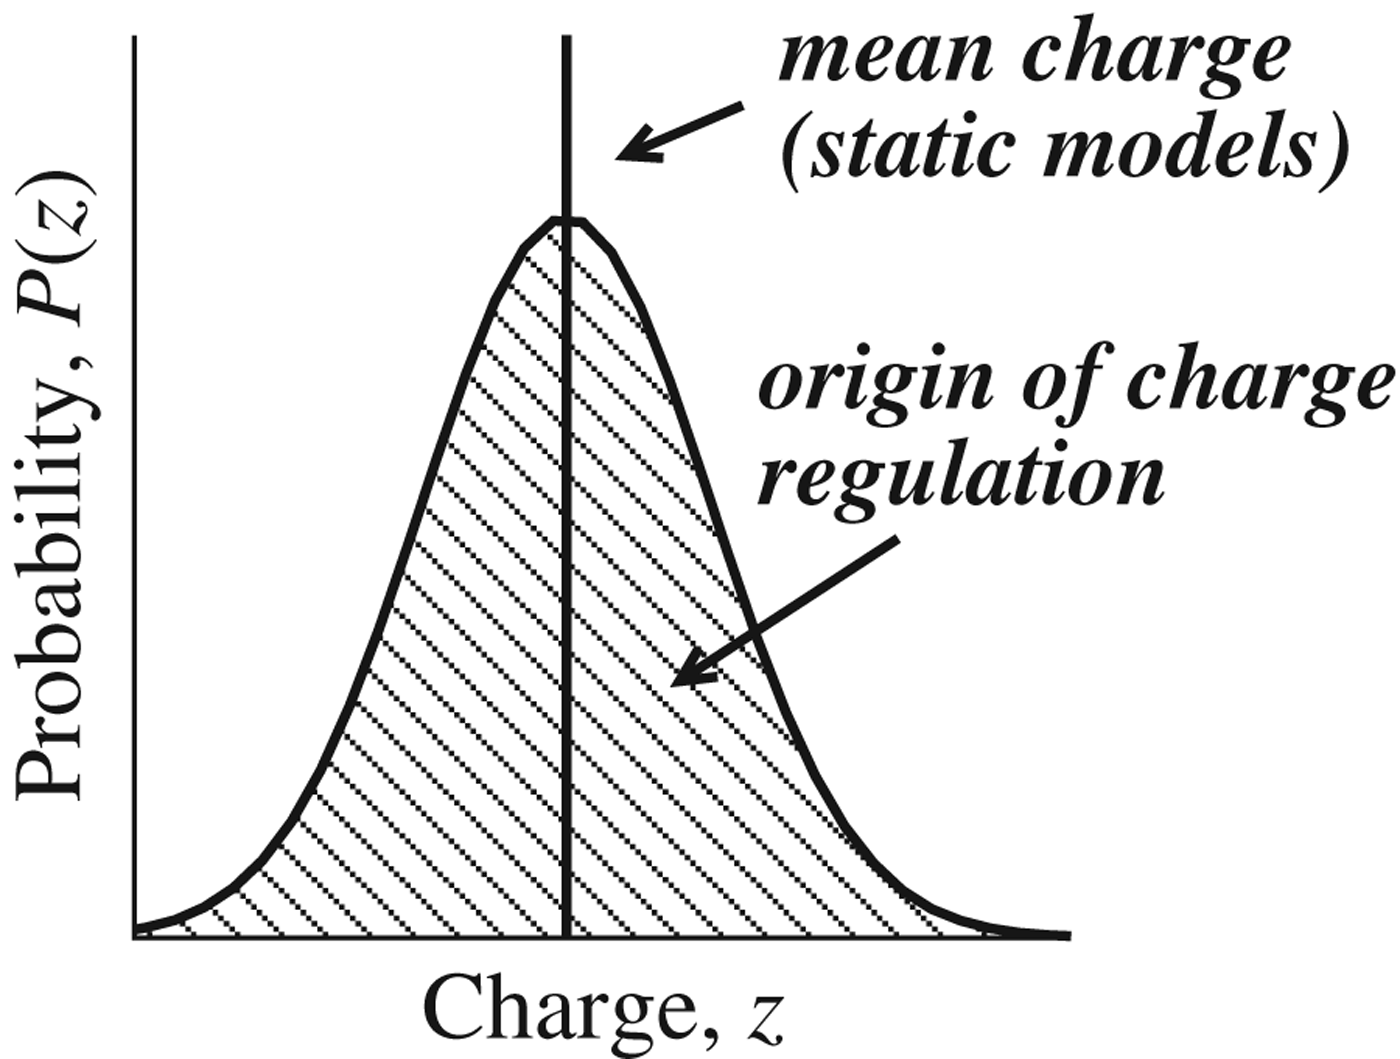
While in most text books a titratable site is characterized solely by its average charge, it is commonly left unsaid that there is a distribution around it as illustrated in Fig. 1. This is unfortunate as it is exactly this distribution – and the possibility to disturb it – that gives rise to the charge regulation mechanism.
In addition to the average charge, 〈z〉, a titratable site also has a variance, c, around the mean. The distribution – often well described by a normal distribution – is the origin of the charge regulation mechanism.

Relation to proton titration curve
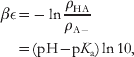
Consider the acid dissociation constant given by Eq. (2). Assuming unity activity coefficients, the free energy difference, βε, between the protonated and de-protonated form is (Sassi et al. Reference Sassi, Beltran, Hooper, Blanch, Prausnitz and Siegel1992; Ullner et al. Reference Ullner, Jönsson and Widmark1994)
 $$\eqalign{ \beta \epsilon \equals \tab \minus \ln{{\rho _{{\rm HA}} } \over {\rho _{{\rm A} \minus } }} \cr \equals \tab \lpar {\rm pH} \minus {\rm p}K_{\rm a} \rpar \ln 10\comma \cr} $$
which we use to set up a microscopic two-state system for a single, titratable site where z H is the valency of the titrant (+1 for protons). Defining the de-protonated state as the ground state, ε0=0, we write a molecular partition function and two ensemble averages,
 $$q \equals \sum\limits_{i} {{\rm e}^{ \minus \beta \epsilon _{i} } } \equals 1 \plus {\rm e}^{ \minus \lpar {\rm pH} \minus {\rm p}K_{{\rm a}} \rpar \ln{\setnum{10}}} {\rm \comma }$$
 $$\langle z\rangle \equals {{z_{\setnum{0}} \plus \lpar z_{\setnum{0}} \plus z_{\rm H} \rpar {\rm e}^{ \minus \lpar {\rm pH} \minus {\rm p}K_{{\rm a}} \rpar \ln{\setnum{10}}} } \over q}\comma $$
 $$\langle z^{\setnum{2}} \rangle \equals {{z_{\setnum{0}}^{\setnum{2}} \plus \lpar z_{\setnum{0}} \plus z_{\rm H} \rpar ^{\setnum{2}} {\rm e}^{ \minus \lpar {\rm pH} \minus {\rm p}K_{{\rm a}} \rpar \ln{\setnum{10}}} } \over q}.$$
We can now give expressions for charge fluctuations,
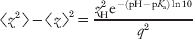 $$\langle z^{\setnum{2}} \rangle \minus \langle z\rangle ^{\setnum{2}} \equals {{z_{\rm H}^{\setnum{2}} {\rm e}^{ \minus \lpar {\rm pH} \minus {\rm p}K_{{\rm a}} \rpar \ln{\setnum{10}}} } \over {q^{\setnum{2}} }}$$
as well as the charge response function to a small pH perturbation,
 $${{\partial \langle z\rangle } \over {\partial {\rm pH}}} \equals \minus {{z_{\rm H} {\rm e}^{ \minus \lpar {\rm pH} \minus {\rm p}K_{{\rm a}} \rpar \ln{ \setnum{10}}} } \over {q^{\setnum{2}} }}\ln{10}.$$
Combining (9) and (10) it follows that,
 $$\langle z^{\setnum{2}} \rangle \minus \langle z\rangle ^{\setnum{2}} \equals \minus {{z_{\rm H} } \over {\ln10}}{{\partial \langle z\rangle } \over {\partial {\rm pH}}} \equiv c, $$
where c is the same charge capacitance as obtained in Eq. (4). Again, this result can be generalized to the total charge number of a macromolecule, Z=Σzi, related to the molecular capacitance,
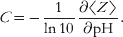 $$C \equals \minus {1 \over {\ln10}}{{\partial \langle Z\rangle } \over {\partial {\rm pH}}}.$$
More on this in the following sections. Note that what we here denote ‘capacitance’ – due to the relation in Eq. (4) – is related to the ‘binding capacity’ used by (Wyman & Gill, Reference Wyman and Gill1990).
Relation to intermolecular interactions
An aqueous solution containing biological molecules can in a general sense be described as an electrolyte solution as it contains simple ions such as Na+, K+, Cl−, etc. as well as macromolecules with a net charge significantly different from unity. DNA, proteins and polysaccharides are important examples of the latter. At low salt concentration, the interaction of these macromolecules is dominated by a direct Coulomb interaction, but when the macromolecular charge is close to zero other non-intuitive interaction terms start to play important roles. It is our intention to discuss the interaction/stability of biological macromolecules in a few generic situations where attractive electrostatic interactions besides the direct ion–ion term are of significance. As shown above, the protonation state of a titratable site depends on the nearby chemical environment and, consequently, electrostatic forces may change when two biomolecules come into close proximity of each other. This ‘induced’ interaction can be formalized in a statistical mechanical perturbation approach (Kirkwood & Shumaker, Reference Kirkwood and Shumaker1952a; Lund & Jönsson, Reference Lund and Jönsson2005) and a protein is characterized not only by its average charge distribution, e.g. net charge, dipole moment etc., but also – as shown below – by the charge capacitance introduced above.
Consider two macromolecules A and B, described by two charge distributions [ri,zi] and [rj,zj], respectively. Their mass centra are separated by R, which means that the distance between two charges i and j is rij=| R+rj−ri|. The average net charge of the distributions need not be zero, that is 〈ZA〉=〈Σzi〉≠0. The free energy of interaction can be written as,
 $$\eqalign{ \beta A\lpar R\rpar \equals \tab \minus \ln\langle\exp \lpar \minus \beta U\lpar R\rpar \rpar\rangle _{\setnum{0}} \cr \approx \tab \langle\beta U\lpar R\rpar\rangle_{\setnum{0}} \minus \textstyle{1 \over 2}\langle \lpar \beta U\lpar R\rpar \rpar ^{\setnum{2}} \rangle _{\setnum{0}} \plus {1 \over 2}\lsqb\langle \beta U\lpar R\rpar \rangle_{\setnum{0}} \plus {1 \over 2}\langle \lpar \beta U\lpar R\rpar \rpar ^{\setnum{2}} \rangle _{\setnum{0}} \rsqb ^{\setnum{2}} \comma \cr} $$
where U(R) is the interaction between the two charge distributions and 〈 … 〉0 denotes an average over the unperturbed system, which in the present case are the two macromolecules at infinite separation in solution. If we for simplicity assume that the interactions are unscreened, that is, the salt concentration is low, then the interaction energy is simply the direct Coulomb interaction between the two charge distributions,
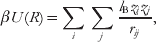 $$\beta U\lpar R\rpar \equals \mathop \sum \limits_{i} \mathop \sum \limits_{j} {{l_{\rm B} z_{i} z_{j} } \over {r_{ij} }}\comma $$
where l B=βe 2/4π∊0∊r is the Bjerrum length which in an aqueous solution at room temperature is approximately 7·1 Å. Assuming that R≫ri, a Taylor series expansion of U(R) yields an estimate of the free energy decomposed into multipolar terms: ion–ion, ion–dipole and dipole–dipole as well as terms stemming from charge induction. Note that the ion–dipole interaction disappears in first order and that the first non-vanishing dipole term, βA ion−dip=−l B2Z 2μ2/6R 4 is of order 1/R 4. We now write an approximation to the free energy including all terms of order up to 1/R 2:
 $$\eqalign{ \beta A\lpar R\rpar \approx \tab \overbrace {{{l_{\rm B} \langle Z_{\rm A} \rangle \langle Z_{\rm B} \rangle } \over R}}^{{\rm ion} \minus {\rm ion}} \minus \overbrace {{{l_{\rm B}^{\setnum{2}} } \over {2R^{\setnum{2}} }}\left( {\langle Z_{\rm A} \rangle ^{\setnum{2}} C_{\rm B} \plus \langle Z_{\rm B} \rangle ^{\setnum{2}} C_{\rm A} } \right)}^{{\rm ion} \minus {\rm induced}\,{\rm ion}} \minus \underbrace {{{l_{\rm B}^{\setnum{2}} } \over {2R^{\setnum{2}} }}\left( {C_{\rm A} C_{\rm B} } \right)}_{{\rm induced} \minus {\rm induced}}\comma \cr} $$
where we have identified the molecular protein charge capacitance as
 $$C \equals \langle Z^{\setnum{2}} \rangle \minus \langle Z\rangle ^{\setnum{2}} \comma $$
which is non-zero for molecules with titratable sites. The first term in Eq. (15) is the direct Coulomb term and the following terms are the charge–induced charge and induced charge–induced charge interactions. For identical molecules, 〈ZA〉=〈ZB〉=〈Z〉, the expression simplifies to
 $$\beta A\lpar R\rpar \approx {{l_{\rm B} \langle Z\rangle ^{\setnum{2}} } \over R} \minus {{l_{\rm B}^{\setnum{2}} } \over {2R^{\setnum{2}} }}\left( {2C\langle Z\rangle ^{\setnum{2}} \plus C^{\setnum{2}} } \right)\comma$$
and if pH equals pI, then 〈Z〉=0 and the induced charge–induced charge interaction becomes the leading term
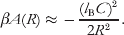 $$\beta A\lpar R\rpar \approx \minus {{\lpar l_{\rm B} C\rpar ^{\setnum{2}} } \over {2R^{\setnum{2}} }}.$$
The above equations show that the fluctuating charge of a protein or macromolecule may under certain circumstances contribute significantly to the net interaction. We have already shown that the capacitance is related to a small change in an imposed external potential, ϕ, which can be used to estimate the amount of induced charge
 $$C \equals \minus {{\partial \langle Z\rangle } \over {\beta e\partial \varphi }} \Rightarrow {\rm \rmDelta }Z \equals \minus \beta e{\rm \rmDelta }\varphi .$$
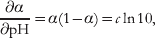
The capacitance, C, can also be derived from the experimental titration curve – see Eq. (12). For a single titrating acid the ionization degree, α, can be found in any elementary physical chemistry textbook,
 $$\log K \equals \minus {\rm pH} \plus \log {\alpha \over {1 \minus \alpha }}$$
and taking the derivative of α with respect to pH gives,
 $${{\partial \alpha } \over {\partial {\rm pH}}} \equals \alpha \lpar 1 \minus \alpha \rpar \equals c\ln 10{\rm \comma }$$
where in the second step we have identified the capacitance defined in Eq. (11). We can obtain an approximate value for the capacitance in a protein assuming that there is no interaction between the titrating sites. A protein contains several titrating groups like aspartic and glutamic acid, histidine etc., each with an ideal pK value. Denoting different titrating groups with k and their number with nk, the total capacitance can be approximated with
 $$C^{{\rm ideal}} \equals {1 \over {\ln 10}}\mathop \sum \limits_{k} n_{k} {{10^{{\rm pH} \minus {\rm p}K_{k} } } \over {\lpar 1 \plus 10^{{\rm pH} \minus {\rm p}K_{k} } \rpar ^{\setnum{2}} }} \equals \minus {1 \over {\ln10}}{{\partial \langle Z\rangle } \over {\partial {\rm pH}}}.$$
The magnitude of charge regulation is dependent on the system and is usually of the order of kT or less for two identical proteins at contact. However, the charge regulation can dominate over the direct Coulombic repulsion term if the capacitance is sufficiently large or when one of the macromolecules are at its iso-electric point. Consider two identical proteins,
 $$\beta A\lpar R\rpar \approx {{l_{\rm B} \langle Z\rangle ^{\setnum{2}} } \over R} \minus {{l_{\rm B}^{\setnum{2}} C\langle Z\rangle ^{\setnum{2}} } \over {R^{\setnum{2}} }} \equals {{l_{\rm B} \langle Z\rangle ^{\setnum{2}} } \over R}\left[ {1 \minus {{l_{\rm B} C} \over R}} \right].$$
The free energy of interaction will be less than zero whenever R<l BC (neglecting the C 2 term). For most medium-sized proteins, the capacitance is typically of order unity, while the minimum center-to-center distance is of the order of 30–40 Å, which means that the direct ion–ion repulsion dominates. Still, for a protein sufficiently rich in acidic or basic residues, the capacitance is larger than unity and one can imagine a situation where the charge regulation term dominates at contact. Note also that C increases linearly with the number of amino acid residues, while the protein size, R p, only increases like N 1/ 3 and for a sufficiently large protein the charge regulation may dominate at certain pH values. This is of course somewhat speculative, since we have neglected the effect of salt screening.
Charge regulation in biomolecules
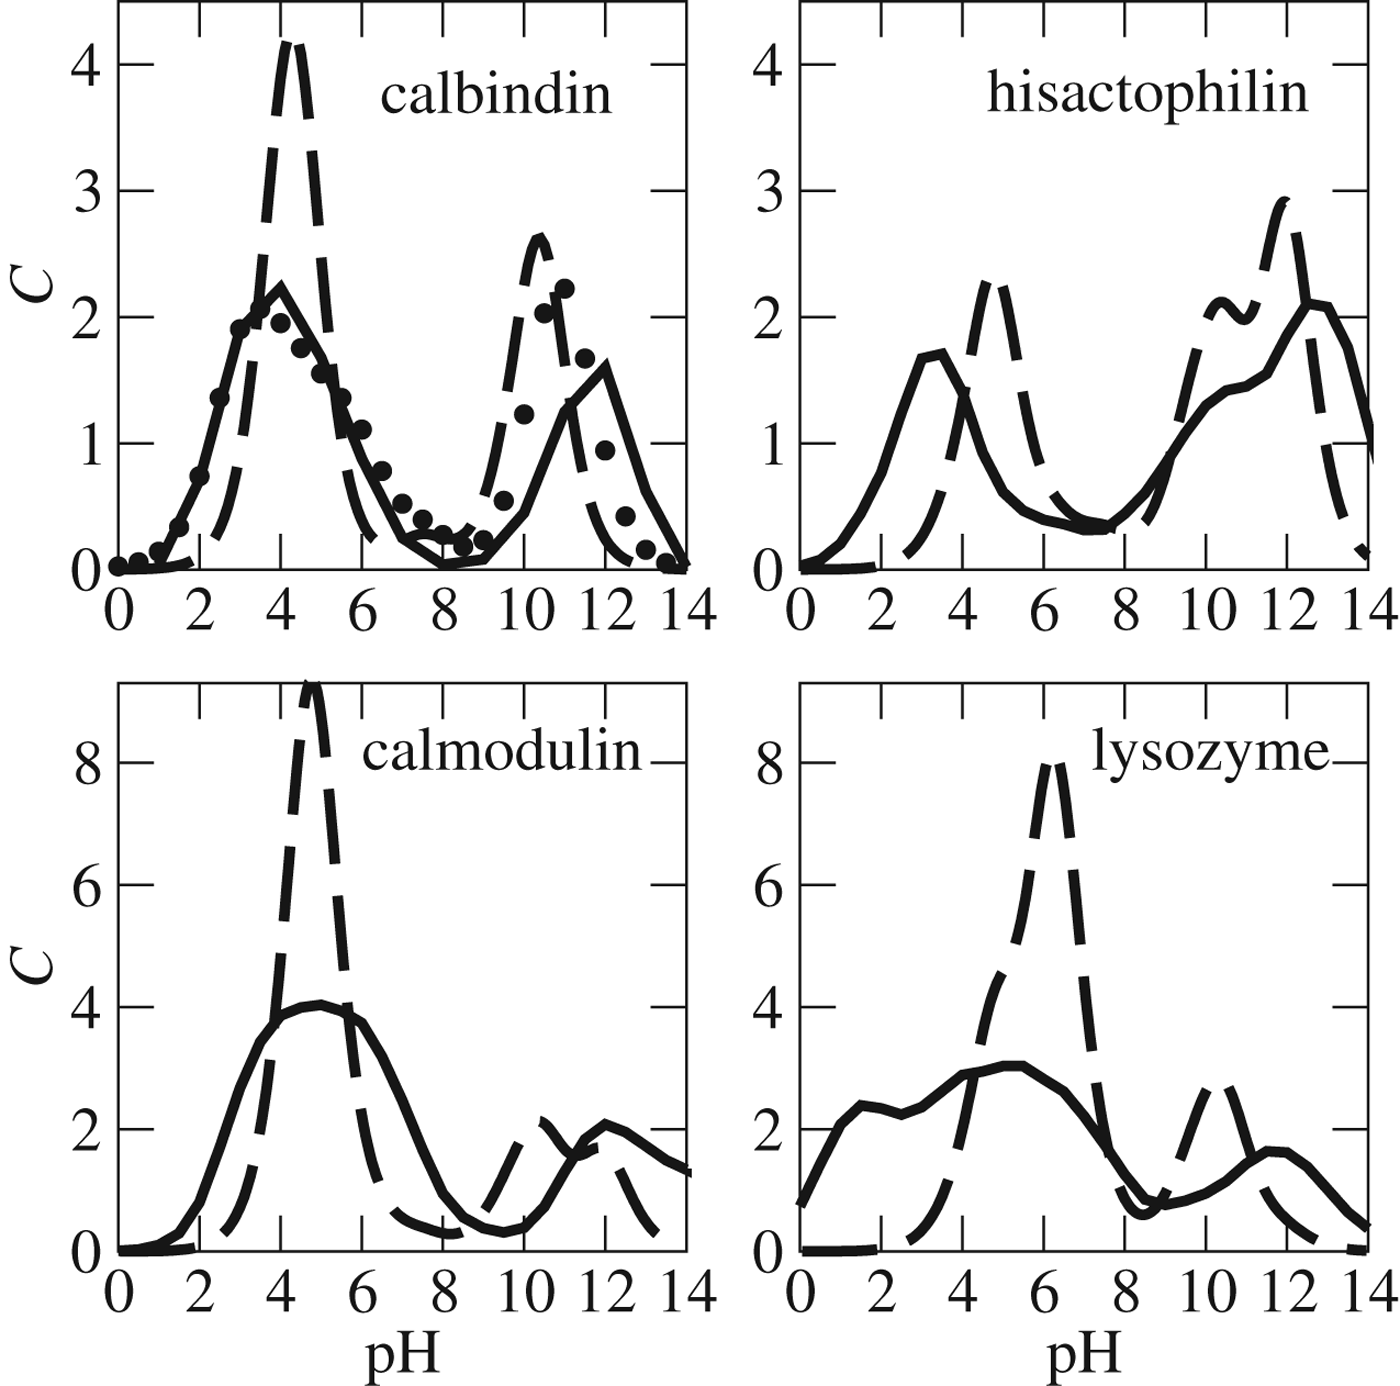
The capacitance, C, is the key parameter for charge regulation and we have calculated it for a number of proteins with different characteristics in terms of number and type of residues – see Fig. 2. To account for internal electrostatic interactions, a MC simulation (or other methods; Baker et al. Reference Baker, Sept, Joseph, Holst and Mccammon2001; Mason & Jensen, Reference Mason and Jensen2008) has to be performed at each pH at a given salt and protein concentration. The main difference from the ideal capacitance curve – i.e. when interactions are ignored – is a strong broadening of two peaks corresponding to the response from acidic and basic residues, respectively. If the protein has a significant net charge, the true curve shifts away from the ideal one, as is seen for calbindin at high pH.
Capacitances, C, as a function of pH for four different proteins in aqueous solutions with 30 mM 1:1 salt. Shown for simulated (fully drawn), ideal (dashed) and experimental data where available (symbols).
The protein hisactophilin is of the same size as calbindin, but it has a very different capacitance curve. Hisactophilin is a histidine-rich protein (HRP), which is reflected in a capacitance maximum for pH 5–6. The downward shift of the maximum compared with the ideal curve is due to the high positive charge of hisactophilin at low pH (+23e at pH 4).
The calcium-binding protein calmodulin is more charged than calbindin and as a consequence it also shows broader capacitance peaks. The capacitance is not particularly sensitive to the details of the atomic structure and if one models calmodulin with a set of spheres each representing only the titratable residues, the capacitance curve is virtually identical to the one from an atomistic model (Lund & Jönsson, Reference Lund and Jönsson2005).
In the following, we will go through a number of examples where charge regulation becomes important.
Protein–protein interactions
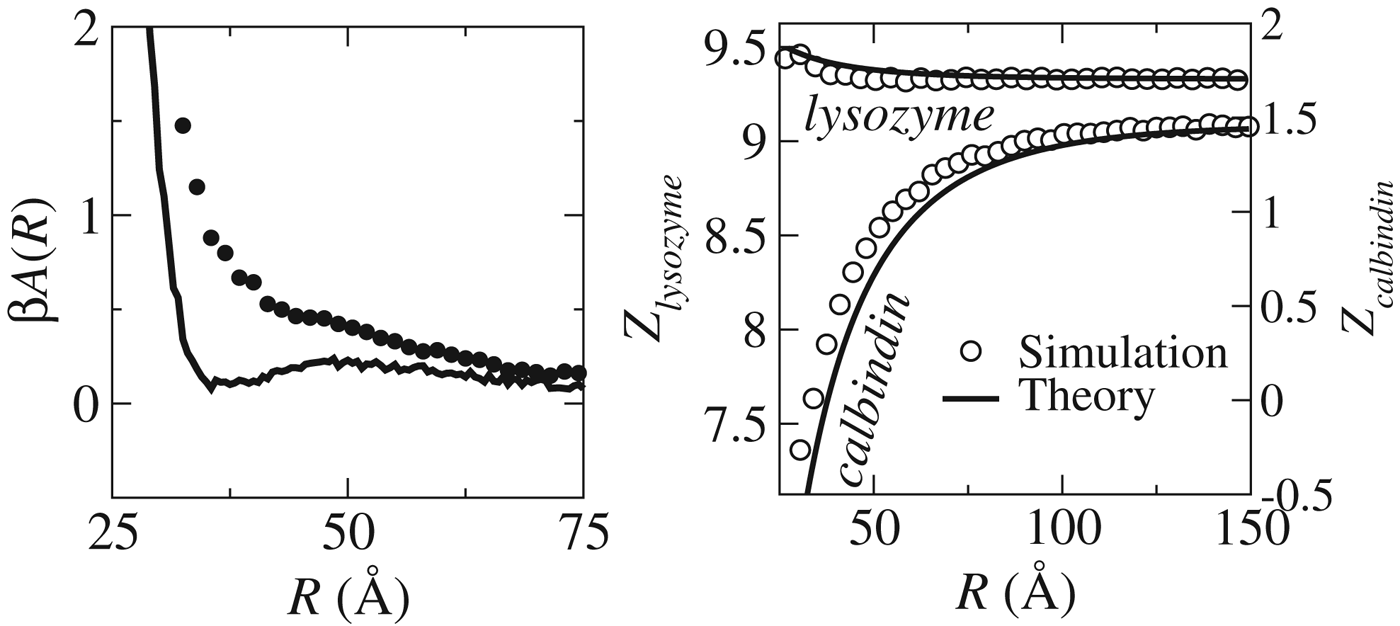
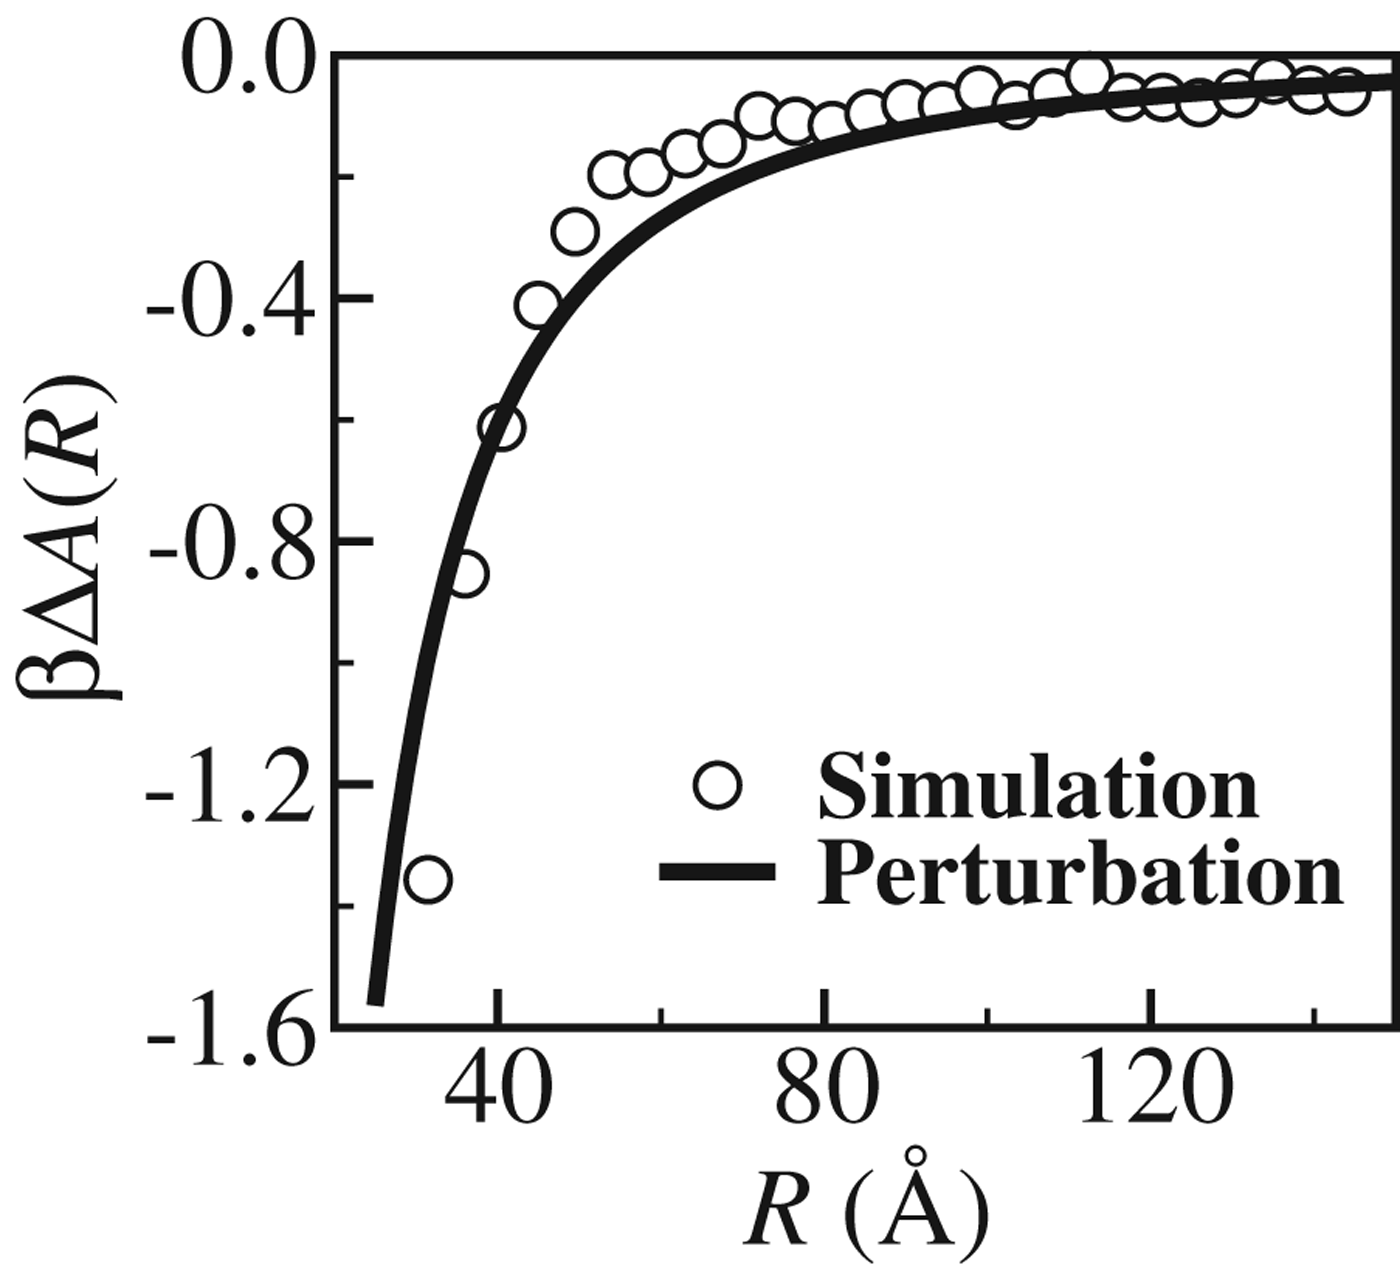
In an elegant light-scattering study of salt-free bovine albumin solutions, Timasheff and co-workers verified early theoretical predictions that attractive interactions between proteins arise due to proton fluctuations (Kirkwood & Shumaker, Reference Kirkwood and Shumaker1952a; Timasheff et al. Reference Timasheff, Dintzis, Kirkwood and Coleman1955). Today, the free energy of interaction – or potential of mean force (PMF) – between protein pairs can be calculated using computer simulations and, by turning proton fluctuations either on or off, the contribution from charge regulation can be quantified. As shown in Fig. 3, left for the interaction between the fictitious calbindin–lysozyme pair, there is a significant difference between the fluctuating and non-fluctuating charge models (Lund & Jönsson, Reference Lund and Jönsson2005). At large separations both proteins are positively charged (Fig. 3), but as they approach, their average charges change – and much more so for calbindin than for lysozyme. Using the capacitance framework from the previous section this difference can readily be explained by noting that, at pH 4, lysozyme has a large charge and a small capacitance, while the opposite is true for calbindin (see Fig. 2). Knowing the net charges and capacitances for the two proteins – either from experiment or calculations – the regulation free energy and induced charges can be estimated from Eqs. (15) and (19), respectively. As evident from Figs 3, right and 4, excellent agreement is obtained between exact simulation results and the approximative perturbation theory.
Left: Free energy of interaction, A(R), between calbindin and lysozyme at pH 4 for a protein model with fixed charges (dashed lines) and one with charge regulation (solid lines). R is the mass-center separation. Right: the variation of net charge of calbindin and lysozyme as a function of their separation. pH is 4 and the 1:1 salt concentration is 5 mM. See Lund & Jönsson (Reference Lund and Jönsson2005) for more details.
The difference in free energy of interaction between calbindin and lysozyme at pH 4 for a protein model with regulation and one with fixed charges. R is the separation between the mass centra of the two proteins and symbols denote the simulated difference and the solid line is obtained from Eq. (15) with Z calb=1·16, C calb=2·23, Z lys=10·2 and C lys=0·88.
An important message is that despite the fact that both calbindin and lysozyme are positively charged at pH 4, there is still an attractive electrostatic interaction between the two. We come back to this issue when discussing protein polyelectrolyte complexation.
Ligand binding
Binding of a ligand to a protein is often accompanied by charge regulation (Aguilar et al. Reference Aguilar, Anandakrishnan, Ruscio and Onufriev2010; Di Cera, Reference Di Cera1991; Linse et al. Reference Linse, Helmersson and Forsen1991; Svensson et al. Reference Svensson, Jönsson, Thulin and Woodward1993). Let us take two examples: binding of four calcium ions to calmodulin and the binding of a short cationic (+7e) peptide to calmodulin. Calmodulin has 43 acidic and 16 basic residues, where the latter are all charged for pH<10. Figure 5 shows the number of protons dissociated from calmodulin upon calcium binding. At low pH it closely reflects the calmodulin capacitance, while at basic pH values the co-variation of the release of protons and the capacitance is less pronounced. This is because the acidic groups titrating at low pH are closer in space to the four calcium-binding sites than the basic residues. One can note that at pH 4, the binding of four Ca2+ with a total charge of +8e gives rise to the release of almost eight protons. The binding of the heptavalent peptide shows the same pattern, although the proton release is slightly weaker. This is understandable from the fact that calmodulin already binds four divalent calcium ions. Again the proton release closely follows the variation of the capacitance.
Number of protons, #H, released in calmodulin (CaM) upon binding of four calcium ions (black solid line) and upon binding a heptavalent peptide (dashed red line) as a function of pH. The black solid line with symbols shows the capacitance, C, for CaM without calcium ions and red dashed line with symbols shows the capacitance for CaM with four calcium ions bound.
At this stage, we should point out that charge regulation phenomena associated with ligand binding to proteins have been extensively covered within the thermodynamic linkage framework developed by Wyman & Gill (Reference Wyman and Gill1990). While we have here taken a statistical mechanical view point and focus on regulation effects on intermolecular interactions, future work rigorously connecting with the linkage theory would be desirable.
Protein–membrane interactions
Biological membranes are often negatively charged and nearby macromolecules are consequently exposed to an electric potential different to that in the bulk. As demonstrated in the previous sections – and quantified by Eq. (26) – such an electrostatic perturbation may trigger charge regulation but the question is if such a mechanism is relevant in a biological setting? Most proteins have capacitance peaks at acidic and alkaline pH (see Fig. 2) yet biomolecules rich in histidines are expected to peak at neutral pH. Examples are hisactophilin, HRP2 as well as histatin saliva proteins. In this section, we focus on hisactophilin and as seen in Fig. 2 this protein has a high capacitance at pH 6 while at pH 8, C is reduced almost by a factor of 3.
By simulating hisactophilin close to a negatively charged surface we investigate the free energy of interaction for a situation where the protein can titrate and one where the residue charges are fixed (Lund et al. Reference Lund, Åkesson and Jönsson2005). The results, shown in Fig. 6 for different salt concentrations and pH values, are in excellent agreement with the capacitance picture described above: Going from pH 7·5 to pH 6·5 we see a strong increase in the contribution from charge regulation. At the same time the effect of salt is strong, yet even at physiological salt conditions the charge regulation mechanism contributes with approximately −1·5 kT. Using Eq. (26) and Gouy–Chapman theory, salt screening is expected to dampen the interaction by exp (−2κr), i.e. much stronger than for direct Coulomb interactions.
Free energy of interaction of hisactophilin with a negatively charged surface at various pH and salt concentrations, C s. Calculated using coarse-grained Monte Carlo simulations with (full drawn lines) and without (dashed lines) charge regulation and with a surface area per charge of 300 Å2/e. (Lund et al. Reference Lund, Åkesson and Jönsson2005)
Interestingly, the binding of hisactophilin to phospholipid membranes is biologically governed by minor intra-cellular pH changes and the picture is exactly as observed in the simulations: binding at low pH and release at high pH (Hanakam et al. Reference Hanakam, Gerisch, Lotz, Alt and Seelig1996). That the capacitance for hisactophilin peaks exactly at conditions where the protein needs to bind is hardly a coincidence, but rather a sophisticated evolutionary design to control a biologically relevant interaction.
Protein–polyelectrolyte complexation
The complexation of polyelectrolytes and proteins is extensively used in pharmaceutics, food and cosmetics (de Kruif et al. Reference De Kruif, Weinbreck and De Vries2004; Doublier et al. Reference Doublier, Garnier, Renard and Sanchez2000; Girard et al. Reference Girard, Turgeon and Gauthier2003; Hubbell, Reference Hubbell2003; Jiang et al. Reference Jiang, Woo, Kangb, Singhb and Deluca2002; Schmitt et al. Reference Schmitt, Sanchez, Desobry-Banon and Hardy1998; Simon et al. Reference Simon, Wittmar, Bakowsky and Kissel2004; Zancong & Mitragotri, Reference Zancong and Mitragotri2002). The subject has been addressed by a number of authors exploring it from experimental measurements (de Kruif et al. Reference De Kruif, Weinbreck and De Vries2004; Girard et al. Reference Girard, Turgeon and Gauthier2003; Hallberg & Dubin, Reference Hallberg and Dubin1998; Seyrek et al. Reference Seyrek, Dubin, Tribet and Gamble2003) to theoretical modeling (Carlsson et al. Reference Carlsson, Linse and Malmsten2001; de Vries, Reference De Vries2004; Grymonpré et al. Reference Grymonpré, Staggemeier, Dubin and Mattison2001). The strength of interaction is to a large extent regulated by electrostatic interactions, governed by key parameters such as pH and salt concentration.
A particularly interesting observation is the apparently paradoxical formation of soluble complexes at conditions where the net charges of protein and polyelectrolyte have the same sign. Experimental studies of Dubin, Kruif and co-workers (de Kruif et al. Reference De Kruif, Weinbreck and De Vries2004; de Vries et al. Reference De Vries, Weinbreck and Dekruif2003; Grymonpré et al. Reference Grymonpré, Staggemeier, Dubin and Mattison2001) have demonstrated this counterintuitive property referred to as ‘complexation on the wrong side’ of the isoelectric point of the protein. The molecular interpretation initially focused on the assumption of ‘charged patches’ on the protein surface (de Kruif et al. Reference De Kruif, Weinbreck and De Vries2004; de Vries, Reference De Vries2004; Hattori et al. Reference Hattori, Hallberg and Dubin2000; Seyrek et al. Reference Seyrek, Dubin, Tribet and Gamble2003), but it has later been suggested that charge regulation has a significant if not dominating role (Biesheuvel & Wittemann, Reference Biesheuvel and Wittemann2005; da Silva et al. Reference Da Silva, Lund, Jönsson and Åkesson2006; de Vos et al. Reference De Vos, Leermakers, De Keizer, Cohen Stuart and Kleijn2010).
A formal way to describe the interaction between oppositely charged patches on two macromolecules is in terms of a multipole expansion and using simulated capacitances and dipole moments we can analytically calculate the ion-induced charge and ion–dipole contributions to the interaction free energy according to an expansion as in Eq. (15).
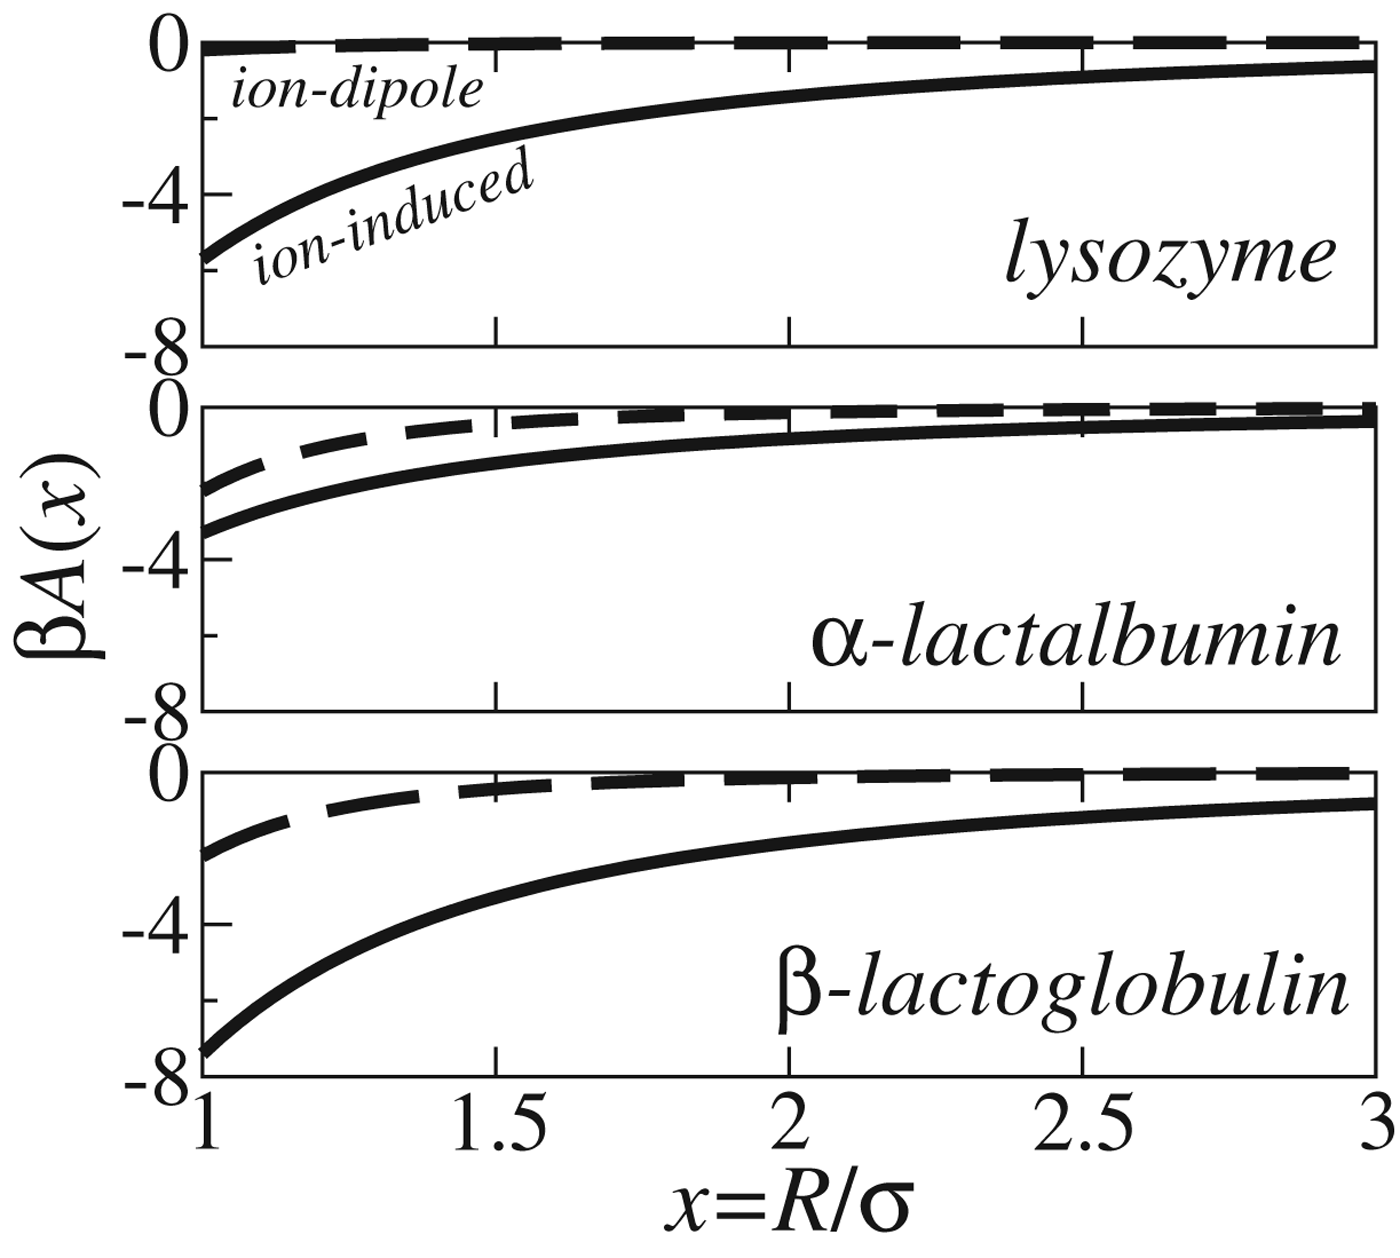
In Fig. 7 we have calculated the interaction between a polyanion (z=−21e) and different proteins (da Silva et al. Reference Da Silva, Lund, Jönsson and Åkesson2006). The regulation term is by far the most important term for lysozyme, while for α-lactalbumin and β-lactoglobulin the ion–dipole terms are of comparable magnitude. While the curves in Fig. 7 should be regarded as qualitative they still give – as will be seen below – a correct picture of the behavior of the three proteins. The regulation term decays slower than the ion–dipole term and thus gains in relative importance at larger separation. This means that even if the two terms are comparable at contact, the regulation term can still dominate the contribution to, for example, the second viral coefficient.
Ion-induced charge (solid lines) and ion–dipole (dashed lines) contributions to the free energy of interaction between a polyanion and three different proteins. Calculated from Eq. (15) augmented with an ion–dipole term using simulated capacitances and dipole moments (da Silva et al. Reference Da Silva, Lund, Jönsson and Åkesson2006).
In order to test the perturbation results in Fig. 7 we have performed two different simulations for each protein–polyelectrolyte complex: (A) all residue charges in the protein are kept fixed to their average bulk values and (B) the residue charges are allowed to titrate.
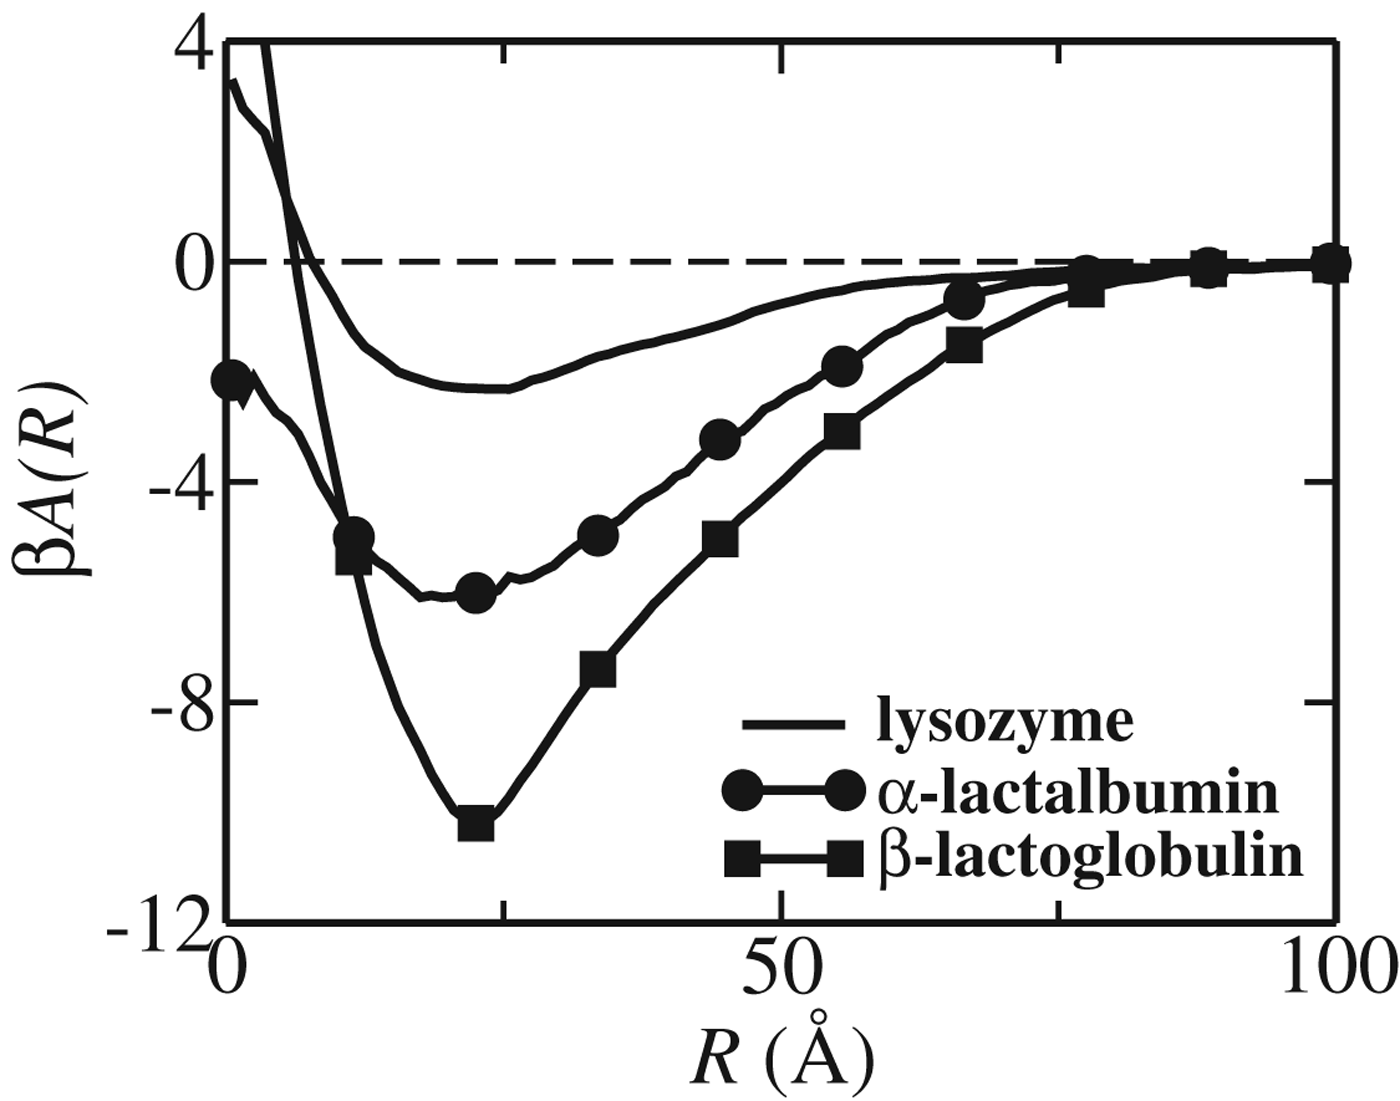
The calculated free energy of interaction, A(R), for the three proteins at their respective pI all show a clear minimum, see Fig. 8. The relative strength of the minima are in qualitative agreement with perturbation calculations, cf. Figure 7, while the actual numbers are approximately half the values predicted by second-order perturbation theory. The minima appear at roughly the same separation despite the fact that β-lactoglobulin is more than twice as big as the two others. This can be explained by the elongated form of the former, which also results in a more long-ranged attraction. The separation R can approach zero, which corresponds to a situation where the polyelectrolyte wraps around the protein. Note, however, that A(0) is repulsive indicating that the ‘wrapping’ of the chain around the proteins is an entropically unfavorable structure.
The free energy of interaction between the centers of mass of the protein and the polyelectrolyte at low salt concentration obtained from MC simulations with model B (da Silva et al. Reference Da Silva, Lund, Jönsson and Åkesson2006). The curves have been calculated at the respective isoelectric points for lysozyme (no symbols), α-lactalbumin (filled circles) and β-lactoglobulin (filled squares).
The attractive minimum in the protein–polyelectrolyte complex is reduced upon addition of salt (de Vries, Reference De Vries2004) and we can use the free energy minima, A(R min), from Fig. 8 to estimate the critical ionic strength. Assuming that the salt screening follows simple Debye–Hückel theory and that the complex is dissociated when the interaction is less than kT, we get the relation,
 $$\exp \lpar \minus 2\kappa R_{{\rm min}} \rpar \vert A\lpar R_{{\rm min}} \rpar \vert \les kT $$
where the factor of 2 in the exponent is because the second-order terms dominate the interaction. Following this recipe we find that approximately 10 and 20 mM salt is sufficient to dissociate the α-lactalbumin and β-lactoglobulin polymer complexes, respectively.
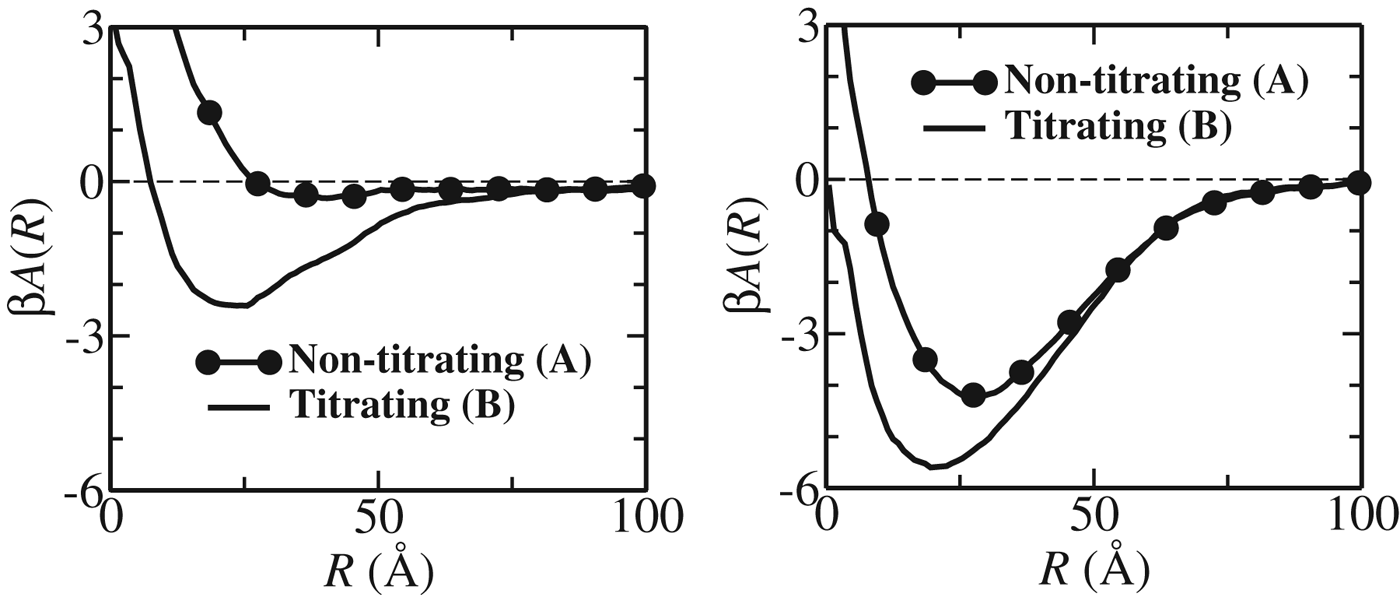
Thus, we have shown that a polyanion can form a complex with a neutral protein molecule. To determine whether this attractive intermolecular interaction is due to charge ‘patches’ or if it comes from charge regulation, we perform additional simulations – this time with a fixed protein charge distribution, set to that in bulk. These results, shown in Fig. 9, show that the free energy minimum for lysozyme is solely due to charge regulation; if the charge distribution on lysozyme is considered fixed, the polyanion–lysozyme interaction is essentially everywhere repulsive. This also means that the ion–dipole interaction gives only a very small attractive contribution, while the effect from higher order moments is negligible.
The free energy of interaction between the mass centers of a flexible polyanion (z=−21e) with lysozyme (top) and α-lactalbumin (bottom). From Monte Carlo simulations at pH=pI with both titrating proteins (lines) and for fixed charge distributions (line-symbols) (da Silva et al. Reference Da Silva, Lund, Jönsson and Åkesson2006).
The polyanion interacts more strongly with α-lactalbumin than with lysozyme and charge regulation increases the depth of the minimum from approximately −4 kT to −6 kT. In this case, the attraction is due to a combined effect from both charge patchiness and charge fluctuations.
Conclusion
Charge regulation is a generic mechanism present for all macromolecules with titratable sites. Using statistical mechanics and computer simulations we can quantify the importance of charge regulation for the interaction between a protein with other proteins, polyelectrolytes, membranes and ligands. We have seen that charge regulation drives the complexation between a neutral protein and a polyelectrolyte, and that regulation interactions may be responsible for a biological pH-sensitive switch for binding proteins to phospholipid membranes.
From basic statistical mechanical arguments it is shown that charge regulation can be captured by a single, intrinsic molecular parameter, namely the charge capacitance, which:
• is an intrinsic molecular property on par with the net charge and dipole moment;
• measures how easy it is to distort proton equilibria of titratable groups;
• is strongly dependent on pH and the pK a-values of the titratable groups;
• can be obtained from the derivative of the proton titration curve or from calculations; and
• enters the expression for the free energy between macromolecules.
A Probability distribution ansatz
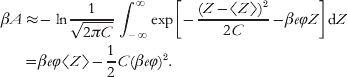
Let us briefly discuss an alternative approach to derive the interaction between charge regulating matter (Lund, Reference Lund2010). Figure 1 shows how the charge of a single titratable site fluctuates around the mean charge and extending this to molecular charge fluctuations we write the intrinsic probability of observing the charge Z by an arbitrary probability function P(Z). Exposing the molecule to an external electric potential, ϕ, the interaction free energy is
 $$\beta A \equals \--\ln\int { P\lpar Z\rpar {\rm \ }\exp \left[ { \minus \beta e\varphi Z} \right]dZ} .$$
While we here use a mean field approach, the external potential can equally well be a function of Z so as to include possible correlations.
Approximating P(Z) by a normal distribution, Eq. (25) can be solved exactly
 $$\eqalign{ \beta A \approx \tab \minus \ln{1 \over {\sqrt {2\pi C} }}\int_{\minus \infty }^{\infty } {\exp } \left[ { \minus {{\left( {Z \minus \langle Z\rangle } \right)^{\setnum{2}} } \over {2C}} \minus \beta e\varphi Z} \right]{\rm d}Z \cr \equals \tab \beta e\varphi \langle Z\rangle \minus {1 \over 2}C\lpar \beta e\varphi \rpar ^{\setnum{2}} . \cr} $$
This result is identical to the ion–ion and ion–induced ion terms in Eq. (15) and hence the first-order perturbation theory applied in the previous section simply corresponds to ‘attaching’ charge by a harmonic potential with a force constant inversely proportional to the capacitance. For a fixed charge distribution, the capacitance is zero and the force constant infinite.
For complex biomolecules, proton exchange also leads to fluctuations in higher order moments (Fornés, Reference Fornés2000; Kirkwood & Shumaker, Reference Kirkwood and Shumaker1952b) and in a Gaussian ansatz one could – for example – consider the free energy of a fluctuating dipole, μ, in an external electric field, E(R), by integrating over all angles as well as dipole moments,
 $$\beta A\lpar R\rpar \equals \minus \ln{1 \over {4\pi }}\int_{\setnum{0}}^{\setnum{2}\pi } {{\rm d}\phi } \int_{\setnum{0}}^{\pi } {{\rm e}^{ \minus \beta E\lpar R\rpar \mu \cos \theta } } \sin \theta {\rm d}\theta \int_{\minus\infty }^{\infty } {P\lpar \mu \rpar {\rm d}\mu .} $$
Here, the unperturbed P(μ) can be obtained by assuming that fluctuations around 〈μ〉 follow a normal distribution with variance 〈μ2〉−〈μ〉2.
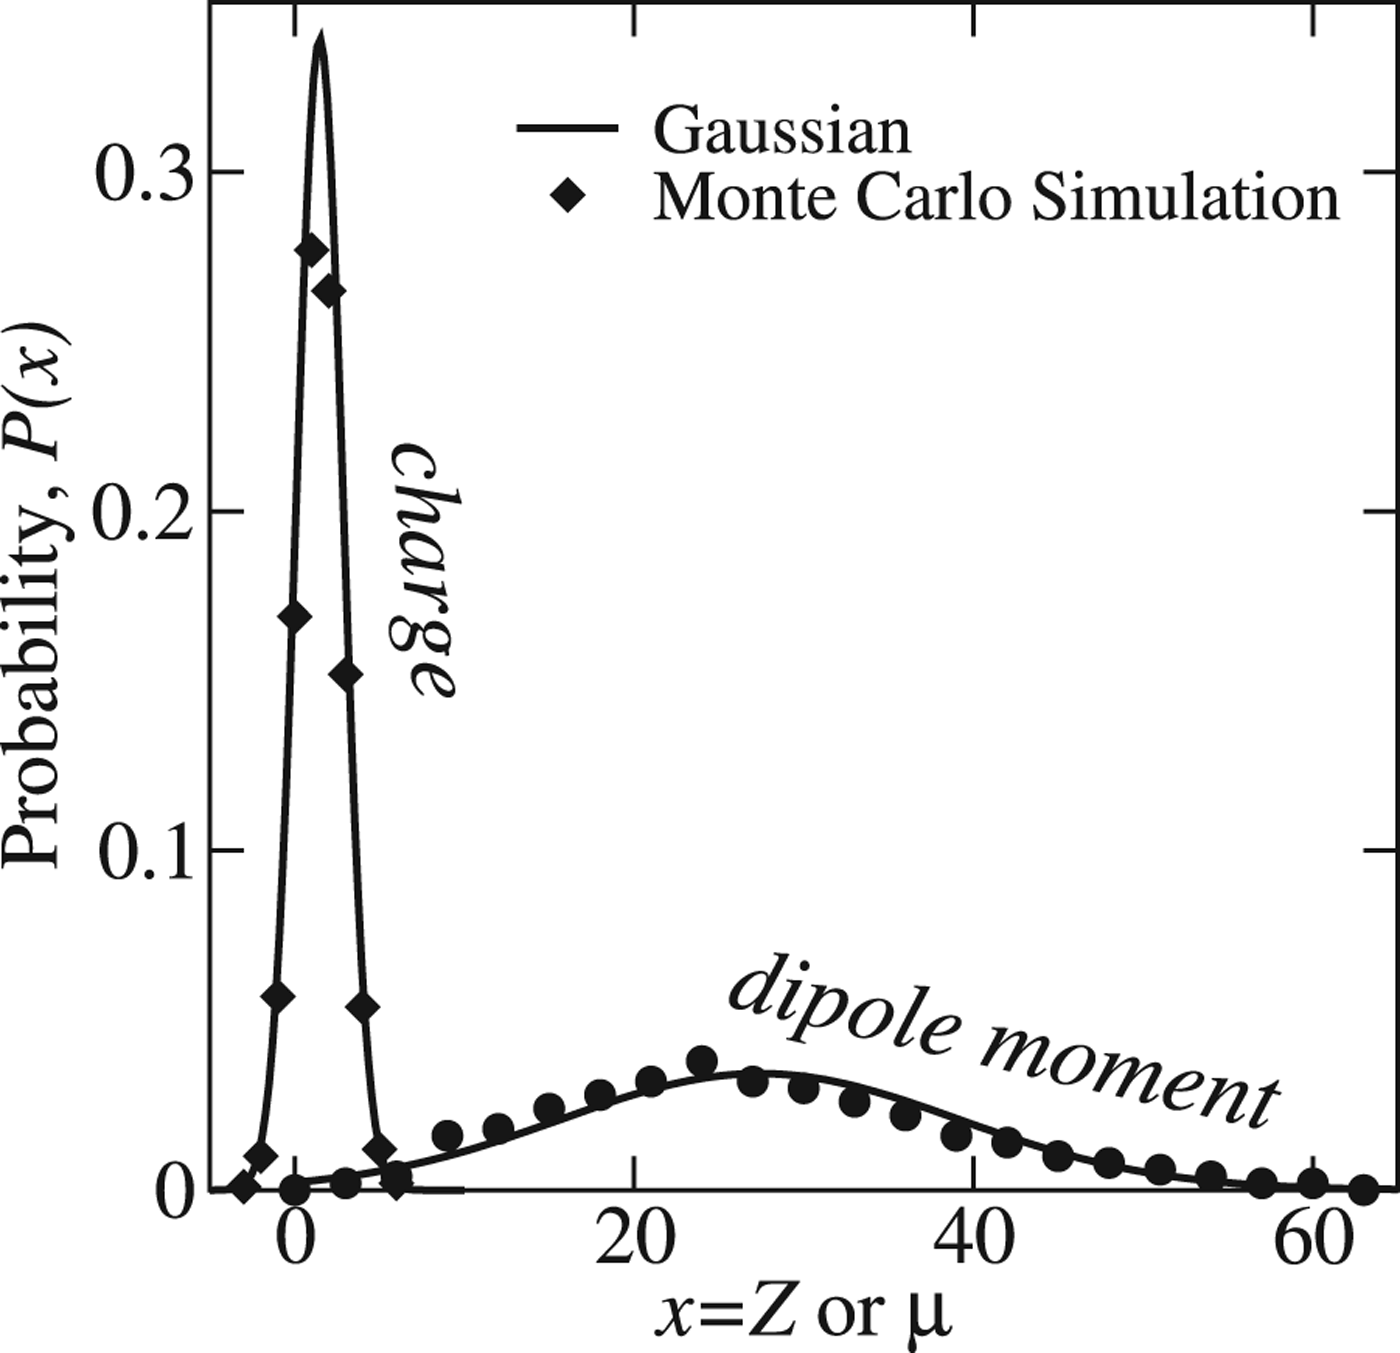
The remaining question is whether or not the distribution of charge and dipole moment actually follow normal distributions? This can be verified in a computer simulation where site titration and intermolecular interactions are explicitly included. As shown in Fig. 10 both the net charge and molecular dipole moment are excellently described by a Gaussian distribution.
Probability function for the net charge, Z and dipole moment μ of the protein hisactophilin at pH 7. The symbols represent the sampled histograms from a Monte Carlo simulation of the protein in a salt solution while the solid lines are Gaussians plotted from the averages and variances.
Acknowledgements
The authors wish to thank the Carlsberg Research Center Library in Copenhagen for providing us with the original papers by Linderstrøm-Lang. We also thank Bertrand García-Moreno and Renko de Vries for critical comments. They are not to blame for the content. For financial support we thank the Linneaus Center Organizing Molecular Matter (OMM), the eSSENCE strategic environment, and the Swedish Research Council.