Advocates of the traditional view of party government argue that political parties matter for public policy because different parties in government seek to realize their policy preferences and govern accordingly. Partly for these reasons, scholars have paid considerable attention to the effects of differences between parties as arrayed on a left–right dimension. The main finding from this literature is that parties of the left – at the national level – tend to spend more on social and related policies than do parties of the right.Footnote 1 At the state and local level, demands for service provision tend to drive up the expenditure of left-controlled governments, in contrast to the demands on governments controlled by the right for lower taxes and service provision by the private sector.Footnote 2 However, other researchers strongly question this view, arguing that it is anachronistic and that left–right differences are symptomatic of a more ideological age, and finding evidence of only weak contemporary party effects. Research of this kind has stressed upon how global pressures reduce autonomy for action and lead to convergence in party policy platforms.Footnote 3 Some researchers on electoral politics similarly point out the rise of valence issues and suggest that parties in government increasingly concentrate on competence rather than on implementing different policy positions.Footnote 4
In this article we develop a framework to empirically evaluate these different views of party effects as two competing models. However, our approach also allows for a third model in which party effects are contingent on the degree of competition between parties. Party competition is a key feature of the party representative government model in which voters have a genuine choice between parties to form governments.Footnote 5 In our model of contingent party effects, greater competition reduces the security of incumbent parties’ tenure and erodes left–right party effects. This modelling makes the existence of party effects contingent on low competition between parties.
We examine party effects where they matter most to citizens, in the context of policy outcomes that they directly experience. Much previous work has analysed party effects on policies or expenditures rather than examining policy outcomes, with a lack of data being a major constraint on research.Footnote 6 In areas where policy outcomes have been examined, the contexts have had external constraints limiting the scope of governments with different policy priorities to implement their plans, notably in economic and welfare policy.Footnote 7 However, even in this area, policy outcomes related to coalitional and party differences have been observed, particularly in economic, education and training policy.Footnote 8 We analyse party effects on English local government public service performance, with performance defined as the effectiveness of those services in the local area in which citizens live. Citizens are affected by local services on a daily basis, and the lack of previous studies of party effects on public service performance is surprising given the acknowledged importance of public services as an issue in many local, but also some national, elections.Footnote 9
The use of data about local government to evaluate the empirical implications of theory of general relevance is more common in economics – notably in examining political incumbent behaviour and political institutionsFootnote 10 – than in mainstream political science but the benefits are being increasingly recognized.Footnote 11 English local government is particularly, valuable for evaluating models of party effects. Local government services are a key public policy issue, taking a quarter of all public sector expenditure. Local governments have considerable control over the way that the public services for which they are responsible are delivered locally. There are a multitude of distinct government units operating under the same institutions. Councils face frequent elections, with clear control by parties that have distinct platforms, and there are occurrences of change in party control. Importantly, given our interest in policy outcomes, local government in England most unusually offers quantitative indicators of public service performance measured consistently for a number of years across local units. The availability of performance data is a new direction for studies of party effects, which have previously used expenditure and other resource data that are not strictly measures of policy outcomes. In 2010, the central government ended the requirement for much of the information used in this study to be collected systematically, making the period a rare window of opportunity for research on this topic.
Our framework consists of three models of party effects on public service performance. The first model, developed from the traditional view of left–right party effects, argues that parties of the left invest more in public service effectiveness than parties of the right. There is always a budget constraint on service performance, and parties of the right tend to try and keep tax down rather than spend to improve public services.Footnote 12 Some authors further argue that right-wing parties are less committed to public, as opposed to private sector provision of services, in part because their supporters tend to make less use of public services.Footnote 13 The second, instrumental, model suggests that this view is wrong. Instead, all parties are likely to form governments that care about the standard of public services because voters respond to the performance of incumbents, and parties are keen to get re-elected. Previous research suggests that service performance is a concern both for voters and incumbent parties.Footnote 14 The third, mixed, model proposes that party effects are contingent on the discretion available to the ruling party as reflected in its seat share. This mixed model suggests that the instrumental model is increasingly relevant as the degree of control by the incumbent party declines, reducing its ability to implement party positions.
Our study enables us to ask whether the party effects model is correct in predicting that right-wing parties in power are associated with worse public service performance. Or is the instrumental model applicable such that all parties are interested in public service performance? Or are party effects contingent with all parties concerned about performance as their degree of political control decreases? The findings are of general relevance to contexts of party government under circumstances where ruling parties have at least some autonomy of action in bringing about a policy outcome and there is party-based electoral competition. After developing the three theoretical models in more detail, we derive propositions about the performance effects of parties and changes in party control, both overall and contingent on different degrees of competition. Next, we introduce our research setting of English local governments. Then we describe our data and explain our methods of analysis before proceeding to our findings. Finally, we draw conclusions from our analysis and suggest future directions for research.
Theories of party effects on public service performance
Political science has a long tradition of work on responsible party government. This line of research entails the view that parties, rather than individual candidates, are the main entities for democratic representation.Footnote 15 In this view, elections provide competition between two or more parties that recruit and nominate candidates and contend for power as organizations. Parties provide policy options or offerings about competence to run governments. Voters are assumed to be sufficiently informed to reward or punish incumbent party governments based on their performance. All parties in power, regardless of ideology and level of government, operate within this framework. Parties are assumed to have elements of office-seeking and policy-seeking motivations, whereby the former is a precondition for the latter since being out of power bars a party from directly influencing policy.Footnote 16 Parties provide legislators with an organization to overcome their collective action problem. They provide a cartel that attaches policies and a brand to legislators that helps them get re-elected.Footnote 17
Our argument is that it is not enough for public authorities to enact a policy; it needs to be implemented and for citizens to reward a governing party as a result. For example, an elected assembly could pass laws improving flood protection, but if the dykes and levees are not reinforced citizens will not notice what the government did. The same issue exists at the local level: if a local government announces that it will improve the collection of waste but it does not do so, then it will not reap the electoral reward. If policy makers announce policies that are just symbolic, the result could even be worse than doing nothing at all. Our framework incorporates three models of how parties may operate: (i) the ‘policy-seeking parties’ model; (ii) the ‘instrumental’ model; and (iii) the ‘mixed behaviour dependent on party competition’ model. The three models are aligned on a continuum, where the policy-seeking party model of party effects is at one end and the instrumental model of no party effects is at the other. The mixed model covers the space between the two extremes of the policy-seeking party model and the instrumental model.
The Policy-Seeking Party Model
The policy-seeking party government model suggests that the political values of the party in power will have meaningful consequences for the effectiveness of public services. Parties have different programmes, which are a function of their constituency and ideology,Footnote 18 and research has shown that different parties in government produce substantively different policies.Footnote 19 This phenomenon is often referred to as mandate theory: ‘voters expect parties to fulfil their promises once they are in office, i.e. participate in party government.’Footnote 20 Mandate theory has been corroborated for British national politics.Footnote 21 The left–right dimension in party position is often suggested to be the most salient. The literature on party control and economic performance shows theoretically and empirically that left governments tend to introduce demand-side stimuli.Footnote 22 They also tend to co-ordinate with interest groups such as trade unions. Iversen and Soskice argue that left-centre coalitions under proportional representation systems invest in training policy and depress real wages, thus delivering good export performance in spite of high exchange rates.Footnote 23 Iverson and Stephens also argue that left party investment in education in welfare states is consistent with their pursuit of economic efficiency and socially progressive outcomes.Footnote 24 More generally, the institutionalist literature on welfare states observes that the correlation between left-party control and a large investment in welfare creates a series of positive feedback loops between citizens and the state that improve social conditions and lead to a high standard of services.Footnote 25
But the existing literature on party control and economic performance does not examine the effectiveness of incumbent parties in running the bureaucratic machine to deliver public services. This omission is somewhat surprising given the emphasis that opposition parties place in their pre-election claims on how they will govern better than incumbents, focusing on government policy errors and waste, and trying to undermine the way in which incumbents defend their records.
The policy-seeking model suggests that politicians from different parties have distinctive views about the role of the state and the value of public service performance. Parties of the left are typically characterized as believing that public services can be used to improve the welfare of disadvantaged groups in society and right parties as being more concerned about keeping tax down rather than providing such services.Footnote 26 Once in office, parties of the left are expected to focus their energies on public services – which benefits their core voters and fits their ideology – and to achieve higher performance in these services than right parties, which are expected to focus on goals that should conflict with service performance maximization, such as tax cuts. Thus, in the policy-seeking party government model, distinct party effects on performance are expected. By implication, such effects are also to be expected for changes in political party control. If a government previously controlled by a party that prioritized public services falls under the control of a party that prioritizes tax cuts, one would expect public service performance to fall because of the shift in emphasis.
The Instrumental Party Model
Based on a long literature going back to Hotelling and Downs,Footnote 27 the instrumental model suggests that all parties maximize votes by satisfying the preferences of the median voter (given the usual assumptions of the existence of a single policy dimension and exogenous, single-peaked preferences). This tradition is consistent with research on party effects that rejects the importance of left–right differences, arguing that it is at best an anachronistic view of parties with these differences symptomatic of a more ideological age. Work of this kind has instead stressed convergence in party policy platforms.Footnote 28 If the standard of public services is considered a valence issue there is then agreement across parties that better performance is desirable.Footnote 29 If all parties obtain an electoral benefit by providing better services, then all are expected to strive to achieve high public service performance. On this basis, the differences between parties’ policy positions are likely to be small, so one would not expect to observe any differences in public service performance regardless of which party controls a government.
The Mixed Behaviour Party Competition Model
The contrast between the policy-seeking party government model and the instrumental model is stark. However, the models have been suggested as being relevant under different electoral, legislative and governmental institutional contingencies. There is likely to be more policy seeking when intra-party democracy is strong and benefits of office accrue even to parties obtaining less than the plurality of votes, and more vote seeking when electoral uncertainty is greater and the number of issue dimensions relative to the number of parties is high.Footnote 30 An important factor influencing the demarcation between one model and the other is the degree of party competition. We suggest that this is reflected in the degree of control over the government unit the ruling party has, as reflected in its share of seats. This share reflects the current strength of the party in the government and influences the perceived probability that the party currently forming the government will lose the next election. The mixed model suggests that inter-party competition moderates the effects of party policy position.
The following propositions flow from the three models:
(1) The policy-seeking party model suggests that left parties in government will be associated with higher performance than right-wing parties in government. It also suggests that a change to right-party rule is associated with a decline in subsequent public service performance and a change to left-wing party rule is associated with an improvement in subsequent public service performance.
(2) The instrumental model suggests that there is no difference between left-party and right-party rule in terms of public service performance. It also suggests that a change to either right-party or left-party rule is not associated with positive (left party) or negative (right party) change in subsequent public service performance.
(3) The mixed behaviour party competition model suggests that the difference between right-party and left-party effects decreases in magnitude as party competition increases. The mixed model also suggests that the decline in public service performance associated with a change to right-party rule and the improvement associated with a change to left-party rule decrease in magnitude as party competition increases.
The three models of party effects are most relevant to contexts where there is an electoral system that allows for clarity of responsibility, strong political parties that have the capacity to implement policies affecting policy outcomes, and electorates with some interest in public service performance. Political systems across many countries have these features, particularly those with electoral systems with plurality/simple majority electoral rules that tend to lead to a small number of strong parties that focus on their platforms,Footnote 31 due to the strong position of party leaders.Footnote 32 Within the United Kingdom, national government has these features, as do other countries often classified as Westminster systems at the national level, for example Canada and Australia. At the local or state level, considerable variety is evident across countries, but strong parties are present in many contexts. However, the models are most relevant where party government is evident and least relevant to non-partisan governments, for example those that predominate in over 75 per cent of local governments in the United States.Footnote 33
To evaluate the hypotheses from the three models the research setting should have variation in party control and competition across multiple governments but still have full comparability between government units and the ability to control for other influences on public service performance. The parties in control of governments need to have distinct platforms that can be located on a left–right dimension and there must be occurrences of elections resulting in changes in party control. Service provision must be an important part of the activities of these governments, and they must be able to exercise some control over service performance. Finally, the data on party control need to be combined with reliable and valid quantitative indicators of public service performance measured consistently for a number of years across several elections. Local government in England is one such setting, which has the advantage of reducing any unobserved heterogeneity deriving from varying national political cultures and the differential operation of political institutions across nations and where there exists an official measurement of performance.Footnote 34 For these reasons we evaluate the models in the domain of English local government in the first half of the 2000s, which offers an unusual and valuable opportunity for research of this kind.
Data and methods
We analyse the 148 principal units of English local government (London boroughs, metropolitan districts, shire counties and unitary authorities). We track these local authorities in a panel from financial year 2002/03 up to and including financial year 2006/07.Footnote 35 These local governments operated within the same broad institutional framework set by the central government and held at least two elections within the time period under investigation. More than half of the local governments in our sample held elections every year for three years out of a four-year cycle.
There are three ideologically distinct major parties competing under a first-past-the-post electoral system: the Conservatives, Labour and the Liberal Democrats. Left–right differences between parties have been conceptualized in several ways.Footnote 36 We place the parties on a left–right dimension based on their stated policy position towards the importance of local public services, which relates directly to our interest in the performance of these services. We draw on data from the Comparative Manifestos Project (CMP) about these parties’ statements in manifestos about the services that local government provides. We focus on this measure rather than the Manifestos Project's overall left–right measure of party position, which covers broader attitudes to the economy and government intervention, which are substantially beyond our focus of interest.Footnote 37 In England, local party organizations are an integral part of national parties. Moreover, national parties dominate local elections, both vote and seat shares.Footnote 38 There is no systematic approach to the production of local manifestos in England; while particular local election materials are produced in some cases, often they are not. Instead, local branches of the national parties communicate campaign statements during the election period. The national election party manifestos set out policy positions and, in our period, all the parties’ national manifestos contained extensive sets of statements about local government services. We examine the national election manifestos for the 2001 and 2005 elections which, taken together, provides a good indication of party policy positions both at the start and end of the period we examine.
The measure of the left–right party position we adopt examines the salience of services that are provided by the local governments for each party as expressed by statements in the manifestos. The index is calculated by adding up measures of the percentage of quasi-sentences in the manifesto document relating to the CMP categories of providing services to protect the environment, the provision of cultural and leisure facilities, the provision of social services and social security, and education provision. The variable potentially ranges from 0 to 100 per cent with higher scores indicating greater salience of these services in the party's policy position. Evaluating the manifestos for the national elections in 2001 and 2005, the Conservative party scored 18.37 and 20.30, the Liberal Democrats 25.39 and 21.00, and Labour 25.19 and 30.30 in the two elections respectively.Footnote 39 While the CMP dataset has been criticized,Footnote 40 it has been used by an impressive range of studies in political science, as noted by the creators of the data.Footnote 41 For our purposes, a clear difference is evident between the Labour party (noting the importance of public services to this party as indicating a left position in the range 25.19 to 30.30 on the dimension we identify) relative to the Conservative party (a right position on the dimension in the range 18.37 to 20.30). The Liberal Democrats are not clearly distinct in relative position and so are not used in our analysis as a test of the left–right propositions; however, they are retained to examine whether party control (as opposed to no party being in overall control of a local government) is by itself a factor in influencing performance.
The CMP data we use to establish party-policy positions are consistent with other evidence about the different party policies on public services. The Conservative party tends to focus on tax reduction and on efficiency relative to Labour, which places more stress on service effectiveness.Footnote 42 The Labour party's concern with service effectiveness dates back to the Webbs’ view that all citizens should receive relevant services, as determined by the government.Footnote 43 It is also noted by Crosland,Footnote 44 who stresses effectiveness, particularly in social services and education, as a major concern of British socialists. The Labour party's contemporary interest in public service performance is reflected in a major national government policy programme under the previous Labour administration of prioritizing the improvement of public services.Footnote 45 Consequently, under the policy-seeking party model, one would expect councils controlled by Labour to achieve higher service performance than similar councils controlled by the Conservatives. The Liberal Democrats cannot be classified as easily on our public services left–right dimension and are more heterogeneous internally on this issue than the two other main parties.Footnote 46 The coalition between the Liberal Democrats and the Conservative party at the national level since 2010 supports this view: they could have allied with parties of the left or right.
Within each local government unit, incumbent parties have considerable influence on the methods by which services are delivered, which in turn have important consequences for the performance of these services. Whilst it has been pointed out that local socio-economic conditions and other factors influence the quality of public services in a locality, research still shows that individual local authorities operating different strategies have the capacity to influence outcomes.Footnote 47 Although local government implements much legislation passed by government, it has managerial discretion over about a quarter of public spending in the United Kingdom, some £180bn out of £681bn. Importantly for our analysis, the same consistently measured performance indicators are available for all the English local government units, a vital source of evidence that is in most cases not available to researchers examining this topic in other domains.
Assessing party effects on public service performance outcomes using performance data is a major advance on the only approaches previously available, which use data only on expenditure. Such data would require the unjustified assumption that lower expenditure levels are reflected in worse public service outcomes compared to higher spending levels. Instead, spending may not be related directly to service performance. For example, performance may not rise in line with increases in expenditure because of well-known problems of policy implementation and inefficiency in service delivery, and spending cuts may not damage performance if efficiency can be improved.
During the period of our study, all principal English local governments were responsible for providing key public services, and their activities were limited by statute to focus on these services. We use the Core Service Performance score (CSP) as a composite measure of service quality and effectiveness. This measure has been used in previous studies of local government performance.Footnote 48 The CSP score is based on a set of standardized quantitative performance indicators for all the local government service areas of primary and secondary education, social services, environmental services including waste management and local environmental protection, housing welfare benefits, libraries and leisure, management of resources, and housing. Based on the difference between these quantitative indicators and their benchmarks (defined by the Audit Commission), each local government receives a score between 1 (lowest) and 4 (highest) for each of the six service areas. The scores for education and social services, the two services consuming the most expenditure, are then multiplied by four; the scores for environmental services and housing are multiplied by two; and the scores for the remaining services are multiplied by one. Then these weighted scores are added up. The maximum score is therefore 60, except in the case of counties, which do not provide housing or welfare benefits and therefore can achieve a maximum score of 48. We adjusted our CSP using the same approach as Andrews et al.Footnote 49 It shows the percentage of the maximum possible core service performance achievable by each local government unit. That is, for counties the denominator is 48 and for all other local governments it is 60. The numerator is always the actual CSP achieved. All local governments are required to collect the performance indicators using standardized procedures, and the Audit Commission annually verified the integrity of these data, reducing the risk of illegitimate manipulation of scores. Summary statistics on this and all other variables are provided in Appendix Table A1.
Key Explanatory Variables: Political Party Control and Change in Control
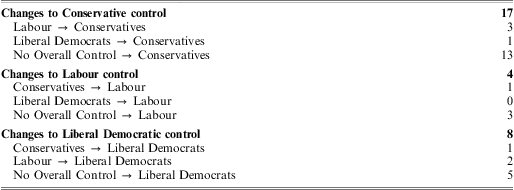
Our explanatory variables concern party control and changes in party control of a council. We draw our data from the Local Election Handbooks,Footnote 50 the BBC local elections coverage and the ‘Political Control in Great Britain’ maps issued by the consultancy PPS. We provide further information on party control in Appendix Table A2 and an overview of all changes in control in our estimation sample in Appendix Table A3. Throughout the analysis, we consistently lag all indicators of party control and change in party control by one year. The reasoning is that upon taking office one or two months after the new financial year has begun (on 1 April), a new party majority will largely have to live with the budget priorities set by their predecessors. In contrast, a year later they can be expected to have altered the budget and other organizational characteristics that may be linked to service performance. It would be foolish for them to wait any longer than necessary, not only in the metropolitan boroughs with their frequent elections (three out of every four years) but also in general, as the first year with its honeymoon period is the best time to make any changes.
To test Propositions 1 and 2 for the policy-seeking model, we look at political control as well as change in control. First, we test whether party rule is or is not associated with higher public service performance by means of three indicator variables for Conservative, Labour and Liberal Democratic control. There are two ways in which we test Propositions 1 and 2 against data on political control change. First, we specify indicator variables for all three logically possible types of change in control: (i) change from control by a single party to no overall control; (ii) change from no overall control to control by a single party; and (iii) change from control by one single party to control by another single party. Second, we consider changes to Conservative control, since Proposition 1 would predict a drop in measured public service performance after the Tories take office. We include two indicator variables for change to Conservative party control: (i) change from single-party control by either Labour or the Liberal Democrats to Conservative control; and (ii) change from no overall control to Conservative control. Of course, this includes council-years where the Conservatives continue to control a council as opposed to taking it over, which is a tough test as new Conservative councils would have to differ systematically even from councils already controlled by the Conservatives if there was any public service performance effect (positive or negative) of changes to Conservative party control. To test Proposition 3 against political party control, we include two variables for each of the three major parties: (i) an indicator variable that takes on the value of 1 if that party controls a council-year (0 if that party does not control that council-year); and (ii) a variable containing the percentage of council seats held by that party if and only if that party controls the council (0 otherwise).
Control Variables
Finally, we include a number of controls for factors known to affect public service performance generally. The first and most important control is past performance. Theory suggests that organizations are autoregressive systems.Footnote 51 The second important control variable is the claimant rate, which is an excellent proxy for the unemployment rate and, therefore, for local economic conditions. Where these are worse, one can expect a greater demand for social services and a host of other issues that are correlated with worse economic conditions, all of which make it more difficult to achieve high performance. The third important control variable is the sum of grants a local government receives per capita from the central government in a given year. This variable is created by summing the Revenue Support Grant, receipts from the Non-Domestic Rate pool,Footnote 52 and specific grants both inside and outside the Aggregate External Finance framework. In addition, by virtue of our estimation technique we automatically control for (relatively) fixed differences between authorities such as population and deprivation in all our models. Also, we include time dummies to capture common shocks such as the terrorist attacks on London in July 2005, which forced all local governments to look more closely into disaster response, potentially affecting public service performance across the country.
Since we have an autoregressive specification – i.e. we control for past performance – we need to take special care in estimating our models. In the presence of a lagged dependent variable, pooled ordinary least squares (OLS) is consistent only if there is no unobserved heterogeneity – time-invariant differences between local authorities that are not fully measured – and no serial correlation. If there is unobserved heterogeneity, the coefficient on the past value of performance will tend to be exaggerated as it absorbs a large amount (but not all) of the unobserved heterogeneity. This is not a major problem necessarily as it is likely to make it harder to find evidence in accordance with the political change hypotheses. Yet, since we prefer to obtain the most accurate estimates, we use an instrumental variables estimator, which allows us to control for unobserved heterogeneity while removing any bias that the correction for unobserved heterogeneity (differencing) might have induced in the coefficient on the lagged dependent variable. Arellano and Bond developed this estimator.Footnote 53
Finally, we also control for the overall upward trend in performance (as measured by the CSP over the period of our study) by including a constant term, which in the Arellano–Bond model is a trend term because both sides of the estimating equation are first-differenced.
Results
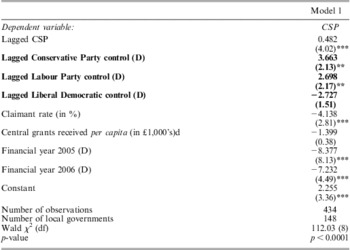
Our findings lead us to call into question the left–right party effects model of performance. As Table 1 shows, left-party (Labour) control is associated with a 2.7 percentage point higher CSP than where no party is in control. Liberal Democratic control is statistically indistinguishable from no overall control. However, the findings about right-party (Conservative) control are flatly inconsistent with this first model. Conservative control is associated with a 3.7 percentage point higher CSP, with the Labour and Conservative control coefficients being statistically equal (p = 0.55).Footnote 54
Testing for Effects of Political Party Control on Public Service Performance

Note: Huber–White z-statistics are listed in parentheses. * Significant at 10%; ** significant at 5%; *** significant at 1%. (D) indicates a dummy variable.
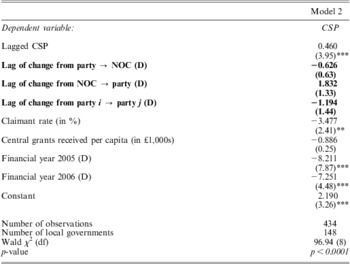
Since these findings have been identified from changes in political party control, it is worth looking at these changes directly. We start by examining different forms of change in party control. The results of this analysis are reported in Table 2, which confirms that changes on their own, without looking at the party label, tend neither to hurt nor to harm public service performance.
Testing for Effects of Changes in Political Party Control on Public Service Performance

Note: Huber–White z-statistics are listed in parentheses. * Significant at 10%; ** significant at 5%; *** significant at 1%. (D) indicates a dummy variable.
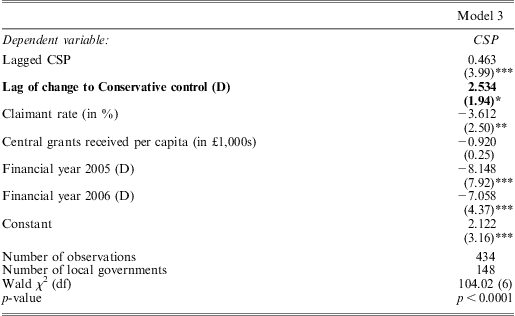
Table 3 examines under what conditions there is a boost to public service performance when a Conservative administration takes over.Footnote 55 The CSP tends to rise by 2.5 percentage points. Though most changes are to right-wing party control, four councils also changed to Labour, although this did not lead to a performance change.Footnote 56 Overall, our findings suggest a boost to performance from both left-party and right-party control but not from Liberal Democrat control, a party that because of its internal heterogeneity we could not place at a clear position on the left–right policy dimension, an issue we return to in the conclusion.
Testing for Effects of Changes to Conservative Party Control on Public Service Performance
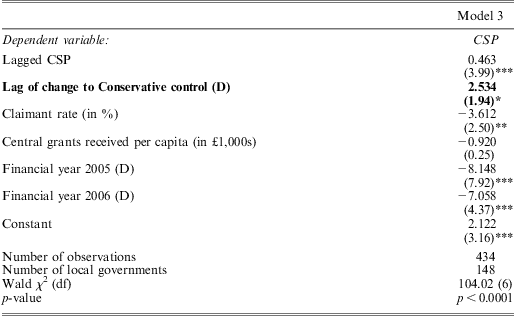
Note: Huber–White z-statistics are listed in parentheses. * Significant at 10%; ** significant at 5%; *** significant at 1%. (D) indicates a dummy variable.
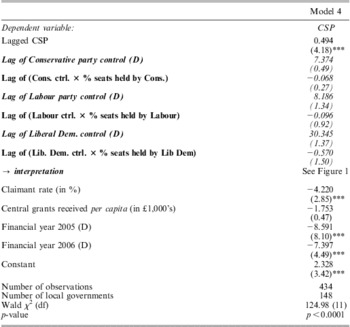
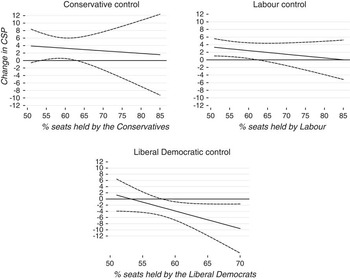
We now turn to the findings about the moderating effect of party competition on party effects on performance. Table 4 contains a closer look at the findings from Table 1 in the context of the effects of party control moderated by the seat share held by the governing party. To test for the impact of control by a party, one needs to look at the total impact of that party, which is measured by the coefficient on the party indicator variable plus the product of the percentage of seats held and the coefficient on the seat percentage. This information is provided in Figure 1 for the CSP. The figure shows the estimated impact of party i as well as the 90 per cent confidence intervals (the curved dashed lines above and below the estimated impact). Where the confidence interval does not include the horizontal zero line, the impact of party i is statistically significant based on the joint significance of the coefficients rather than on the significance of individual coefficients separately (which are reported in Table 4 and which do not meet the same level of significance when considered one at a time).
Testing for Effects of Political Party Control on Public Service Performance, Moderated by Seat Share

Note: Coefficients in italics cannot be meaningfully interpreted in isolation. Please refer to Figure 1 for the impact of party control. Huber–White z-statistics are listed in parentheses. * Significant at 10%; ** significant at 5%; *** significant at 1%. (D) indicates a dummy variable.
The impact of party control (lagged 1 year) on the CSP depending on the percentage of seats held by the party in control

As the effect of party control now depends on the seat share, a number of figures provide overviews of the range of effects. Figure 1 shows the effects of three major parties on the CSP. To provide an example of how the marginal effects in Figure 1 are derived, first note that it draws upon the first column of results in Table 4. Figure 1 depicts the effect of Conservative party control compared to no overall control, depending on the percentage seat majority held by the Conservative incumbent. This effect is derived by adding the raw coefficient on lag of Conservative party control (7.477) with the product of the percentage of seats held times the raw coefficient on the interaction of Conservative party control and percentages of seats held by the Conservatives (−0.068). Suppose we have a Conservative incumbent holding 55 per cent of council seats. The effect of Conservative party control compared to no overall control is then 7.477+(55) × (−0.068) = 3.737, that is, on average the CSP tends to be nearly four points higher for a Conservative majority of 55 per cent of seats compared to no overall control. This information is provided in the left panel of Figure 1 as part of the presentation of change in CSP for the whole range of plausible majorities. Figure 1 shows that the positive effects of both Conservative and Labour control on performance only occur where the political environment is competitive, namely where majorities are moderate (no more than about 65 per cent of council seats), and therefore there is a reasonable chance that they will lose the next election, forcing them to focus more on public service performance. The Liberal Democrats’ performance is also better the smaller their seat share, indicating that the moderating effect of party competition is present for all the main political parties.
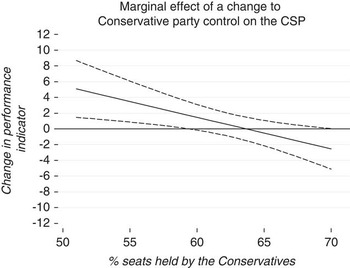
Table 5 builds on the analysis underlying Table 3 by showing the effects of changes to Conservative party control moderated by the seat share held by the new Conservative administration.Footnote 57 In a similar fashion to Table 4 for party control, Table 5 contains a test of the proposition about the moderating effect of party competition (Proposition 3). There are two indicator variables: (i) change from single-party control by either Labour or the Liberal Democrats to Conservative control; and (ii) change from no overall control to Conservative control. The base (omitted) group consists of council-years with no change to Conservative control. In addition, for each of these two sets of changes to Conservative control there is a variable containing the percentage of council seats held by the new Conservative majority (0 if there is no change to Conservative control). As in Table 4, to test the impact of a change to Conservative control, one needs to look at the total impact of the change to Conservative control, which is measured by the coefficient on the change to Conservative indicator variable plus the product of the percentage of seats held and the coefficient on the change to Conservative control interaction with seat percentage. This information is provided in Figure 2, which is constructed using the same method as for Figure 1 but shows the effects of a change to Conservative control on the CSP. This score increases following a change to Conservative control only if the new Conservative majority is less than 60 per cent of council seats and is higher the smaller the majority the local party has in government.
Testing for Effects of Changes to Conservative Party Control, Moderated by Seat Share

Notes: Coefficients in italics cannot be meaningfully interpreted in isolation. Please refer to Figure 2 for the impact of a change to Conservative control. Huber–White z-statistics are listed in parentheses. * Significant at 10%; ** significant at 5%; *** significant at 1%. (D) indicates a dummy variable.
The impact of a change to Conservative party control (lagged 1 year) on the CSP depending on percentage of seats held by the Conservatives upon taking control

Conclusions
The findings strongly support the importance of party competition as incorporated in the mixed model of party effects. Conservative and Labour incumbents that do not have overwhelming control of their councils produce the improvements to performance found in our study. The Liberal Democrats perform better under these circumstances too. However, the left–right party position model is not supported in our data, and we suggest that, if it ever was applicable, it certainly does not apply to contemporary local government in England. Instead, we find positive links between control by a right party – the Conservatives – and public service performance in addition to positive links between control by a major left party (Labour) and public service performance. It appears to be the case that right parties are better able to run public services than the traditional left–right policy view suggests, perhaps in a more competitive globalized context where national policies follow more market principles policies are more informed by market principles and the focus on performance of the New Public Management.Footnote 58 The findings suggest that right parties, at least in a period of relatively low fiscal pressure, are able to improve the performance of public services and may be able to make more stringent decisions on internal divisions and may be freer from employees’ organizations to carry out service reforms than left parties that have ties to trade unions. Either way, the benefits of implementing a clear policy position towards public services are shown by the relatively poorer performance of the Liberal Democrats who could not easily be placed on the policy dimension we analyse and whose performance in government was not as good as the other two parties.
The evidence supports the valence politics interpretation of much electoral competition, that of with parties trying to manage public services to produce maximum benefits to the electorate in addition to governments’ traditional concerns about economic management.Footnote 59 Our findings refer to outcomes for performance, in contrast to earlier studies that find left–right party effects in terms of expenditure. This approach calls into question the many cross-national studies of party effects on policies that are operationalized as spending. We find significant differences in service performance in a context where spending is largely set by central government and is formula-based, suggesting that the variation of interest to citizens is unlikely to be captured by variables on spending alone. As more jurisdictions make available performance data, rich opportunities for students of party effects will develop. It appears that the real distinction in terms of public service performance may be based not on party position or ideology but on other political factors that merit further research. In particular, party control is associated with better performance than non-party control for both the Conservatives and Labour parties. These are parties with much experience in governing at all levels of government and relatively stronger party discipline compared to the Liberal Democrats. The Liberal Democrats tend to be more heterogeneous as a governing group locally and less subject to central leadership than the other parties, perhaps making their situation more similar to cases of no overall control and making it more difficult for them to play the game of valence politics.Footnote 60 These findings from local government have implications for the Liberal Democrats’ capacity to act as a responsible party of national government, a role they now find themselves performing for the first time in the United Kingdom. Strategic management capacity for the government unit, then, seems to emerge as an important determinant of public service performance, but on the political side rather than its more conventional interpretation in terms of the capacity of administrators.
The competitiveness of party government emerged as the determining factor affecting each governing party's performance, as reflected in the mixed model. Service performance was higher the more competitive a situation the governing party found itself in. Future work on party effects will be improved if more account is taken of the role of party competitiveness. The implication is that there is an incentive in competitive party government to improve public services rather than just apply resources to the voters or deal in symbolic policy promises. To the extent that such incentives exist, it offers a major benefit to representative government and shows that the absence of party government could harm the voters. Not only do parties perform the essential functions of aggregation and policy making, they help improve the quality of services, especially when compared to the absence of responsible party government.
Appendix
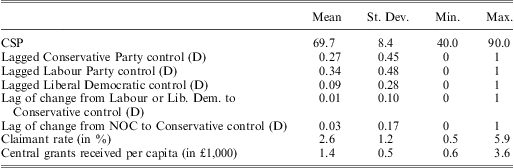
Summary Statistics
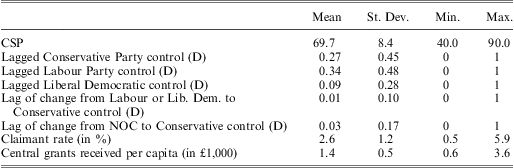
Note: Model 1 estimation sample: 434 observations on 148 local governments.
Observations by Political Party Control

Note: Model 1 estimation sample.
Disaggregating of Changes in Political Party Control
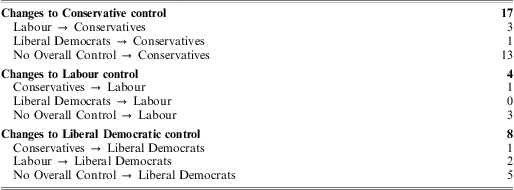
Note: Model 1 estimation sample.