Introduction
Changes in anthropometric indicators across generations provide information about improvements in the biological standard of living of a population. As evidenced by some authors, anthropometric measures such as height, but also weight adjusted for height, are useful tools to assess the well-being of both contemporary and historical populations (Komlos & Baur, Reference Komlos and Baur2004). However, whereas height reflects living conditions during growth years, especially in early childhood, body mass index (BMI), which is the most widely used measure of body fat based on height and weight, is a reliable indicator of short-term factors, such as education and income (Heineck, Reference Heineck2006; Komlos & Lauderdale, Reference Komlos and Lauderdale2007) and nutritional status after an individual's growth has been completed (Steckel, Reference Steckel1995; Linares & Su, Reference Linares and Su2005). There is also a long tradition of observational studies from developed societies linking overweight and obesity to low socioeconomic status (SES). Individuals in the lower socioeconomic group usually have a greater BMI and a higher prevalence of overweight and obesity (Sarlio-Lahteenkorva & Lahelma, Reference Sarlio-Lahteenkorva and Lahelma1999). Peracchi & Arcaleni (Reference Peracchi and Arcaleni2011) recently analysed the relationship between early-life environment and anthropometric measures in young Italian men born between 1973 and 1978, and found that the disease environment does significantly affect BMI, much more than income.
The increasing trends in BMI, and consequently the prevalence of overweight and obesity reported in developed Western societies, represent a threat to public health, as obesity is related to several morbidities and disabilities (Gallus et al., Reference Gallus, Colombo, Scarpino, Zuccaro, Negri, Apolone and La Vecchia2006; Cámara & Spijker, Reference Cámara and Spijker2010). As there is an association between BMI and health concerns, studies of variations in BMI may also help in defining variations in current and future health prospects. There is growing evidence that excess of weight is associated with many chronic diseases and all-cause mortality. Correlations have been found with the major causes of metabolic, cardiovascular, neoplastic, digestive tract and several other major diseases, and with premature mortality (Calle et al., Reference Calle, Thun, Petrelli, Rodriguez and Heath1999, Reference Calle, Rodriguez, Walker-Thurmond and Thun2003; Kenchaiah et al., Reference Kenchaiah, Evans, Levy, Wilson, Benjamin and Larson2002; Adami & Trichopoulos, Reference Adami and Trichopoulos2003; Hedley et al., Reference Hedley, Ogden, Johnson, Carroll, Curtin and Flegal2004; Flegal et al., Reference Flegal, Graubard, Williamson and Gail2005; McGee, Reference McGee2005). For example, it has been shown that the prevalence of hypertension and diabetes is significantly higher among obese Israeli conscripts, and also higher than in the female population (Bar Dayan et al., Reference Bar Dayan, Elishkevits, Grotto, Goldstein, Goldberg and Shvarts2005).
The main aims of this paper are to analyse changes in BMI in the second half of the twentieth century, focusing on two cohorts born in 1951 and 1980, and to highlight territorial differences among the three macro-areas of Italy, namely the North, Centre and South (which includes the island of Sardinia). The paper also examines how the correlates of high and low BMI have changed over time. Specifically, the role of socioeconomic factors, mainly education, and the relationship between BMI and a range of disease outcomes – particularly physical and psychological disorders, for which an association has been found in the literature – was analysed.
Data were obtained from medical examination records for a sample of provinces throughout Italy. The choice of these two cohorts lay in the interest in capturing the inter-generational variability in height, weight, social mobility and health patterns, i.e. differences between two generations of ‘fathers’ and ‘sons’ over a time-span of 30 years. Since military service was compulsory for all young men until the birth cohort of 1985, which implies that all young men had to submit to a medical examination at the age of 18–19, data from military archives provide new insights into the living standards in Italy in the second half of the twentieth century. Unlike surveys derived from interviews, body mass was measured directly by a competent medical team without being unduly intrusive (Burkhauser & Cawley, Reference Burkhauser and Cawley2008). In addition, the dataset includes some socioeconomic indicators, such as the education level of conscripts, and details of reported diseases that in extreme cases led to young men being excluded from military service.
The second half of the twentieth century is an interesting setting in which to investigate changes between these cohorts, because Italy was undergoing an intense process of economic, social and cultural development. Economic growth caused the population to undergo profound transformations in reducing health risks. However, it also saw the advance of endemic health problems, such as diabetes mellitus, asthma and respiratory, cardiovascular and psychological diseases, particularly in the juvenile phase; correlated with this evidence was the nation-wide increase in overweight (Costa-Font et al., Reference Costa-Font, Fabbri and Gil2009). Significant increases in BMI between the two Italian cohorts has led to the postulation of a change of factors that drive weight gains. For young men born in 1951 (measured in 1970), higher values of BMI should be considered a marker of economic development at a time when Italy was evolving towards modernity, with the possibility of better nutrition (both qualitative and quantitative) and, in general, improved standard of living. In contrast, 30 years later, the significant increase in the percentages of young adults who were overweight and obese, caused by changes in social and physical environment, have raised health concerns in the 1980 cohort.
Quantile regressions were used to ascertain how the health determinants of overweight and obesity come into play, and the effects of determinants over the complete distribution of BMI were compared. This econometric technique kept this work close to that of other papers in the literature (Atella et al., Reference Atella, Pace and Vuri2008; Auld & Powell, Reference Auld and Powell2009). These studies shared the idea of estimating heterogeneous parameters of the response variable distribution.
It is hypothesized that, in a poor, non-uniformly developed social context, higher BMI is correlated with a higher educational level and underweight with a lower one, whereas it is likely that the burden of overweight shifted to low socioeconomic status when Italy was transformed to a modern wealthier country. Moreover, it is hypothesized that overweight and obese people run higher risks of diseases such as diabetes mellitus.
Data
The data used in this study were taken from the archives of various military districts situated in the North, Centre and South of Italy, collected in a single database. Information refers to young men born in 1951 and 1980 who underwent a medical examination to ascertain their fitness for military service in the Army in 1970 and 1998, respectively. The rigorous selection procedures of the Italian armed forces, aimed at recruiting individuals who were free of disease and physically and mentally robust, was compulsory for all Italian men at the age of 18 (although the 1951 cohort was examined at age 19). However, this difference should not bias results considering the relatively long time-span (30 years) between the two cohorts and, more importantly, the recent phenomenon of acceleration of maturity, which implies that, over time, final adult stature is achieved at earlier ages (Sanna, Reference Sanna2002; Kryst et al., Reference Kryst, Kowal, Woronkowicz, Sobiecky and Cichocka2012).
The data collected include the following variables: (i) socio-demographic: family name, date of birth, place of birth and of residence, profession, education (highest level attained, last class attended); (ii) anthropometric: height while standing (height while sitting, only for 1980), chest and abdominal perimeters, weight; (iii) health: pathologies, disabilities, physical and mental impairment recorded for conscripts judged temporarily or permanently unfit. The quality and quantity of information do not vary greatly between the two cohorts, except for 1951, for which the richness of data on health status and education is greater.
The original files consisted of 111,834 observations for the 1951 cohort for some areas of Italy (listed in the next paragraph) and 162,295 observations for the 1980 cohort for all of Italy. To ensure spatial homogeneity, for the 1980 cohort only those areas included in the 1951 dataset were considered, resulting in 112,891 observations. After a correction procedure that deleted observations with missing data for variables of interest, duplicates and implausible values, the dataset consisted of 111,349 individual records for the 1951 cohort and 111,308 for the 1980 cohort. The exclusion of some observations led to a small reduction in the population: −0.43% (1951) and −1.4% (1980). Given the small percentage of observations that were deleted and the large size of the sample considered, their exclusion should not raise selection issues.
The use of this unique dataset at micro-level for Italy has several important advantages. First, the compulsory nature of military service in Italy guarantees nearly complete coverage of the male population, at least for the areas investigated. Second, the database provides information not only on conscripts' height but also on their weight, so that the related BMI measure can easily be calculated when studying the prevalence of overweight and obesity. Note that BMI is defined as an individual's body weight divided by height squared and can be applied to both adult men and women. Four categories are generally used to classify adults: (i) underweight=BMI<18.5; (ii) normal weight=BMI 18.5–24.9; (iii) overweight=BMI 25–29.9; (iv) obese=BMI≥30. In addition, information on height and weight were not self-reported, and consequently do not suffer from the potential biases found in the literature, according to which people tend to overestimate (or over-report) their height and underestimate (or under-report) their weight (Bolton-Smith et al., Reference Bolton-Smith, Woodward, Tunstall-Pedoe and Morrison2000). Lastly, as for heights and weights, details of physical and mental diseases or imperfections were the result of medical examinations made by the teams of Army doctors, so they are not biased in the way self-reported data are. According to the medical diagnoses, young men were classified as fit or unfit for military service; the latter, which were unlikely to be restored to fitness within one year, were medically discharged.
However, this dataset has some limitations. The findings inferred from the study are only from the male population; no data were available for women. Moreover, despite the popularity of BMI in scientific studies, ‘BMI is recognized as a noisy measure of fatness because it does not distinguish fat from muscle, bone, and other lean body mass,’ (Burkhauser & Cawley, Reference Burkhauser and Cawley2008). Some other issues are connected with selection biases deriving from the conscription process, since in a few special cases (residents abroad, people already enrolled in the military system as volunteers, or very sick people with documented serious disability) the exemption from military service was made without the need for a further medical examination (Peracchi & Arcaleni, Reference Kryst, Kowal, Woronkowicz, Sobiecky and Cichocka2011). Concerning the lack of data on conscripts enrolled in the Navy, these authors suggest that: ‘at the national level, excluding the Navy draft should not cause important biases,’ (ibid, p. 254). Moreover, although data on diseases may be considered an extraordinary source revealing changes in the well-being of the male population, they are not perfect. First, both the number of subjects to be recruited has changed radically over time, in relation to the needs of the armed forces, and recruitment policies have played a key role in establishing recruitment regulations, causing variations in the requirements for being declared fit or exempt from military service. For the 1951 cohort, discharge for medical reasons was not common, due to the diplomatic and political tensions in the 1970s related to the international threat of war, whereas for the younger generation born in the 1980s, before the abolition of compulsory military service, being declared unfit for military service was one way of not wasting time to complete education, generally at university. Second, developments in medical science and disease diagnostics may make the comparability of disease classifications across cohorts debatable; this implies the difficulty of using a single classification for both cohorts. A team of doctors participating in the Sardinia Research Unit proposed a classification of diseases to ensure comparability between the cohorts based on both aetiology and anatomical site of the body, according to the ‘List of physical impairments and diseases for being declared unfit for military service’ applied to the 1951 and 1980 cohorts. According to the above List, the reasons for being declared unfit (temporarily or permanently) for military service were summarized in thirteen categories (listed in Table 2), which describe the corresponding articles of the Decrees associated with the reasons for unfitness. In spite of the above limitations, these data recorded by physicians provide a unique picture of conscripts' health status, and this is the first time that the whole dataset has been used for scholarly research.
Descriptive statistics
Changes in conscripts' BMI
In order to describe changes in BMI, much effort was spent on creating a common platform for the two cohorts of conscripts to facilitate temporal and geographical comparisons, in view of the territorial heterogeneity between the two datasets for the 1951 and 1980 cohorts. In fact, only some regions or macro-areas for the 1951 cohort were included, but all regions were included in the 1980 database. For this reason, a homogeneous subsample of people who were born and lived in the same geographical area was collected in two steps. First, the municipalities comprised in both databases, which had a large number of observations, were merged in order to maintain the same administrative units. In particular, provinces which were recorded in one dataset (that for 1951) but not in the other (1980), and vice versa, were not considered. Then provinces were grouped into three macro-areas, representing the North, Centre and South of Italy. The distribution of the sample by geographical Italian macro-area, region and province is as follows: North: Veneto (Belluno, Padova, Rovigo, Treviso, Venice) and Lombardy (Pavia); Centre: Umbria, Tuscany (Arezzo, Florence, Prato, Pistoia) and Latium (Rome); South: Apulia (Bari, Brindisi, Foggia, Lecce, Taranto), Calabria (Catanzaro, Cosenza, Crotone, Reggio Calabria, Vibo Valentia) and the island of Sardinia. Data for the north-eastern provinces of Tuscany refer to the cohort of 1950, as the 1951 cohort data were not available.
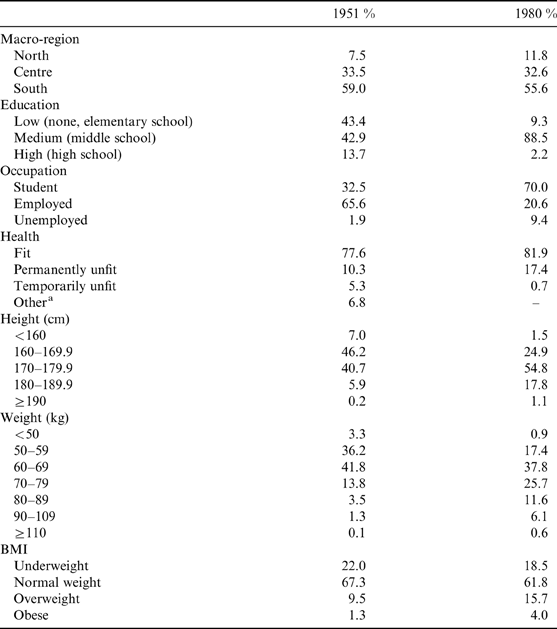
Lastly, to avoid the influence of the massive migration flows undergone by the 1951 cohort, especially from South to North, the dataset included only those individuals who were born and lived in the same geographical area, thus excluding all those who had moved to areas other than those of their birth. This necessary restriction tends to eliminate the effects of differing environmental conditions on BMI for those who migrated, since information on their age at the time of their move was missing, as were the environmental circumstances they had encountered during their lives. The fact that BMI may reflect both environmental effects and features of within-country migration is also evidenced by Peracchi & Arcaleni (Reference Peracchi and Arcaleni2011). The general dataset, with complete data, was used when the focus was on the relationships between conscripts' health and anthropometric indicators, in which separate estimates for the two cohorts were made. Some adjustments were also necessary to guarantee comparability between the municipalities of the two datasets for 1970 and 1998 because, in the meantime, several provinces that had not previously existed were created. The restricted sample did not cover the whole territory of Italy uniformly: conscripts from districts in northern Italy are under-represented in the national sample, compared with other macro-areas (Table 1). However, the number of conscripts for analysing BMI trends was very large, with 87,405 observations for the 1951 cohort and 70,330 for the 1980 one. The exclusion of migrant people led to a reduction of the population that amounted to about −21.5% (1951) and −36.8% (1980).
Characteristics of sample of Italian conscripts born in 1951 and 1980

Number of observations: 87,405 for 1951 cohort and 70,330 for 1980 cohort.
a Other: individuals exempt for family or other reasons (e.g. religious vocation).
Table 1 shows that, in 1951, about 43% of young men had ‘no or only elementary schooling’. By exploring the category ‘low education’, which was comparable between cohorts, a reduction of about 30 percentage points was found in the youngest cohort; the increase in school participation rate emerged later since most of the young men born in 1980 were still attending high school. This was supported by the distribution of frequencies of occupation: 70% of conscripts were ‘students’ in 1998, versus 32% of their peers born 30 years before.
The health of young males born in 1980 has improved since the percentage of recruits declared fit for military service reached almost 82%, versus 77.6% of conscripts born in 1951. At the same time, a significant reduction in the proportion of men declared ‘temporarily unfit’ occurred, dropping to 0.7%, even if an increase of those declared ‘permanently unfit’ was found, from 10.3% of young males examined in 1970 to 17.4% of recruits examined 30 years later.
By analysing the evolution of mean height and weight of the two cohorts, it emerges that the mean height increased over time: men born in 1980 were on average 4.5 cm taller than their peers born 30 years before (173.6 cm for the 1980 cohort, 169.1 cm for the 1951 cohort). Whereas the youngest cohort had a mean weight of 62.7 kg, the oldest one had a value of 69.5 kg (data not shown). Looking at weight, men weighing under 60 kg were less frequent in the recent cohort, whereas the percentage of those weighing over 70 kg increased. However, weight gains are partly explained by a sustained increase in height, as shown in Table 1. Specifically, the share of conscripts taller than 170 cm increased, whereas the number of very short conscripts (less than 160 cm) sharply decreased. Most interestingly, the distribution of BMI reported in the last part of Table 1 indicates a ‘re-allocation’ of conscripts, from underweight and normal-weight categories in the 1951 cohort, to overweight and obese classes for those born in 1980. The mean BMI increased over time in all macro-areas of Italy: men born in 1980 on average reached 0.7 BMI points more than their peers born 30 years before. The younger cohort had a mean BMI of 22.6, the older one 21.9. The areas that had the greatest increases in BMI were South Italy and Sardinia (from 21.9 to 23.1), whereas North and Central Italy had the lowest (data not shown).
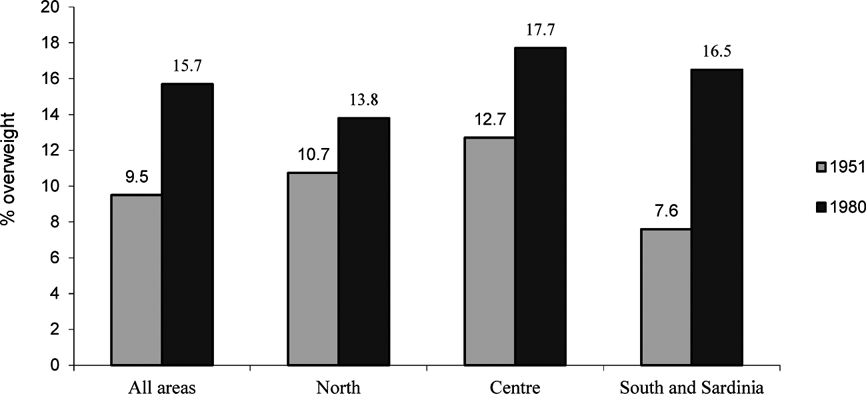
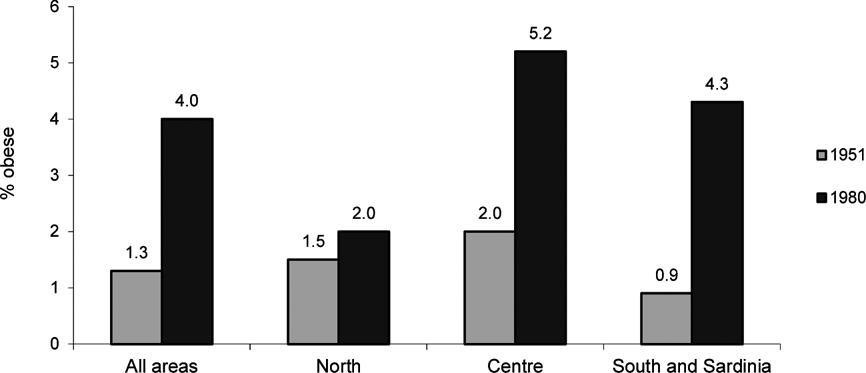
Figures 1 and 2 show the prevalence of overweight and obesity, respectively, in the two cohorts by macro-area. During the 30-year period across generations, the percentage of overweight in the 18-year-olds increased from 9.5% to 15.7%, and the prevalence of obesity increased significantly from 1.3% to 4%. However, a clear macro-regional disparity emerged. The percentage of overweight conscripts measured in 1970 was higher in the Centre and North areas than in the South but, during the whole period, the proportion of overweight conscripts increased to a greater extent in the South. Figure 1 shows that, among young men resident in the South and Sardinia, the percentage of overweight conscripts born in 1980 had doubled compared with those born in 1951.
Percentages of overweight conscripts by macro-area of Italy (BMI: 25–29.99 kg/m2).
Percentages of obese conscripts by macro-area of Italy (BMI≥30 kg/m2).
A similar North–South gradient was found for obesity. Figure 2 shows that 18-year-old men in the South were more often obese than those living in the North, whereas a significant increase in obese men in the South emerges, contributing towards explaining the rise in BMI and its highest value in the 1980 cohort.
The increase in BMI between the two cohorts may be explained by the higher standard of living of new generations. Younger Italian conscripts born in a wealthier modern society benefited from social and economic improvements, undergoing a significant increase in BMI. The greater increase in the proportions of overweight and obese in the less privileged areas (South Italy) compared with the more affluent areas of North Italy confirms results from previous studies on Italian adults (Pagano et al., Reference Pagano, La Vecchia, Decarli, Negri and Franceschi1997; Gallus et al., Reference Gallus, Colombo, Scarpino, Zuccaro, Negri, Apolone and La Vecchia2006). Differences in obesity prevalence according to geographic areas might be due to different socioeconomic status, lifestyle and dietary habits (Gallus et al., Reference Gallus, Odone, Lugo, Bosetti, Colombo, Zuccaro and La Vecchia2013). Undoubtedly, food consumption did increase considerably in Italy during the country's ‘economic boom’: a strong increase in consumption from 2850 kcal per day per person to 3600 has been shown. Despite a worldwide promotion of the ‘Mediterranean Diet’, a progressive change in local dietary habits in South Italy, with the progressive increase in consumption of meat, fats, milk and sugar, has been found. Specifically, an increase in cholesterol (+54%) and fat intake (+2% of total calories), with a reduction in fibre intake (−32%) could explain the greater increase of BMI of the population living in the South (Avellone et al., Reference Avellone, Di Garbo, Panno, Cordova, Abruzzese and Rotolo1994). Moreover, Barbagallo et al. (Reference Barbagallo, Cavera, Sapienza, Noto, Cefalù and Polizzi2002) found that the high total calorie intake indicates a quantitative more than qualitative problem, which may account for the large prevalence of overweight and obesity in the South. In addition to increased energy intake, lack of physical activity may also explain the increased prevalence of overweight in Italy (Brunello et al., Reference Brunello, Michaud and Sanz-de-Galdeano2009).
Changes in conscripts' diseases
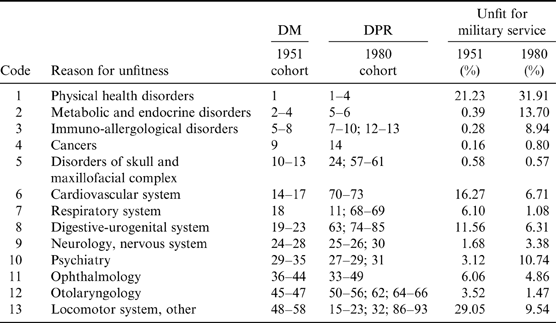
Table 2 lists the percentage of conscripts affected by specific diseases. Focusing on the 1951 cohort, physical health disorders were the most frequent disease group, together with diseases of the cardiovascular and digestive-urogenital systems. The high level of the category ‘Other’ may be explained by the prevalence of diseases of the locomotor system. It should be noted that impairments of the locomotor system, which were the most common pathologies in conscripts, also included severe deformities of both upper and lower limbs, often due to the after-effects of poliomyelitis. Before the introduction of compulsory vaccination for newborn babies with live attenuated vaccines, polio was endemic in most of the Italian population in an asymptomatic form but, for a small proportion of seriously affected people (2–5%), it could lead to paralysis of the limbs. Those who survived the more serious forms of polio had high levels of disability, i.e. an inability to use their limbs and physical deformities (Bussini et al., Reference Bussini, Lanari, Calzola, Minelli and Corsini2008).
Percentage of Italian conscripts declared unfit for military service for various reasons, by birth cohort
Notes: Medical discharge was based on two lists of impairments and diseases: DM, Italian Ministerial Decree issued on 29th November 1995; DPR, Decree of President of Republic, issued on 28th May 1964.
Number of conscripts declared unfit for military service was 9187 for the 1951 birth cohort and 7403 for that of 1980.
Looking at the diseases and disorders recorded for military conscripts born in 1980, the epidemiological scenario has clearly and substantially changed, reflecting the improved socioeconomic and health environment in which young people grew up. ‘Physical health disorders’ was the first most common cause of unfitness for military service (31.9%), although analysis of the diseases and impairments reveal that ‘frail constitution’ or ‘debility’ no longer appears, but several cases of obesity do. As noted above, young conscripts born in the wealthier 1980s had an excessive and unbalanced intake of calories and a sedentary life-style characterized by little physical exercise. Conversely, the percentage of cardiovascular, respiratory and digestive-urogenital diseases fell considerably. Diseases of the locomotor system were also substantially reduced. No cases of polio were found, thanks to the almost complete programme of vaccination against it. Of particular interest is the distribution of psychological disorders, which increased substantially in the 1951 cohort, from just over 3% in 1951 to nearly 11% in 1980.
One group of conditions that merits separate examination is that of ‘Metabolic and endocrine disorders’, which increased substantially from 0.4% to 13.7%. Diabetes mellitus was the most common diagnosis in this group, although it is difficult to distinguish between the relative contribution of modern medical technology, resulting in a greater degree of diagnostic precision than was possible 30 years before, and a true epidemiological increase. However, the progressive increase in diabetes of childhood is well documented in the medical literature (Bruno et al., Reference Bruno, Maule, Merletti, Novelli, Falorni, Iannilli and Iughetti2010). Lastly, immune-allergological diseases also rose from about 0.3% to 9%, in particular bronchial asthma, perhaps due to increasing pollution or related environmental causes.
Empirical framework
Quantile regression is a model that can consistently estimate the relationships between individual health status and BMI at different distribution quantiles (Koenker & Bassett, Reference Koenker and Bassett1978). The determinants of BMI by conditional distribution were examined, with particular focus on differences from the conditional means, which were of greater interest. For example, when analysing BMI, individuals who belong to both the lower and upper quantiles were considered to lack health standards, respectively in developing and developed countries. Let us consider here a linear model of BMI related to the f(*) of determinants, written as:
 $${\rm BMI} (i,t) = f(D, {\rm EDU}, A) \varphi + \varepsilon (i,t), \quad i=1,2, \ldots , n, \quad t=0,1$$
where the arguments of function f(*) include conscripts' variables of health status D, education (EDU) and geographical macro-area (A) of Italy. Vector D includes the disease categories used to declare conscripts unfit (temporarily or permanently) for military service, as listed in Table 2. Disease variables are included as dummy variables in the model to account for the differential effect on BMI distribution. The other variables control for the different propensity of BMI to education (high, medium and low) and the specific conditions of the environment (e.g. dummy for three Italian macro-areas), respectively; these variables are associated with the vector of parameters, ϕ, and ε (i, t) is the error term.
Basically, the objective function of individual BMI, under OLS, is expressed as:
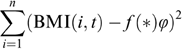 $$\sum ^n_{i=1} ({\rm BMI} (i,t) - f(*) \varphi )^2$$
where estimated vector  is the solution to the minimization of the sum of squared residuals of equation (2). Equation (1) may also be estimated with a quantile regression approach, which is a direct generalization of the least absolute deviation (LAD) technique proposed by Koenker & Bassett (Reference Koenker and Bassett1978). The regression specification for the θth conditional quantile of BMI is expressed as:
 $${\rm BMI} (i, t) =f(*)\varphi ^\theta + e^\theta (i, t),\quad i=1,2, \ldots , n,\quad t= 0, 1$$
where θ is the quantile of interest chosen in interval (0, 1), ϕθ is the vector of parameters, which now depends also on θ and e θ is the corresponding error term. The solution is obtained by minimizing the asymmetric weighted sum of absolute deviations conditioned on specific quantiles:
 $$\mathop {\rm min}_{\varphi \in R^k}\left[ \sum _{i:{\rm BMI} (i, t)\geq {\hskip1}f(*)\varphi } \theta |{\rm BMI} (i, t) - f(*) \varphi ^\theta | + \sum _{i:{\rm BMI} (i, t)< f(*)\varphi } (1- \theta)| {\rm BMI} (i, t)- f(*) \varphi ^\theta |\right]$$
where f(*)ϕθ is an approximation of the θth conditional quantile of the BMI distribution. As shown by Koenker & D'Orey (Reference Koenker and D'Orey1987), the parameters of estimation are then obtained by slight modifications of the minimization problem by simplex methods. If θ is 0.5, equation (4) turns into the LAD estimator, and f(*)ϕθ describes the effect of the variables of interest at the median of the BMI distribution. In addition, if θ is chosen from the upper tail of the BMI distribution, f(*)ϕθ will characterize the behaviour of obese individuals.
Results
Non-parametric estimates
Following epidemiological studies to identify the main health determinants of BMI, the health categories of vector D were reduced from thirteen to five and included a residual category of disease that collapses all pathologies for which a clear association is not given (physical health disorders; metabolic disorders; immuno-allergological disorders; psychological disorders; other). Dummy variables were used to account differentially for diseases that affected unfit conscripts rather than those who were fit for military service (reference group).
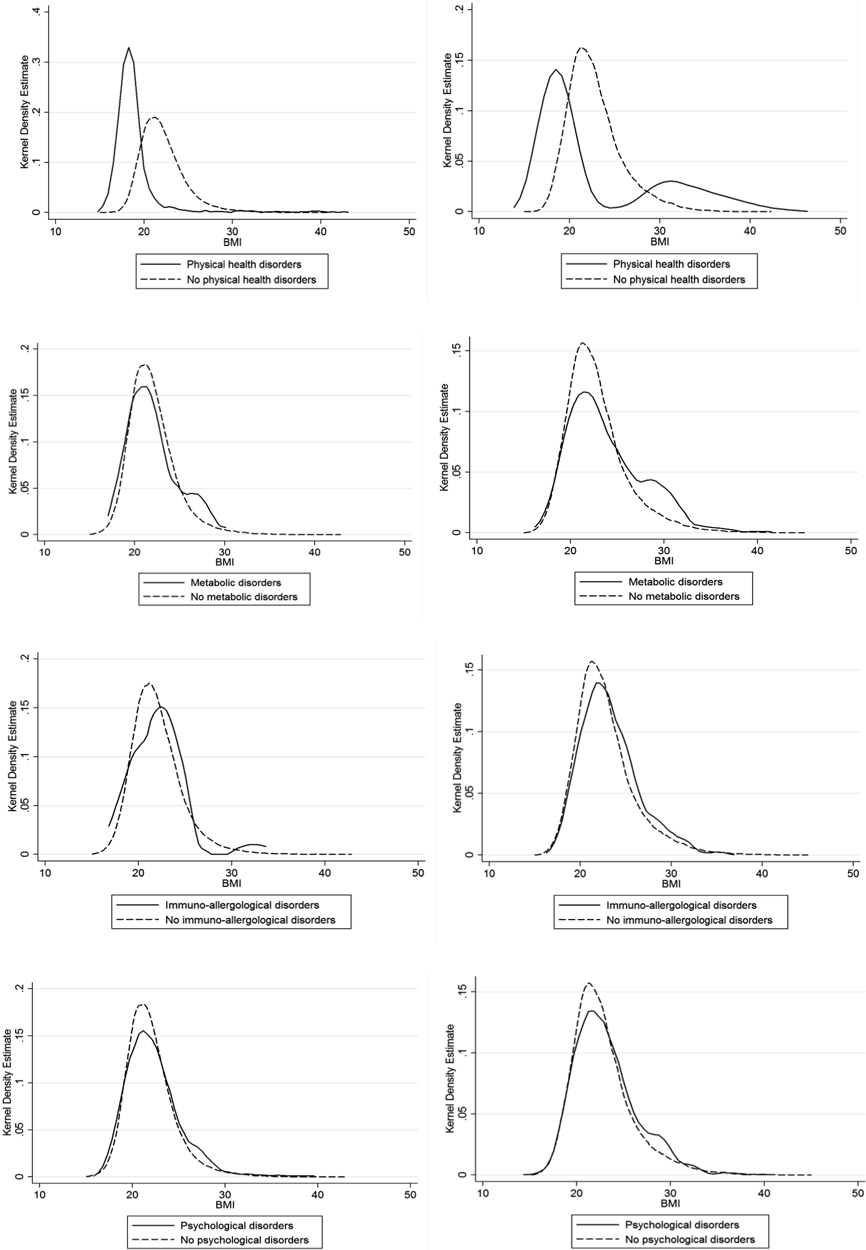
Figure 3 shows the estimates of Epanechnikov kernel density functions of BMI, to justify the use of quantile regression in each cohort for the four specific dummy disease variables, and to obtain a more comprehensive analysis of these relationships. The kernel distributions of BMI for conscripts with physical disorders are very different from those of conscripts who were fit for military service. The weaker physical constitution of the 1951 conscripts is shown by a low median BMI of around 19, three points below the median of conscripts without physical health disorders. This picture is partly confirmed for the 1980 cohort. Conscripts with physical health disorders were characterized by being underweight, although these differences compared with healthy conscripts were not generally significant. Instead, the onset of the prevalence of conscripts with weight problems is clearly recorded, as shown by the slight hump around the limit defining obesity (BMI≥30).
Kernel density estimates of BMI by disease and cohort (1951, on the left; 1980, on the right).
Conditional BMI distribution in the 1980 cohort confirms that metabolic and immune-allergological disorders, arising from industrialization and changes in modern society, are partly associated with increased body weight. The group with psychological disorders showed differences in BMI in the overweight region (BMI=25–29.9) in the 1951 cohort, and these differences were even higher in the 1980 cohort.
Quantile estimates
Models in anthropometric equation (3) were estimated by quantile regression, and OLS estimates were used to compare results. Non-parametric estimates showed that conscripts responded heterogeneously in terms of BMI to a range of specific pathologies – physical health disorders, metabolic and immune-allergological disorders – for which an association has also been found in the literature. The control variables were place of residence, aggregated at macro-region level, as it was assumed that changes in this anthropometric indicator would be more subject to the short-term influence of socio-environmental factors, and education.
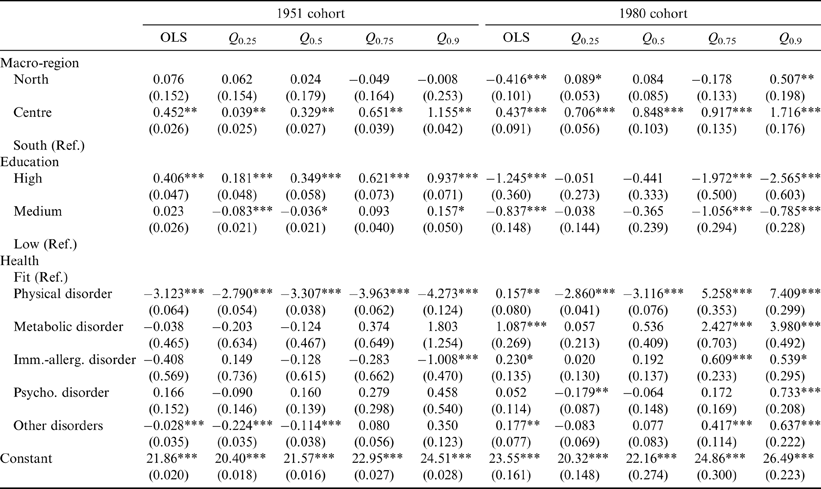
Table 3 lists BMI estimates for selected quantiles from 0.25 to 0.90 of the distribution. Irrespective of the model used, the estimated parameters of the covariates are generally of the expected sign in both cohorts. The OLS estimates for the 1951 cohort indicate that higher education was positively correlated with BMI. More highly educated conscripts were more likely to come from wealthier families, in which education could be guaranteed; consequently, they had more favourable economic living conditions, which were reflected in a higher BMI. A growing positive relationship across the quantile regression between BMI and education was found for conscripts born in 1951, although medium-educated people under the median of the distribution had a lower BMI compared with those with low education. As already argued by Padez (Reference Padez2006), this result is partly explained by the influence of type of occupation on anthropometric measures, since in a not completely developed economy like Italy's, the majority of conscripts (65%) were employed in manual work – which is correlated with low education – and had greater muscle mass, which resulted in an increase in body weight.
OLS and quantile regression of BMI of Italian conscripts by birth cohort
Notes: Coefficients are listed. Standard errors in parentheses.
***Significant at 1% level; **significant at 5% level; *significant at 10% level.
An inverse correlation between education and BMI was found in the 1980 cohort. The estimates of the highly educated group indicate a decrease of more than 1 point in BMI (−1.245; SE=0.360) compared with low-educated conscripts. This result is emphasized in the estimates at the 75th and 90th percentiles of the BMI distribution – which includes most of the overweight and obese conscripts – indicating that more highly educated people have from −1.972 to −2.565 points of BMI, respectively, compared with the low-educated group. The latter evidence matches the findings of Rasmussen et al. (Reference Rasmussen, Johansson and Hansen1999) and Stam-Moraga et al. (Reference Stam-Moraga, Kolanowski, Dramaix, De Backer and Kornitzer1999), who showed a higher prevalence of obesity in subjects with low levels of education in Sweden and Belgium, respectively.
The set of regressions in the 1951 cohort show a disease-specific association between the occurrence of certain diseases and BMI. The OLS estimates indicate that, of the four specific pathologies, only ‘physical health disorders’ are negatively correlated with BMI, reducing the size of this indicator for conscripts affected by such disorders by more than 3 points. Estimates show that the association between the group ‘physical health disorders’ and BMI in the two cohorts marks the onset of the negative effect of ‘modern diseases and disorders’ linked with weight gains in young adults. Starting from the 1951 cohort, a negative linear association is evident, which becomes larger when estimated at the 75th (BMI=−3.96) and 90th percentiles (BMI=−4.27). This means that conscripts affected by physical disorders are more likely to have a systematically lower BMI than healthy people; therefore, the negative effect on BMI indicates a problem of underweight. Comparing these results with the specification estimated for the 1980 cohort, a different pattern may be noted. Specifically, BMI at the 75th and 90th percentiles is significantly higher (5.25 and 7.40 BMI points) than that of conscripts who were declared fit for military service.
Metabolic disorders and immune-allergological diseases generally turn out to be non-significant. The main motivation may reside in the small proportion of conscripts born in 1951 affected by these diseases, a limitation that reduces the significant (negative) correlation of immune-allergological disorders with BMI at the 90th percentile. This picture changes completely in the 1980 cohort, since the association between metabolic disorders and BMI is strong. A positive relationship between being affected by metabolic disorders (which, as shown previously, included a large proportion of conscripts with diabetes) and BMI was observed. The BMI increase of 1.087 in the OLS estimates is largely due to the overweight and obese groups at the 75th and 90th percentiles of BMI, which is two and more than three times larger than that of OLS, respectively (BMI=2.42 and 3.98, respectively). This result suggests that men with metabolic problems are more likely to be overweight and obese. It has in fact been estimated that more than 80% of people with diabetes are overweight or obese, probably accounting for the increasing phenomenon of ‘diabesity’, providing evidence of the close association between obesity and diabetes.
As expected from non-parametric estimation, the quantile estimates of immune-allergological disorders in the 1980 cohort show a positive correlation with men's BMI at the 75th and 90th percentiles, whereas they are barely significant in OLS. Although this result confirms a close association, a causal relationship between asthma, the main problem recorded in this disease category, and overweight, cannot be inferred because longitudinal data would be needed for identification.
Another interesting result is the association between psychological disorders and BMI, although the effects of this category reveal significant differences across the BMI distribution for men born in 1951 and 1980. In the 1951 cohort, quantile estimates indicate a general increase in the BMI of conscripts with psychological disorders, compared with men fit for military service, whereas a ‘diversion mean (or median) process’ is at work in the 1980 cohort, where point estimates above and below the median have an inverse sign. As a health indicator, being underweight and overweight or obese are significant for conscripts with psychological problems. Differences in BMI indicate a point estimate of about −0.18 at the 25th percentile, whereas conscripts with psychological disorders have a higher BMI (0.73) at the 90th percentile. That is, the risk of being overweight or obese increases for young men affected by psychological disorders, a result that is explained in the medical literature by reduced physical activity and the tendency to isolate oneself or to develop unsuitable dietary habits (Onyike et al., Reference Onyike, Crum, Lee, Lyketsos and Eaton2003).
Robustness analysis: probit estimates for BMI subgroups
In this section, probit regression is used to validate the previous results by a twofold strategy. First, the probabilistic models addressed to the BMI mean of the distribution are estimated to compare the results with the OLS estimates; second, separate probit regressions for specific BMI categories are specified to verify whether these estimates match those obtained at different quantiles. Although quantile regression accounts for different individuals' weight changes in specific diseases, it may not identify how determinants of BMI mean differ from those of overweight and underweight people. Kowalski (Reference Kowalski2009) and Pieroni & Salmasi (Reference Pieroni and Salmasi2012) have shown that the quantiles of unconditional and conditional BMI distributions generally differ.
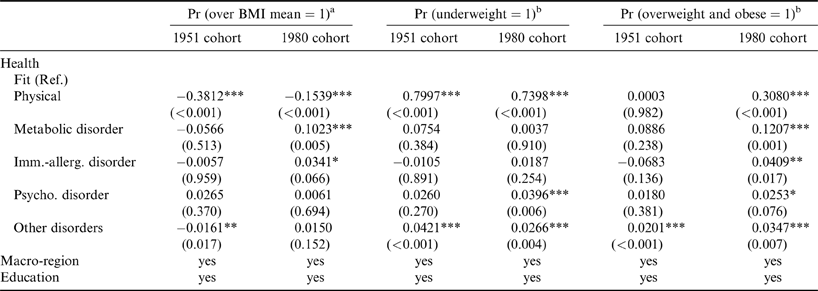
Probit estimates, which use conscripts with BMI over the mean as a dependent variable, are in most cases similar to the OLS estimates of BMI, in terms of signs and statistical significance. The first two columns of Table 4 show the marginal effects of conscripts unfit for military service by disease, indicating, for example, that suffering from physical health disorders in the 1951 cohort reduces the probability of being over the BMI mean by about 38% compared with enrolled conscripts. Improvements in nutrition for the 1980 cohort, emphasized above, are shown by the fall in disparities of conscripts affected by a weaker physical constitution (15%). As in OLS, metabolic disorders and immuno-allergological diseases became important in the 1980 cohort, as shown by the increased weight of conscripts suffering from these illnesses.
Probit regressions of marginal effects for conscript samples over BMI mean, underweight, overweight and obese, by birth cohort
a Reference modality is conscripts under BMI mean.
b Reference category is normal weight.
Macro-region and education are used as control variables.
p-values are given in parentheses: ***significant at 1% level; **significant at 5% level; *significant at 10% level.
In order to conduct additional tests on the non-linear effects of diseases on BMI across cohorts, ‘underweight’ and ‘overweight and obese’ categories of BMI were used as dependent variables in probit regressions, in which ‘normal-weight’ BMI category was utilized as a benchmark (see Table 4). As expected, the marginal effects of individuals with physical health disorders show a probability exceeding 70% – compared with the ‘normal-weight’ category – of belonging to the underweight group, irrespective of conscript cohort, and statistically significant at 1%. An increase in the probability of being underweight for conscripts with psychological disorders is found in the 1980 cohort, although the magnitude is not large (about 4%). The results from probabilistic models, which use as a response variable overweight and obese conscripts, indicate that the social and economic changes in the younger generations made physical health disorders an important reason for unfitness correlated with weight excess. In addition, the positive marginal effects for metabolic disorders (12%) and immuno-allergological diseases (4%) in the 1980 cohort are fully consistent with the significant increase in BMI in quantile regressions at the 75th and 90th percentiles.
Conclusions
This paper exploits the richness of micro-data for two generations of Italian conscripts (born in 1951 and 1980) to investigate changes in BMI and the association between this anthropometric indicator and diseases. As the values of BMI are positively correlated with changes in economic and social variables over time, this index may represent a marker of the well-being of the Italian population in the 1951 cohort. However, improvements in economic well-being also generate negative effects, represented by the large increase in the quota of overweight and obese individuals in the 1980 conscript cohort.
The results suggest that in a poor and not uniformly developed economic and social context, overweight and underweight men tend to be concentrated in high and low socioeconomic status groups, respectively (Monteiro et al., Reference Monteiro, Moura, Conde and Popkin2004). It is only during and after the transition to a modern wealthier society that the burden of overweight shifts to low socioeconomic status groups, as evidenced by several studies in Italy, which have shown that low socioeconomic groups are exposed to overweight and obesity (Gallus et al., Reference Gallus, Colombo, Scarpino, Zuccaro, Negri, Apolone and La Vecchia2006).
Actually, the most developed countries are undergoing a kind of ‘obesity transition’, in which the problems of undernutrition are replaced by those of overnutrition (Osmani & Sen, Reference Osmani and Sen2003). The second half of the 20th century was characterized by substantial improvements in standard of living conditions, which also included profound changes in diet and life-style, suggesting the greater availability of food of higher quality.
The quantile regression results show that, in the 1980 cohort, overweight and obese conscripts suffered from more metabolic or physical disorders, and the parameters of immune-allergological and psychological disorders, categories linked with modern society and the environment, became significant. In particular, the disease group including diabetes shows ample magnitude in the estimated parameter of BMI.
These heterogeneous effects on BMI should be considered when policies are designed to reduce overweight, indicating that a targeted, tailored approach would be most effective. The increasing trend in BMI values also indicates that policies preventing weight gains should be considered, since overweight and obese people run higher risks of future morbidity and mortality (Negri et al., Reference Negri, Pagano, Decarli and La Vecchia1988; Bianchini et al., Reference Bianchini, Kaaks and Vainio2002; Flegal et al., Reference Flegal, Graubard, Williamson and Gail2007), which may consequently exacerbate public health costs (Monheit et al., Reference Monheit, Vistnes and Rogowski2009). A key issue for future research is to use data designed to capture the effect of various potential policy interventions in some diseases, such as checks in young people of the progressive increase in diabetes mellitus.
Acknowledgments
This paper is part of the Research Project of National Interest entitled ‘Stature, health and migration: Italian conscripts’ (PRIN, 2004) funded by the Italian Ministry of University and Research. The main outcome of this project was the creation of a database collecting demographic, anthropometric, socioeconomic and health information on 1951 and 1980 birth cohorts taken from military records, preserved in the archives of military districts. The database used in this study was corrected by Professor De Iasio, who was asked to edit the database for errors, incongruence and so on. The authors thank him for his valuable work. In addition, they are grateful to participants in the European Population Conference, held in Stockholm on 13–17th June 2012, for their valuable suggestions on an earlier version of the manuscript.