Introduction
Major depressive disorder (MDD) is one of the most prevalent mental disorders in the world and is characterized by negative mood, cognitive dysfunction, and decreased interest (Collaborators, Reference Collaborators2022). Given its adverse effects on individuals and society, a great deal of research is anticipated to develop effective intervention programs by providing insight into its brain mechanisms. Current research, usually using the functional magnetic resonance imaging (fMRI) technique, suggests that MDD is likely to be associated with the alteration of large-scale networks rather than specific brain regions (Hamilton, Farmer, Fogelman, & Gotlib, Reference Hamilton, Farmer, Fogelman and Gotlib2015; Stern, Reference Stern2022; Thiebaut de Schotten & Forkel, Reference Thiebaut de Schotten and Forkel2022). Contrary to the spatial dimension, the time scale or frequency is a major determinant of brain functions, which is usually impaired in mental disorders including MDD (Buzsáki, Reference Buzsáki2006; He et al., Reference He, Cui, Zheng, Duan, Pang, Gao and Chen2016; Qiao, Wang, & Wang, Reference Qiao, Wang and Wang2022b). Converging evidence suggests that MDD is a brain-wide spatiotemporal disorder (Guo et al., Reference Guo, Liu, Dai, Jiang, Zhang, Yu and Xiao2013; Sheng et al., Reference Sheng, Shen, Qin, Zhang, Jiang, Li and Wang2018; Wang et al., Reference Wang, Kong, Li, Su, Zeng, Zhang and Si2016).
The global signal (GS) of fMRI time series is the grand average of signals across all gray matter voxels, reflecting the overall state of brain activity (Ao, Ouyang, Yang, & Wang, Reference Ao, Ouyang, Yang and Wang2021). Researchers have long debated whether to regress out GS in fMRI studies due to its extensive influence on the functional connectivity (FC) among all brain networks (Murphy & Fox, Reference Murphy and Fox2017) and its particular significance for physiological and pathological states (Scalabrini et al., Reference Scalabrini, Vai, Poletti, Damiani, Mucci, Colombo and Northoff2020). The regression of GS usually induces negative FCs by modulating the phase of local signals (Anderson et al., Reference Anderson, Druzgal, Lopez-Larson, Jeong, Desai and Yurgelun-Todd2011; Gutierrez-Barragan, Basson, Panzeri, & Gozzi, Reference Gutierrez-Barragan, Basson, Panzeri and Gozzi2019; Zhang et al., Reference Zhang, Magioncalda, Huang, Tan, Hu, Hu and Northoff2019). The GS facilitates the synchronization of functional systems not solely through signal interactions, but also by fluctuated arousal (Orban, Kong, Li, Chee, & Yeo, Reference Orban, Kong, Li, Chee and Yeo2020; Raut et al., Reference Raut, Snyder, Mitra, Yellin, Fujii, Malach and Raichle2021) or glucose metabolism (Thompson et al., Reference Thompson, Riedl, Grimmer, Drzezga, Herman and Hyder2016). Therefore, the examination of GS and its correlation (GSCORR) with local signals presents a promising avenue for reconciling the disparate findings in various networks that are affected by MDD. Additionally, this investigation may uncover novel mechanisms or biomarkers that can aid in the treatment of MDD.
Altered GS and GSCORR have been found in multiple mental disorders, such as schizophrenia (SCZ) (Wang et al., Reference Wang, Liao, Han, Li, Wang, Zhang and Chen2021; Yang et al., Reference Yang, Murray, Glasser, Pearlson, Krystal, Schleifer and Anticevic2017; Yang et al., Reference Yang, Murray, Repovs, Cole, Savic, Glasser and Pearlson2014), bipolar disorder (BD) (Zhang et al., Reference Zhang, Magioncalda, Huang, Tan, Hu, Hu and Northoff2019), and MDD (Han et al. Reference Han, Wang, He, Sheng, Zou, Li and Chen2019; Scalabrini et al. Reference Scalabrini, Vai, Poletti, Damiani, Mucci, Colombo and Northoff2020; Zhu et al. Reference Zhu, Cai, Yuan, Yue, Jiang, Chen and Yu2018). The SCZ patients often exhibit increased GS variability and GSCORR, whereas the BD patients have increased and decreased GSCORRs in different regions and mental states. For MDD patients, an increased, decreased, and unchanged GS and GSCORR in different regions or states have also been reported. These findings suggest that GS and GSCORR may serve as disease-specific biomarkers. However, their alterations in MDD have not reached a consensus.
In terms of the temporal dimension, the GS has a unique temporal structure that evolves throughout the lifespan (Ao et al., Reference Ao, Kou, Yang, Wang, Huang, Jing and Chen2022). The interaction between GS and local signals is also constrained by time scales (Wang et al., Reference Wang, Yang, Li, Ao, Jiang, Cui and Jing2023). The temporal characteristics of GS and its interaction with local signals have been frequently observed to be disturbed by mental disorders. For instance, altered GSCORR has been found in adolescent-onset schizophrenia patients in slow-5 (0.01–0.027 Hz) but not slow-4 (0.027–0.073 Hz) (Wang et al., Reference Wang, Liao, Han, Li, Wang, Zhang and Chen2021). For MDD, decreased static and increased dynamic GSCORR were reported (Han et al., Reference Han, Wang, He, Sheng, Zou, Li and Chen2019). Frequency-dependent alterations in FC as well as local activity have also been demonstrated in various diseases (Ries et al., Reference Ries, Hollander, Glim, Meng, Sorg and Wohlschlager2019; Yang et al., Reference Yang, Zhang, Meng, Wohlschlager, Brandl, Di and Biswal2022; Yang et al., Reference Yang, Cui, Pang, Chen, Tang, Guo and Chen2021; Zhang et al., Reference Zhang, Zhu, Chen, Duan, Lu, Li and Chen2015). Frequency-dependent abnormalities in MDD tend to appear in slow-4 and slow-5 (Li, Qiu, Hu, & Luo, Reference Li, Qiu, Hu and Luo2022; Wang et al., Reference Wang, Kong, Li, Su, Zeng, Zhang and Si2016; Xue, Wang, Wang, Liu, & Qiu, Reference Xue, Wang, Wang, Liu and Qiu2016). These findings indicate that patients with MDD may exhibit a reduced GSCORR at particular frequencies.
In the current study, we investigated the altered frequency characteristics of GS variability and GSCORR in patients with MDD. To mitigate the effects of sampling and system biases, a multicenter resting-state fMRI dataset was utilized, resulting in a larger sample size and more generalizable results. Based on previous studies (Ries et al., Reference Ries, Hollander, Glim, Meng, Sorg and Wohlschlager2019; Wang et al., Reference Wang, Kong, Li, Su, Zeng, Zhang and Si2016), we hypothesized that patients with MDD would exhibit a frequency-dependent reduction of GS variability and GSCORR.
Materials and methods
Participants
All subjects in this study were obtained from the Strategic Research Program for Brain Sciences (SRPBS) (Tanaka, Reference Tanaka2020), which included 255 MDD patients and 524 healthy controls (HCs) from six sites (Tanaka et al., Reference Tanaka, Yamashita, Yahata, Itahashi, Lisi, Yamada and Imamizu2021). The severity of depression was assessed according to the Beck Depression Inventory, Second Edition (BDI-II). The written informed consent was obtained from each participant.
Imaging acquisition and preprocessing
All resting-state fMRI data were collected on 3.0-T MRI scanners, but from six locations, including Hiroshima University Hospital (HUH), Hiroshima Rehabilitation Center (HRC), Hiroshima Kajikawa Hospital (HKH), Center of Innovation at Hiroshima University (COI), Kyoto University TimTrio (KUT), and University of Tokyo Hospital (UTO). The participants were instructed to look at the fixation point, relax, stay awake, but not think about anything in particular, and not move their bodies. The details of scanner parameters for the six centers are shown in Table 1.
Imaging protocols for resting-state fMRI

Abbreviations: FoV, field of view; TR, repetition time; TE, echo time; HUH, Hiroshima University Hospital; HRC, Hiroshima Rehabilitation Center; HKH, Hiroshima Kajikawa Hospital; COI, Center of Innovation at Hiroshima University; KUT, Kyoto University TimTrio; UTO, University of Tokyo Hospital. Data link: https://doi.org/10.7303/syn22317081.
Resting-state fMRI image processing was performed using the DPARSF toolbox (http://www.restfmri.net) (Yan & Zang, Reference Yan and Zang2010). Preprocessing steps consisted of removing the first ten time points, slice-timing, realignment, coregistration, normalization to the Montreal Neurological Institute (MNI) space, spatial smoothing with an isotropic Gaussian kernel of 6 mm full-width at half-maximum, and nuisance regression. The linear trend, white matter, cerebrospinal fluid, and 24 rigid body motion parameters were regressed out in the last step. Subjects whose head motion of rotation >2.0̊ or translation >2.0 mm were excluded. The mean frame-wise displacement (FD) of each subject was further calculated to screen out participants whose mean FD was outside the range of the overall group mean plus three standard deviations (s.d.) (Power, Barnes, Snyder, Schlaggar, & Petersen, Reference Power, Barnes, Snyder, Schlaggar and Petersen2012). Participants without BDI-II scores were also not included in the analysis. To minimize potential bias in clinical diagnoses resulting from differences in centers, we excluded HC with BDI-II scores exceeding 16 and MDD subjects with scores below 16. Finally, Given the acknowledged correlation between depression and gender, we meticulously screened the HC individuals to ensure that the gender ratio closely resembled that of the MDD group. There remained 171 MDD patients and 165 HCs, whose demographic information is shown in Table 2.
Demographic and clinical variables

a Chi-squared test.
b Two-sample t test.
Abbreviations: MDD, major depressive disorder; HC, healthy control; BDI-II, Beck Depression Inventory- II.
For structural scans, we segmented the whole brain into gray matter (GM), white matter, and cerebrospinal fluid maps using the CAT12 toolbox (http://www.neuro.uni-jena.de/cat/) of SPM12 (https://www.fil.ion.ucl.ac.uk/spm/software/spm12/). Then we normalized the GM images to MNI space (voxel size 1.5 × 1.5 × 1.5 mm3) and smoothed them using a Gaussian kernel (4 mm full width at half maximum). The total gray matter volume (GMV) was obtained by summing the normalized, smoothed GM maps and used for subsequent analysis.
GSsd and GSpower
The GS of each subject at each time point was the mean signal of all gray matter voxels constrained by the binary Human Brainnetome Atlas (Fan et al., Reference Fan, Li, Zhuo, Zhang, Wang, Chen and Jiang2016; Wang et al., Reference Wang, Yang, Li, Ao, Jiang, Cui and Jing2023). We measured the GS variability in the entire frequency range with two indices: GSsd and GSpower. The GSsd was the time standard deviation value of the GS series, and the power spectrum of GS (GSpower) was obtained by transforming the GS time series into frequency domain using the Welch method with a Hamming window (window length = 16 TR, overlap = 50%) (Baria, Baliki, Parrish, & Apkarian, Reference Baria, Baliki, Parrish and Apkarian2011). Since the TR varies from site to site, we opted to limit the frequency range from 0.0012 to 0.1852 Hz based on the sampling theory, which ensures consistency in the bandwidth across sites (Proakis & Manolakis, Reference Proakis and Manolakis1988).
We regressed out age, gender, and site to control for demographic and environmental factors, as well as the total GMV to eliminate the effect of anatomical difference. The normalized residuals were used for subsequent statistical analysis. Two-sample t tests were performed to detect whether there were any group differences in GSsd and GSpower.
GSCORR
Aiming to alleviate any potential limitations of the slow5–slow2 filtering method based on electrophysiological signals for fMRI signals (Buzsaki & Draguhn, Reference Buzsaki and Draguhn2004), we applied the k-means clustering analysis to classify frequency bands. The t-value of the two-sample t test for GSpower in each frequency bin was used to distinguish frequency-specific effects of GSCORR. The optimal clustering number was determined as three using the Davies Bouldin evaluation (Tibshirani, Walther, & Hastie, Reference Tibshirani, Walther and Hastie2001). For each frequency band, we divided the gray matter into 246 regions-of-interest (ROI) using the Human Brainnetome Atlas and obtained the signal of each ROI by averaging all voxel signals in that region. The GSCORR was obtained by calculating the Pearson's correlation between GS and each ROI signal. R values were then transformed to z-scores using the Fisher's Z transformation (Fisher, Reference Fisher1915; Just, Cherkassky, Keller, Kana, & Minshew, Reference Just, Cherkassky, Keller, Kana and Minshew2007). Normalized residuals of GSCORR after regressing out age, gender, site, and total GMV were used for subsequent statistical analysis. At each band, two-sample t tests were used to detect differences between the two groups. Furthermore, we have employed commonly used slow 5–slow 3 and 0.01–0.08 Hz filtering methods to complement our findings.
Correlation analysis
If there were significant differences in GSsd, GSpower, and GSCORR between MDD patients and HCs, their associations with clinical symptoms (BDI-II scores) were further evaluated by Pearson's correlation analysis for each group.
Multiple comparison corrections were performed for both t test and correlation analyses (q < 0.05, FDR corrected) (Wilks, Reference Wilks2006).
Control analysis
In our data analysis, we considered the influence of age, gender, site, and total GMV, and we included them as covariates in our assessment of GS. To delve further into these variables, we conducted separate analyses exploring their associations with GS. For the MDD and HC groups, we used two-sample t tests to examine gender differences in GSsd, GSpower, and GSCORR. Additionally, Pearson's correlation coefficients were used to weigh age/total GMV correlations for both groups' GSsd, GSpower, and GSCORR. To enhance the robustness of our utilization of multicenter data, we conducted similar analysis steps at each collection site. Subsequently, in order to mitigate the impact of time series duration on GSCORR due to variability in collection times across the multicenters, we performed a separate analysis utilizing data collected from the COI site. The analysis was conducted with two different time lengths: one encompassing all time points from the site (230 in total), and the other using a subset of 110 time points. Finally, in light of the debate surrounding the information contained in the GS (Liu, Nalci, & Falahpour, Reference Liu, Nalci and Falahpour2017; Power, Plitt, Laumann, & Martin, Reference Power, Plitt, Laumann and Martin2017), we have taken outcomes derived from the GS regression analyses, which use the same rigorous data analysis process, to supplement our findings. The outcomes of control analysis can be found in the Supplementary Material.
Results
Demographics and clinical variables
Table 2 shows the demographic and clinical variable data for all subjects. The two groups exhibit no significant difference in terms of gender (χ2 = 0.03, p = 0.85, df = 334), hand (χ2 = 0.96, p = 0.33, df = 334), and age (t = 0.68, p = 0.50, df = 334). Likewise, the disparity in age distribution shows no statistical significance. The BDI-II scores were significantly higher in the MDD group (t = 34.00, p < 0.0001, df = 334).
Reduced GSsd in patients with MDD and its correlation with clinical scores
As shown in Fig. 1A, the GSsd was significantly reduced in patients with MDD compared with the HCs (t = −4.015, p < 0.0001, df = 334). Neither the MDD group (r = 0.044, p = 0.824) nor the HC group (r = 0.017, p = 0.566) exhibited a significant correlation between GSsd and BDI-II scores (see Fig. 1B). The findings of the subsamples COI (including 230 time points and 110 time points), HKH, HRC, and HUH were shown in online Supplementary Figures S1 – S5 consistently demonstrated lower GSsd in MDD compared to HC. Additionally, there was no significant correlation found between GSsd and BDI-II scores.
Altered GSsd in patients with MDD. (a). The violin figure shows the distribution of GSsd in HC and MDD groups, respectively. (b). The Pearson correlation between GSsd and BDI-II scores.

Reduced GSpower in patients with MDD and its correlation with clinical scores
The GSpower was significantly lower in the MDD group than in the HC group at all frequency points (Fig. 2A). The correlation between GSpower and BDI-II scores appeared positive in MDD and negative in HC (see Fig. 2B). Similar patterns were observed in the subsamples, with lower GSpower observed in MDD. Furthermore, the MDD showed a positive correlation between GSpower and BDI-II scores, whereas the HC group showed a negative trend (online Supplementary Figures S6 – S10).
Altered GSpower in patients with MDD. (a). The GSpower was reduced in patients with MDD at the full frequency range. FDR correction, q < 0.05. Red and blue shadows represent standard errors. (b). The Pearson's correlation between GSpower and BDI-II scores in the two groups.

Frequency-dependent alteration of GSCORR in patients with MDD and its correlation with clinical scores
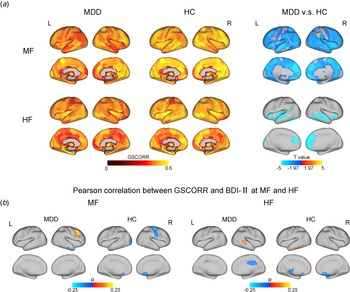
Based on the outcomes of the clustering process, we segregated the preprocessed image data into three distinct frequency bands: low frequency (LF: 0.0012–0.0728 Hz), medium frequency (MF: 0.0728–0.1383 Hz), and high frequency (HF: 0.1383–0.1852 Hz). The GSCORR was comparable between the two groups at the LF, but it was significantly reduced in almost the entire brain in the MDD group at MF band. Additionally, it was reduced in the default mode network (DMN: including the medial frontal cortex, medial temporal lobe, parahippocampal gyrus, lateral temporal lobe, and parietal lobe), salience network (SN: including the dorsal anterior cingulate cortex, anterior insula, amygdala, and thalamus), and sensorimotor network (SMN: including the precentral gyrus, postcentral gyrus, superior occipital gyrus, posterior inferior temporal gyrus, posterior insula, and superior temporal gyrus) at the HF (see Fig. 3A).
Frequency-dependent alteration of GSCORR in patients with MDD. (a). Reduced GSCORR in MDD patients at MF and HF bands, respectively. (b). The Pearson's correlation between GSCORR and BDI-II scores in the MDD and HC groups at MF and HF band, respectively. MF, medium frequency; HF, high frequency.

At the LF, there was no significant correlation between GSCORR and BDI-II score. However, at MF and HF bands, the correlations between GSCORR and clinical score were mainly observed in specific brain regions such as the middle frontal gyrus, inferior temporal gyrus, and occipital lobe. This observation, as depicted in Fig. 3B and Table 3, suggests that the brain-symptom association is expressed in different functional systems in patients and HCs. The results of subsamples COI, HKH, HRC and HUH are shown in online Supplementary Figures S11 – S15. The predominant differences in GSCORR were primarily observed at MF band, exhibiting a significant correlation with BDI-II scores in the frontal gyrus and occipital lobe. As a complement to our GSpower intergroup difference-based filtering approach, results with traditional frequency division of 0.01–0.08 Hz revealed that the GSCORR was comparable between the two groups and not significantly correlated with the BDI-II scores. However, applying slow5–slow3 filtering revealed a significant reduction in GSCORR in the MDD group at slow 3 band, which was further correlated with BDI-II scores. The MDD group showed a significant positive correlation between GSCORR and scores in the middle frontal gyrus, while the HC group showed a significant negative correlation between GSCORR and scores in the middle occipital gyrus and inferior temporal gyrus. These results were illustrated in online Supplementary Figures S16 and S17. Finally, results of the GS regression as a control analysis provided valuable insights. When controlling for GS, the significant difference in GSCORR between the MDD and HC groups at MF and HF bands were no longer observed. Additionally, GSCORR was not found to be significantly correlated with BDI-II scores (online Supplementary Figure 18).
Brain areas showing significant correlations between GSCORR and clinical scores

Relationships between GS and gender, age, and total GMV
For the gender effect, there was no significant difference (p > 0.05, FDR) in GSsd, GSpower, and GSCORR between males and females in either the MDD or the HC group (also see online Supplementary Figure S19). Regarding the age effect, GSsd and GSpower were negatively correlated with age in both the MDD and HC groups. Furthermore, we observed distinct patterns of significant correlation between GSCORR and age in the two groups, as seen in online Supplementary Figure S20. Lastly, our analysis of the relationship between total GMV and GS revealed that GSsd and GSCORR did not have a significant correlation with total GMV in either group. By contrast, GSpower in the MDD group showed a significant positive correlation with GMV, as shown in online Supplementary Figure S21.
Discussion
Using a multicenter resting-state fMRI dataset, we explored the altered variability of GS and GSCORR in MDD patients. These indicators were systematically reduced in MDD patients, especially at the medium frequency. As the brain signal variability (BSV) is indicative of the amount of kinetic energy that the brain can utilize to shift between various potential states (Garrett, McIntosh, & Grady, Reference Garrett, McIntosh and Grady2014; Wang et al., Reference Wang, Ao, Yang, Liu, Ouyang, Jing and Chen2020), and the GSCORR reflects a global reconciliation for multiple functional systems (Zhang and Northoff, Reference Zhang and Northoff2022), the reduced variability of GS and its interaction with local signals may indicate an impairment in the coordination among various functional systems in patients with MDD. Fortunately, the patients may invoke the association cortex to cope with the increase in depression, as shown by a positive correlation between GS indicators and depressive scores, primarily in the association cortex. In addition, we investigated a subset of data gathered from singular site and discovered that the outcomes from these centers paralleled the combined outcomes from multicenter effectively, validating the trustworthiness of utilizing data from multi-site. Moreover, the findings were consistent between the complete (230 time points) and the reduced (110 time points) subsets of data acquired from the COI site, indicating that the scanning duration minimally impacts GS. In addition to validating our findings through classical filtering methods and GS regression, we observed that gender, age, and total GMV show significant associations with GS. These variables should be controlled when assessing the clinical implications of GS.
Reduced GS variability in patients with MDD
We employed the GSsd and GSpower to measure variabilities in the GS (Tolkunov, Rubin, & Mujica-Parodi, Reference Tolkunov, Rubin and Mujica-Parodi2010). The BSV has been demonstrated to have a close relationship with brain functions and psychiatric disorders (Garrett et al., Reference Garrett, Samanez-Larkin, MacDonald, Lindenberger, McIntosh and Grady2013; Li et al., Reference Li, Wang, Ye, Chen, Huang, Cui and Chen2019; Månsson et al., Reference Månsson, Waschke, Manzouri, Furmark, Fischer and Garrett2022). The GS variability, as an overall response of BSV, has been demonstrated to be negatively correlated to alertness or arousal (Falahpour, Wong, & Liu, Reference Falahpour, Wong and Liu2016; Wong, Olafsson, Tal, & Liu, Reference Wong, Olafsson, Tal and Liu2013; Zhang & Northoff, Reference Zhang and Northoff2022). It decreases with the intake of caffeine (Wong et al., Reference Wong, Olafsson, Tal and Liu2013) and increases during sleep deprivation (Nilsonne et al., Reference Nilsonne, Tamm, Schwarz, Almeida, Fischer, Kecklund and Akerstedt2017). Yang et al., found higher GS variability in patients with SCZ but not in those with BD (Yang et al., Reference Yang, Murray, Repovs, Cole, Savic, Glasser and Pearlson2014). This difference may be due to variations in patients’ alertness, which is impaired in patients with SCZ but not in those with BD (Elias et al., Reference Elias, Miskowiak, Vale, Kohler, Kjaerstad, Stubbs and Carvalho2017; Klein, Shekels, McGuire, & Sponheim, Reference Klein, Shekels, McGuire and Sponheim2020). Since the only confirmed role of GS is its inverse correlation with alertness, we hypothesized that the reduced GS variability in the MDD group may have responded to their abnormally increased arousal (Hegerl & Hensch, Reference Hegerl and Hensch2014; Hegerl, Wilk, Olbrich, Schoenknecht, & Sander, Reference Hegerl, Wilk, Olbrich, Schoenknecht and Sander2012; Schmidt et al., Reference Schmidt, Pschiebl, Sander, Kirkby, Thormann, Minkwitz and Himmerich2016). Evidence from sleep deprivation therapy in MDD patients supports this hypothesis. For instance, it has been found that depression symptoms were alleviated, and GS variability increased in MDD patients by sleep deprivation (Benedetti & Colombo, Reference Benedetti and Colombo2011; Nilsonne et al., Reference Nilsonne, Tamm, Schwarz, Almeida, Fischer, Kecklund and Akerstedt2017; Wolf et al., Reference Wolf, Kuhn, Normann, Mainberger, Maier, Maywald and Nissen2016). These findings seem to suggest that MDD patients have lower GS variability and higher arousal, whereas sleep deprivation resulted in increased GS variability and reduced arousal, alleviating depression.
Reduced GSCORR in patients with MDD
The GSCORR has an inherent structure that is marked by a decline in r values from sensorimotor areas to association areas (Zhang, Huang, Tumati, and Northoff, Reference Zhang, Huang, Tumati and Northoff2020). Such intrinsic structure is thought to reflect the sensorimotor-to-transmodal heterogeneity of neurodevelopmental order, functional connectivity, and gene expression (Huntenburg, Bazin, & Margulies, Reference Huntenburg, Bazin and Margulies2018). As suggested by the dual-layer model (Zhang and Northoff, Reference Zhang and Northoff2022), the GS regulates arousal while the GSCORR coordinates different forms of cognition. Therefore, the reduced GSCORR in patients with MDD is plausibly linked to abnormalities in cognitive functions.
The GSCORR has been found to be impaired in patients with psychiatric disorders (Han et al., Reference Han, Wang, He, Sheng, Zou, Li and Chen2019; Yang et al., Reference Yang, Murray, Glasser, Pearlson, Krystal, Schleifer and Anticevic2017; Zhang et al., Reference Zhang, Magioncalda, Huang, Tan, Hu, Hu and Northoff2019) as well as in epileptic patients (Li et al., Reference Li, Wang, Wang, Zhang, Zou, Wang and Chen2021), usually associated with particular symptoms or cognitive/emotional functions. In patients with MDD, the reduction of GSCORR in almost the whole brain at the medium frequency and in both sensorimotor areas (e.g. SMN) and association areas (e.g. DMN and SN) at the high frequency suggests the systematic weakening of global-local interaction (Wang et al., Reference Wang, Yang, Li, Ao, Jiang, Cui and Jing2023). This may indicate that MDD is in an abnormal cognitive/emotional state compared to HCs. This is in line with the global disorder hypothesis, which suggests the over-processing of bottom-up negative information from the sensory system and the failure of top-down negative emotion suppression from the higher-order system in patients with MDD (Xia et al., Reference Xia, Liu, Mechelli, Sun, Ma, Wang and He2022). Coincidentally, Northoff et al. (Northoff, Wiebking, Feinberg, and Panksepp, Reference Northoff, Wiebking, Feinberg and Panksepp2011) proposed a ‘resting-state hypothesis’ for MDD, which posits that MDD is a widespread brain disorder that affects various functional brain networks. This hypothesis was supported by the findings that patients with MDD display abnormalities in the DMN, SN, central executive network, affective network, and the limbic system, which involve most areas of the brain (Dichter, Gibbs, & Smoski, Reference Dichter, Gibbs and Smoski2015; Mulders, van Eijndhoven, Schene, Beckmann, & Tendolkar, Reference Mulders, van Eijndhoven, Schene, Beckmann and Tendolkar2015; Wang, Hermens, Hickie, & Lagopoulos, Reference Wang, Hermens, Hickie and Lagopoulos2012). The current results support these findings from the global-local interaction viewpoint. Earlier studies have observed both an increased and a decreased GS presentation in MDD (Han et al., Reference Han, Wang, He, Sheng, Zou, Li and Chen2019; Keskin, Eker, Gonul, & Northoff, Reference Keskin, Eker, Gonul and Northoff2023; Scalabrini et al., Reference Scalabrini, Vai, Poletti, Damiani, Mucci, Colombo and Northoff2020). Our investigation has yielded partially consistent and partially contradictory results, which may be attributed to the different approaches in signal frequency manipulation. Specifically, the previous study employed classical filtering within the 0.01–0.08 Hz frequency range, whereas we utilized a distinct frequency band (0.0728–0.1383 Hz). This discrepancy in frequency bands may imply that the signal frequencies serve distinct functional roles (Buzsaki & Draguhn, Reference Buzsaki and Draguhn2004; Knyazev, Reference Knyazev2007), which will be further explored in the forthcoming section. Alternatively, the inconsistencies across studies may be attributed to variations in the inclusion of covariates. Prior studies have discovered a correlation between GS and age (Ao et al., Reference Ao, Yang, Drewes, Jiang, Huang, Jing and Wang2023; Nomi et al., Reference Nomi, Bzdok, Li, Bolt, Chang, Kornfeld and Uddin2022) and a significantly smaller total GMV in the MDD group (Lai & Wu, Reference Lai and Wu2014; Tae, Reference Tae2015), which aligns with our findings. Consequently, we conducted the regression analysis with these variables as covariates to ensure the accuracy and reliability of our results.
Frequency-dependent functional alteration in patients with MDD
Does the widespread decline of GSCORR result from the GS? A recent study found that altered intra- and inter-network connections of the DMN in patients with MDD were primarily contributed by the GS, highlighting the coordination of GS on various functional systems (Scalabrini et al., Reference Scalabrini, Vai, Poletti, Damiani, Mucci, Colombo and Northoff2020). We have demonstrated in a previous study that the global–local interaction is dominated by the causal impact of the GS on local signals (i.e. functional separation) at higher frequency bands, whereas by the effect of local signals on the GS (e.g. functional integration) at lower frequency bands (Wang et al., Reference Wang, Yang, Li, Ao, Jiang, Cui and Jing2023). The declined GSCORR in patients with MDD, mainly at higher frequency bands, is thus possibly determined by the reduced GS.
The brain is a complex system that encompasses multi-scale spatiotemporal structures. It seems that different frequencies are associated with different spatial organizations of brain activity (Qiao et al., Reference Qiao, Li, Wang, Wang, Li, Lu and Wang2022a), which further support specific cognitive processes (Siegel, Donner, & Engel, Reference Siegel, Donner and Engel2012). As a result, the frequency-dependent effect may serve as a valuable window for probing the pathological mechanism of mental disorders. Frequency-dependent alterations of brain activity have been extensively documented in MDD (Fingelkurts et al., Reference Fingelkurts, Fingelkurts, Rytsälä, Suominen, Isometsä and Kähkönen2007; He et al., Reference He, Cui, Zheng, Duan, Pang, Gao and Chen2016; Ries et al., Reference Ries, Hollander, Glim, Meng, Sorg and Wohlschlager2019), as well as in other mental disorders (Newson & Thiagarajan, Reference Newson and Thiagarajan2019; Qiao et al., Reference Qiao, Li, Wang, Wang, Li, Lu and Wang2022a; Yang et al., Reference Yang, Cui, Pang, Chen, Tang, Guo and Chen2021), indicating that the pathological alteration of brain activity occurs at particular time scales. However, the association between altered spatiotemporal structures and impaired cognitions are largely unknown.
Here we attempt to explain the frequency-dependent decline of GSCORR within the dual-layer model of GS. First, the reduction of GS fluctuation in patients with MDD is associated with their hyper-alertness (see section 4.1). Second, the declined GSCORR is primarily attributed to the reduction in GS (see above). The decreased GSCORR throughout the brain, therefore, implies the modulation of slow oscillation of arousal on the entire brain (Raut et al., Reference Raut, Snyder, Mitra, Yellin, Fujii, Malach and Raichle2021). As heightened alertness is known to cause impaired cognitive control and irritable emotions (Baldi & Bucherelli, Reference Baldi and Bucherelli2005; Fredholm, Bättig, Holmén, Nehlig, & Zvartau, Reference Fredholm, Bättig, Holmén, Nehlig and Zvartau1999; Peifer, Schulz, Schächinger, Baumann, & Antoni, Reference Peifer, Schulz, Schächinger, Baumann and Antoni2014), it is not surprising that patients suffering from MDD experience impairment in multiple cognitive and emotional domains.
Clinical relevance of GS indicators
The results showed that the correlations between GSpower/GSCORR and clinical scores were positive in the MDD group, whereas the correlations were mainly negative, although not significant, in the HCs. Because the GS topography is primarily located in sensory-motor areas (Ao et al., Reference Ao, Ouyang, Yang and Wang2021), enhanced connectivity in higher control areas (e.g. the DMN, SN) suggests that patients with MDD may invoke executive control functions in response to depressive symptoms. Similarly, Zhu et al. Reference Zhu, Cai, Yuan, Yue, Jiang, Chen and Yu2018) reported a positive correlation between the variable coefficient of GS and depressive score, while the former can predict the effect of antidepressants in MDD patients. On the contrary, the negative correlation in HCs is mainly located in the sensory and motor areas, suggesting that the bottom-up depression-related information affects normal people, but their GSCORR remains intact. Therefore, we argue that positive correlations between depressive scores and GSpower/GSCORR in the current study reflect a compensatory mechanism. That is, patients with more serious symptoms tend to enhance the GS and its influence on local activities to compensate for impaired brain functions, whereas HCs do not need such a compensatory mechanism (e.g. no correlation).
Limitations
We present here several disadvantages of the current study. First, the dataset used for the analysis does not contain the medication status and disease history, which limits the interpretation of the clinical relevance of GS. Second, respiratory and cardiac noises were not eliminated as they were not involved in the dataset. However, the GS topography may be insensitive to these noises (Yan, Yang, Colcombe, Zuo, and Milham, Reference Yan, Yang, Colcombe, Zuo and Milham2017), which suggests that our results are still reliable. Third, all participants were recruited from Japan, which may reflect an East Asian-specific result and cannot be generalized to other samples. Finally, in the retained sample, the female-to-male ratio of the MDD group differs from that of the control group. Considering that MDD is more prevalent in women (Albert, Reference Albert2015; Picco, Subramaniam, Abdin, Vaingankar, & Chong, Reference Picco, Subramaniam, Abdin, Vaingankar and Chong2017), further investigation is needed to understand the gender effect, which was regressed out in the current study.
Conclusion
Utilizing a multicenter dataset, we unveiled reduced GS fluctuations in MDD, suggesting a potential association with alertness. Furthermore, we noted a frequency-dependent reduction of GSCORR in MDD, which might indicate a weakened effect of GS on local activities through the arousal system in patients with MDD (Wang et al., Reference Wang, Yang, Li, Ao, Jiang, Cui and Jing2023), impairs the coordination among various functional systems. However, the patients may invoke higher executive control functions to compensate for these deficits, shedding light on the antidepressant treatment. These results strongly indicate that temporal and spatial variations of GS play a pivotal role in interpreting and understanding depression, as outlined in ‘Spatiotemporal Psychopathology’ (Northoff, Reference Northoff2016; Northoff and Hirjak, Reference Northoff and Hirjak2022).
Supplementary material
The supplementary material for this article can be found at https://doi.org/10.1017/S0033291724000254
Author contributions
Chengxiao Yang: Conceptualization, Data curation, Methodology, Writing – original draft, Writing – review & editing. Bharat Biswal: Methodology, Writing – review & editing. Qian Cui: Writing – review & editing, Funding acquisition. Xiujuan Jing: Writing – review & editing. Yujia Ao: Writing – review & editing, Yingfeng Wang: Conceptualization, Methodology, Writing – review & editing, Funding acquisition.
Funding statement
This work was supported by the National Science Foundation of China (62177035, 82172059).
Competing interests
The authors declare no conflict of interests.