


This paper takes a novel perspective on the comparison of democratic and autocratic systems by looking at the educational attainment of the leaders who are selected. It investigates this using a unique data set that we have assembled on a core sample of 1,468 leaders in 197 countries who held office between 1848 and 2004. The paper's main finding is that democratic systems are around 20% more likely to select highly educated leaders.
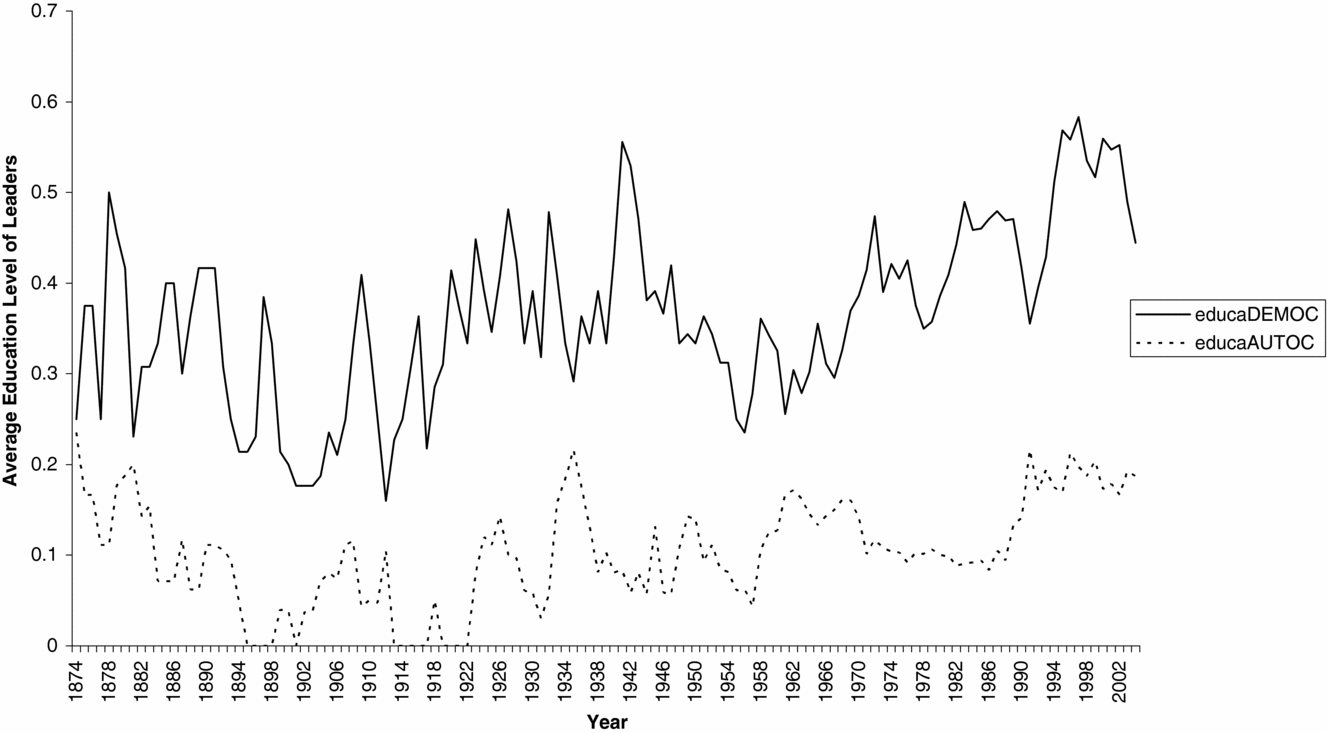
Figure 1 previews our core finding by showing the proportion of highly educated leaders (measured by whether the leader has a graduate qualification) in the world, beginning in 1874, differentiated by whether a country is classified as autocratic or democratic according to the Polity IV data set.Footnote 1 This figure shows that the proportion of highly educated leaders is consistently higher in democracies than in autocracies over the entire sample period. We will demonstrate in the paper that this finding is robust to a wide range of empirical methods, specifications, choices of subsamples, controls, and ways of measuring education and democracy.
Average Education of Democracies and Autocracies, 1874–2004

The paper contributes to a growing empirical literature on political selection—examining how political systems determine the characteristics of politicians who are chosen.Footnote 2 Education is a particularly interesting aspect of political selection in view of the strong correlation found between educational attainment and earnings, which is consistent with education either enhancing skills or signaling ability. Education is also strongly correlated with civic engagement. Education is thus a compelling indicator of a leader's quality.
This paper also adds to the large cross-country empirical literature comparing democracies and autocracies. The focus of that literature has mainly been on whether being a democracy enhances a country's economic performance, particularly growth. Early contributions to the cross-country literature include Przeworski and Limongi (Reference Przeworski and Limongi1993) and Barro (Reference Barro1996), who conclude that the correlation between democracy and growth is weak and not robust. However, a recent panel data analysis by Papaioannou and Siourounis (Reference Papaioannou and Siourounis2008) based on within-country estimates of permanent transitions, i.e., those where democracy is consolidated, finds that, on average, democratization is associated with a 0.5 to 1 percentage point increase in the annual growth rate. This finding is broadly consistent with Persson and Tabellini (Reference Persson and Tabellini2009)'s novel econometric approach, which also finds support for the proposition that persistent democracy is associated with an improvement in economic performance. In a similar vein, Aghion, Alesina, and Trebbi (Reference Aghion, Alesina, Trebbi and Helpman2008) show that democracy is correlated with improved performance of advanced sectors, i.e., those that are closer to the technological frontier.
Models of the association between democratic transition and economic performance, such as Acemoglu and Robinson (Reference Acemoglu and Robinson2006), have generally focused on how democratization affects policy makers' incentives. However, democracy might also affect the characteristics of policy makers who are chosen, as one might expect following the citizen-candidate framework developed by Besley and Coate (Reference Besley and Coate1997) and Osborne and Slivinski (Reference Osborne and Slivinski1996). In line with this, there is persuasive evidence that political selection matters for policy choice.Footnote 3 And this is also consistent with the finding in Jones and Olken (Reference Jones and Olken2005) that having a leader who dies in office is correlated with a country's subsequent economic growth.
Interest in selection issues is not confined to political leadership. Recent accounts of corporate performance similarly place weight on charismatic chief executive officers (CEOs) and the way in which they shape corporate strategies. Indeed, Bertrand and Schoar (Reference Bertrand and Schoar2003) argue that the data can be described in terms of CEO “fixed effects” indicative of management styles. A number of papers have observed that random shocks to CEOs affect firm performance, consistent with the view that the identity of leaders matter—see, for example, Johnson et al. (Reference Johnson, Magee, Nagarajan and Newman1985) and Bennedsen, Perez-Gonzales, and Wolfenzon (Reference Bennedsen, Perez-Gonzales and Wolfenzon2007).
The remainder of the paper is organized as follows. In the next section, we discuss some background theoretical issues to motivate and interpret the empirical analysis. In the third section, we introduce the data. The fourth section presents the core empirical results. The fifth section looks at the occupational backgrounds of leaders, with a focus on the importance of military leaders in autocracies. In the sixth section, we present a range of extended results that assess the robustness and interpretation of the baseline findings. The seventh section concludes.
THEORETICAL PRELIMINARIES
A reasonable starting point for a discussion of political selection is to suppose that citizens of any country prefer to be governed by an honest and competent leader. In the language of political science, honesty and competence are valence issues. But measuring these qualities directly is difficult, especially as, in practice, they are multidimensional concepts rather being capturable in a single measurable indicator. However, we will argue that educational attainment is a good candidate as a proxy for this. If the quality of policy makers matters, then a key issue is how political institutions shape the selection process.
Therefore, in what follows, we discuss three background issues that motivate our test linking a country's political institutions and the educational attainment of its leaders. We begin by discussing why we might expect a leader's educational attainment to be a signal of honesty and/or competence. We then discuss political selection in two parts: (i) the factors that shape the quality of the candidate pool and (ii) determinants of who from among the pool is likely to be successful. In both of these cases, we discuss why a transition to democracy may make a difference.
Does Education Matter for Competence and Honesty?
Prevailing theoretical models and empirical evidence suggests that the answer to this question is “yes.”
On the question of competence, there is a vast literature in economics that demonstrates a robust positive return to education in private market settings.Footnote 4 Human capital theory sees this as reflecting how education increases skills, thereby increasing productivity. Skills that are valuable for employment in the private sector may not transfer immediately to performance as a policymaker. But there are certainly cases where we would expect this to be the case. For example, the oratorical skills and the ability to master a complex brief quickly, as well as the powers of persuasion learned in the study and practice of law, provide an obvious explanation of the predominance of lawyers in politics. So skills learned while training as a lawyer seem likely to constitute transferable human capital. The alternative view of education is a signaling theory where individuals become educated in order to demonstrate to prospective employers that they are able. This view would also lead us to expect more educated leaders to be more competent, so that education could serve as a signal for competence.
It is also reasonable to posit a link between educational attainment and public-spiritedness. There is empirical evidence that more educated individuals are also more civic-minded. For example, they contribute more to public causes.Footnote 5 A human capital interpretation of this finding would suggest that part of the skill set learned in education is an appreciation of the needs of others. Moreover, education would have a central role in the production of social capital. Here, we would expect higher educational attainment in a leader to be an indicator of greater civic-mindedness.
The Candidate Pool
One way in which political institutions could affect the quality of candidates is through affecting the pool of citizens who are available for public office.
Formal legal restrictions on who can become a leader are generally minimal. But that does not mean that entry is guaranteed to be free and open. Even in a democracy, candidates may face significant financial costs of running a campaign and/or may be required to go through a demanding nomination process.Footnote 6 Political networks often play a filtering role, and political parties are frequently at the heart of these. Parties vary significantly in the formal and informal procedures that they use to regulate candidate entry.
In autocracies, access to the candidate pool is often closed. For example, monarchies usually require some form of link by marriage or bloodline to be in the pool. And leaders in military juntas or one-party states rarely specify in any formal sense who is in the pool. Running for leadership positions is generally kept away from the public eye for fear that any contest could look like a sign of weakness or fragmentation. Overall, entry barriers to the candidate pool seem to be higher in nondemocratic settings.
Another key issue affecting candidate entry concerns the rewards available in office or elsewhere. Higher outside rewards in alternative occupations will generally deter entry in any political system. And returns to talent tend to be higher in market-based economies. Moreover, because market development is greater in countries that are democratic, we might expect this to make it more difficult, on average, to attract the most competent people into the candidate pool in democracies.
Office rewards may matter too. In some countries, mainly autocracies, being a leader is dangerous, with a constant threat of assassination. This may act as a deterrent to good candidates. Illicit rewards from corruption may also play a role in attracting dishonest leaders. Because checks and balances are stronger in democracies, this motive is likely to play less of a role in this case.
To summarize: there are a number of factors that shape the candidate pool, and these are likely to be systematically related to the structure of political institutions. Democracies should, on the whole, have a wider pool of candidates to choose from.
Being Selected
The second important facet of political selection concerns who is picked from among the available pool of candidates.
In a democracy, this is achieved by holding an election, either directly, as in a presidential system, or indirectly as in a parliamentary democracy. Whether this selection occurs on the basis of competence or honesty is moot. For example, ideological predispositions among voters could prevent them from voting on the basis of honesty or competence. Campaigning could also affect the outcome. And it is not even clear that the leader is who matters in a party-based system—voters may prefer to look at the senior leadership team, rather than just the leader, and the best leader does not always have the best team.
In a nondemocratic setting, it is even less clear cut that the most honest or competent candidate will be chosen from among the pool of available leaders. Leaders may be prized more for their loyalty, ability to engage in strategic manipulation, or commitment to a specific ideology. In military dictatorships, selection may be based on military standing rather than policy competence. And in monarchies, selection is based mostly on birthright, making leadership qualities even less relevant.
Information provision may also affect selection. Media freedom is generally much greater in democracies, which means that potential leaders are subject to greater scrutiny. This will favor the selection of leaders with more “popular appeal”, which does not always correspond to policy making competence or honesty.
Summing Up
Pulling this discussion together, there are good theoretical grounds for thinking that democracies will tend to promote honesty and competence among leaders. And to the extent that this is captured in educational attainment, we should expect to observe a positive correlation between the educational attainment of leaders and democracy. However, there are sufficient caveats to make us wary of arguing that the link between education of leaders and democracy is clear-cut in theory. This motivates the need for an empirical investigation.
DATA
To identify the political leader in each country and year, we use the Archigos data, which we supplement using Ludwig (Reference Ludwig2002) and our own supplementary data collection.Footnote 7 In most cases, identifying the leader in a country in a given year is clear and uncontroversial. Two simple rules are generally followed: (i) in parliamentary regimes, the prime minister is coded as the leader, whereas in presidential systems, it is the president; (ii) in communist states, the chairman of the party is coded as the effective leader. We obtain a sample of around 2,000 leaders. But our desire to include controls in the following regressions and concerns about the quality of some of the information mean that the sample that we use in the core regressions has just over 1,100 observations. The Data Appendix details precisely how the sample that we use is put together.
We have constructed a new data set on the educational attainment of each leader. In doing so, we follow the eight-way classification of a leader's highest educational attainment suggested in Ludwig (Reference Ludwig2002). The bottom category is illiterate, with no formal education, and there are only 2 leaders in our core data set in this category. The next category classifies a leader as literate but with no formal education; we have 40 leaders in that group. Category 3 is for leaders who have grade/elementary/primary school education or were taught by personal tutors, with 200 leaders represented. Next is category 4, which stands for leaders with high/finishing/secondary education or trade school and contains 129 observations. Special training (beyond high school), such as mechanical, nursing, art, music, or military school, is category 5 which contains 44 leaders. College-educated leaders compose category 6, which contains 646 leaders. Category 7 is for leaders who have qualifications from a graduate or professional school (e.g., master's degree), of which there are 278 leaders. Finally, category 8 is for leaders with doctorates (e.g., a Ph.D.), of which there are 129.Footnote 8
Our core educational attainment variable, which we use throughout, is a dummy variable which is equal to one if the leader is in either category 7 or 8, i.e., has at least a postgraduate qualification. We will refer to this variable as “Graduate Education.” We will test the robustness of the core results to instead using a variable that we call “College Education,” which is a dummy that is equal to one if the leader is any of categories 6, 7, and 8. For country-level educational attainment, we will use the Barro and Lee (2010) data set and, for a longer time period, the recently collected data of Morrisson and Murtin (Reference Morrisson and Murtin2010).
Our core measure of democracy is from the Polity IV data base.Footnote 9 These data measure democracy on three core dimensions: how competitive and open the recruitment of chief executives is; the extent to which the chief executive is constrained institutionally; and how competitive and regulated political participation is. The main summary variable, called POLITY2 in the data, ranges from minus 10 to plus 10. Following a long line of research by economists, for example, Persson and Tabellini (Reference Persson and Tabellini2008), our main variable classifies a country as democratic if the variable POLITY2 is positive. We will, however, explore whether our results are robust to considering alternative ways of classifying countries as democratic or autocratic by using other cutoff levels of the POLITY2 variable and the Boix and Rosato (Reference Boix and and2001) classification of democracy.
CORE RESULTS
Our core empirical specification is a linear probability model. We will focus primarily on determinants of within-country variation over time of the educational attainment of leader l first selected to serve in country c at date t. The estimated equation is then

where eℓct is a measure of the educational attainment of leader ℓ in country c at date t, μc is a country fixed effect, μt is a year dummy, and xct are other controls. We cluster the standard errors by country to allow for arbitrary within-country correlations in the errors.
Our main coefficient of interest is θ, which can be read in the linear probability framework as the effect of the country being classified as democratic on the probability of selecting an educated leader. By including country and year dummy variables in all specifications, we control for fixed country characteristics such as history and culture that might affect leadership selection and global macrotrends such as rising levels of educational attainment.
In this baseline specification, we enter the democracy variable in the year in which the leader is first selected to hold office. This is important because our hypothesis that political selection is at work implies that institutions in place at the time of selection are the determinant of the type of leader who takes office.
Given the length of the time series and the varied set of countries, the only time-varying regressor that we are able to control for without sacrificing too many observations is per capita income from Maddison (Reference Maddison2003). Controlling for income is, however, important because it could reflect opportunities for leaders outside of government. For a more limited sample of countries/time periods, which we discuss later, we can also include measures of general educational attainment in a country. Given the lack of time-varying regressors available to us, we check whether our results are robust to including country-specific time trends. These will pick up a variety of economic changes within countries.
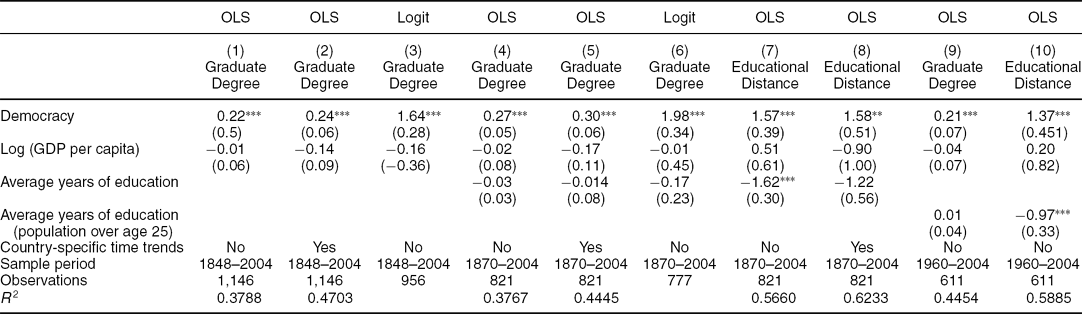
The core results are in Table 1.
Democracy and Education: Baseline Results

Notes: All specifications include country and year dummies. All OLS regressions are reported with robust standard errors clustered at the country level. Standard errors are in parentheses. The dependent variable Graduate Degree is a dummy that has value 1 if the leader has a graduate degree and zero otherwise. Democracy is a dummy variable that has value 1 if the polity2 score is higher than 0, and 0 otherwise. The full sample is a panel of 197 countries: 1848–2004. Each observation is for the first year the leader is selected. The Democracy and Per Capita Income variables are measured in the first year the leader is selected. Average Years of Education is the average years of schooling in the total population over 15, interpolated, from Morrisson and Murtin (Reference Morrisson and Murtin2010). The Average Years of Education (population over age 25) is the average years of schooling in the total population over 25, interpolated, from Barro and Lee (Reference Barro and Lee2001) for the sample from 1960 onward (original variable is tyr25). The Educational Distance variable is explained in the text.
*Significant at 10%; **significant at 5%; ***significant at 1%.
In column (1), we look at the relationship between having a leader with a graduate qualification and democracy, controlling only for income per capita and country and year fixed effects. There is a positive and significant correlation between democracy at the time of selection and having a highly educated leader, with a democracy being 22% more likely to have an educated leader than an autocracy. The correlation between having a leader with a graduate degree and GDP per capita is not significant.Footnote 10 Column (2) shows that this result is robust to including country-specific time trends. In column (3), we estimate a conditional logit model to recognize the discrete nature of the left hand–side variable. The core finding of column (1) remains.
The literature on the prerequisites for democracy, beginning with Lipset (Reference Lipset1959), has emphasized the importance of education for the sustainability of democracy. These ideas have been further developed in Glaeser, Ponzetto, and Shleifer (Reference Glaeser, Ponzetto and Shleifer2007). Such discussions motivate why it is important to control for the educational attainment of the population as a whole. The main constraint on doing so lies in data availability.
We use data from Morrisson and Murtin (Reference Morrisson and Murtin2010), which gives country-level educational attainment in 78 countries for the period 1870–2010. The measure that we use is the average years of education of the population aged over 15.Footnote 11 Column (4) includes this variable in our core regression. There is a significant reduction in the sample size due to data availability—from 1,146 to 956. However, the correlation between democracy and whether a leader has a graduate degree is essentially identical to that found in column (1). The coefficient on the educational level of a country is not significantly different from zero in this regression. Column (5) includes country-specific time trends alongside country-level educational attainment. Column (6) reports the results from running a conditional logit. In all cases, the core finding—linking democracy and having a highly educated leader—remains present.
Having data on education at the country level allows us to look at the link between democracy and leader's education in a slightly different way by focusing on the difference between the leader's educational attainment and that of the population as a whole. Thus, our left hand–side variable will now be the years of education of the leader minus the average years of education of the population in that year.Footnote 12 Column (7) of Table 1 shows that the educational distance of the leader from the population is on the average 1.5 years larger in democracies than in autocracies. Column (8) repeats this regression with country-specific time trends also included.
Columns (9) and (10) repeat the specifications in columns (4) and (7), controlling for country-level educational attainment using the Barro–Lee education variables and the Penn World tables data to control for income per capita. This increases the sample of countries for which education data are available and improves the reliability of the income data. However, a price is paid in terms of having a more restricted sample period, which is now only after 1960. The similarity of the results to what we found with Morrison and Murtin (Reference Morrisson and Murtin2010) data is striking. Moreover, the core column (1) finding is robust. All in all, this makes us confident that omitting country-level education data is not a significant issue.Footnote 13
Taken together, these results paint a consistent picture suggesting that democracies indeed feature more educated leaders. Moreover, our core results are robust to controlling directly for the educational attainment in the population as a whole and the method of estimation.
OCCUPATIONAL SELECTION
In this section, we explore how our core finding is related to the previous occupation of leaders. We explore, for example, whether selecting a more educated leader is just a proxy for selecting leaders from specific occupational groups. We will also relate our results to two often-made observations about political leadership: the prevalence of lawyers in democracies and military professionals in autocracies.
This exercise is based on data that we have collected on the occupational background of leaders in our sample. We have collected this information for 1809 leaders using the same sources we use for the education variables.Footnote 14 We classify leaders into the following broad categories: royalty, civil servant, professor, scientist, military professional, and businessman. It is of course debatable whether being a member of the royalty is really an occupation but, given their prevalence in the data, we need to assign such people to a group and they rarely appeared to have had other careers. We have a category “other” as the residual group.
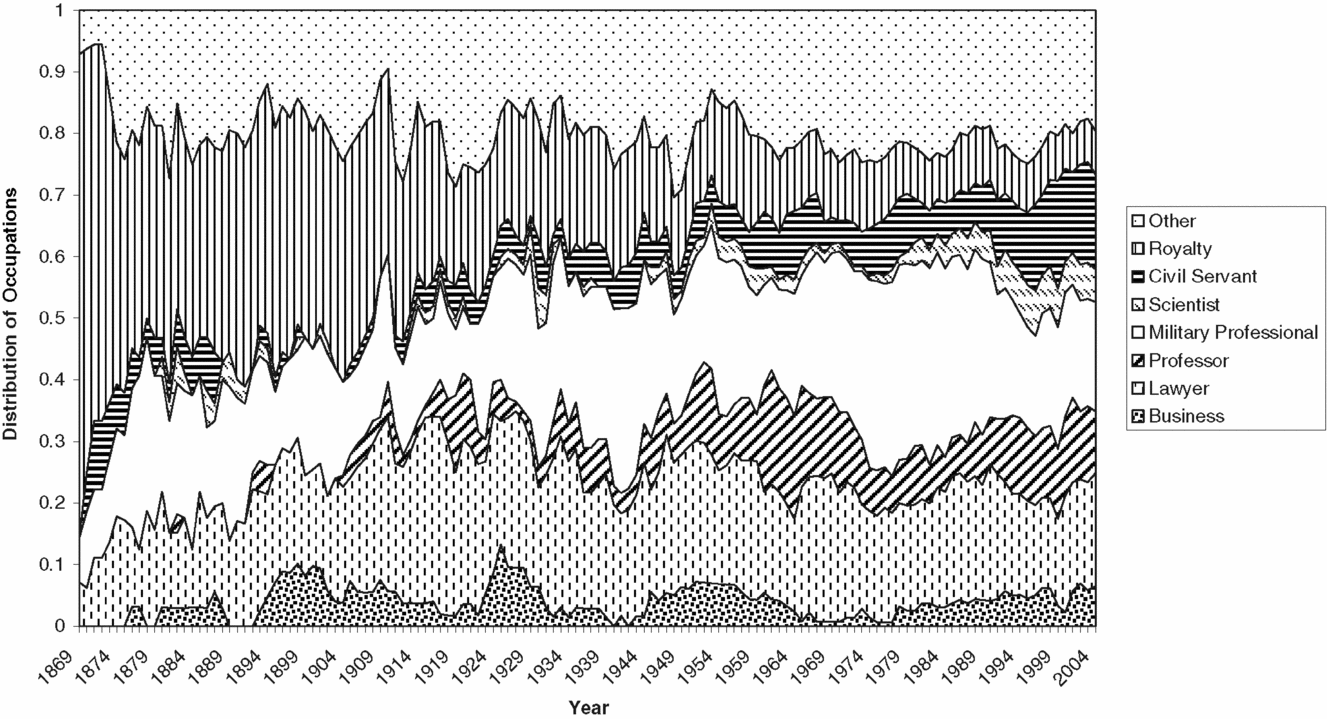
Figure 2 shows how the occupational structure of leaders has changed over time. There is a striking, but unsurprising, decline in the importance of royalty over time. Alongside this, there is a concomitant rise in professions such as lawyers, professors, and scientists. Given that entry into such groups often requires education, this finding is, at the level of casual empiricism, consistent with our core finding.
Distribution of Occupations of Leaders

Figure 2 also illustrates that leaders with previous careers in the military are an important phenomenon in our data, reflecting the fact that many dictatorships are organized by the military. This raises the question of whether our results are driven by this group, because 36% of nonmilitary leaders have a graduate-level qualification, compared to just 4% of military leaders.Footnote 15 We will explore this issue later.
We will begin by examining the correlation between being selected in a democracy and the leader's occupation. We will then check whether the correlation between education and democracy holds if we control directly for the leader's prior occupation.
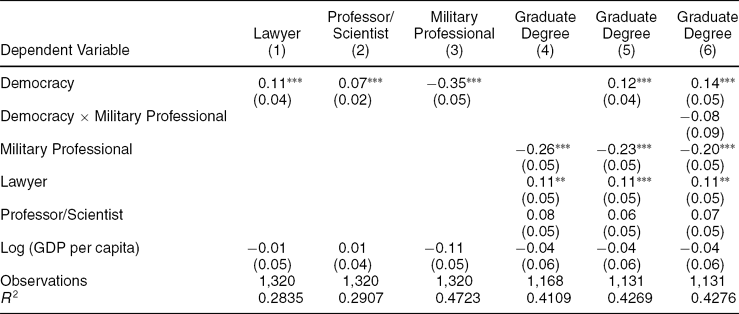
The first three columns of Table 2 show that there is a strong correlation between a leader's previous occupation and whether or not a country is democratic at the time of his or her selection. In column (1) of Table 2, the left hand–side variable is a dummy indicating whether the leader was a lawyer. The column shows that, after controlling for country and year dummies, a democracy is 11% more likely to select a lawyer as its leader.Footnote 16 In column (2) our left hand–side variable is a dummy indicating whether a leader is either a professor or a scientist. Here, we find that a leader selected in a democracy is 7% more likely to be in this occupational category. These findings are consistent with our baseline finding that democracies select more educated leaders.
Democracy, Military Professionals, and Education

Notes: All specifications include country and year dummies. The estimation method is OLS. Standard errors clustered at the country level in parentheses. The sample is a panel of 197 countries: 1848–2004. Each observation is for the first year a new leader is selected. The Democracy and Per Capita Income variables are measured in the first year that the leader is selected. Military Professional is a dummy that is equal to 1 if the leader was in the military before holding office. Lawyer is a dummy that is equal to one if the leader was a lawyer before holding office. Professor/Scientist is a dummy that is equal to 1 if the leader was a professor or scientist before holding office.
*Significant at 10%; **significant at 5%; ***significant at 1%.
Column (3) shows that a leader who has had a career as a military professional prior to becoming a leader is 35% less likely to be selected in a democracy compared to an autocracy. Again this result makes sense given our previous core finding; 39% of leaders who are selected in autocracies have had careers in the military, compared to only 9% of those in democracies.
Our results could thus be interpreted not as evidence for the selection of leaders based on education, but for how political networks change with democratization and bring people from different occupations into power. One way to look at whether this is the case is to repeat the analysis of Table 1 while controlling for occupation. This is not entirely convincing, as occupation is endogenous. But it is still interesting to know whether education matters “independently” of occupational background. In column (4) of Table 2, the left hand–side variable is whether a leader has a graduate education, and on the right-hand side, we include dummy variables for three core occupational categories as controls.Footnote 17 We find that leaders who have been military professionals are 26% less likely to have graduate degrees, whereas lawyers are 11% more likely. Perhaps a little more surprisingly, professors and scientists are only 8% more likely to have graduate degrees, and the coefficient on this occupational dummy is only weakly significant.
In column (5) we repeat the core specification of Table 1 while including occupational dummies. The size and significance of the coefficients on the occupational dummies are essentially identical to those in column (4). But being a democracy remains independently important and is associated with a 12% higher probability of having a graduate degree. So democracy seems to select leaders on the basis of their education over and above the information contained in their prior occupation.
Finally, in column (6), we include an interaction term between the dummies denoting whether a country is classified as a democracy and whether the leader's prior career was as a military professional. The coefficient on this interaction term will tell us whether military leaders selected in autocracies and democracies are significantly different from each other in terms of their educational attainment. This column shows that a leader in a democracy is around 14% more likely to have a graduate degree, whereas a military professional is 20% less likely. But there is no significant difference between autocracies and democracies in terms of the types of military professionals that they select. This suggests that the reason that military autocracies select less educated leaders is that they select from a less educated pool rather than the way they choose leaders within the pool of available candidates.
The bottom line from this section is that occupational selection does seem to be an important issue in the way that democracies and autocracies select leaders. However, selecting more educated leaders in a democracy remains a feature of the data even when prior occupation is controlled for.
ROBUSTNESS
We now assess the robustness of the core finding in a variety of ways. We will also address some issues surrounding the interpretation of the core empirical result.
Measuring Education
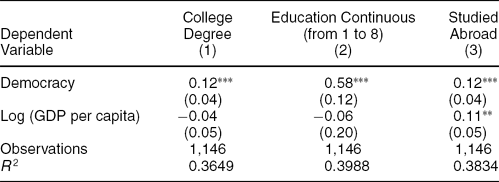
Table 3 considers three alternative ways of measuring a leader's educational attainment. The first column in Table 3 considers having a college rather than a graduate education as the outcome variable. As the result in column (1) shows, the core finding linking democracy and a leader's educational attainment is robust. That said, the size of the effect is smaller than for a graduate degree—the probability of being college-educated in a democracy is only 12% higher than in an autocracy.Footnote 18
Democracy and Education: Alternative Education Measures

Notes: All specifications include country and year dummies. The estimation method is OLS. Standard errors clustered at the country level in parentheses. The sample is a panel of 197 countries: 1848–2004. Each observation is for the first year a new leader is selected. The democracy and per capita income variables are measured in the first year that the leader is selected.
*Significant at 10%; **significant at 5%; ***significant at 1%.
In column (2) of Table 3, we measure educational attainment as an indicator variable running from 1–8, where each number corresponds to one of the eight educational achievement categories for leaders that we have collected. The result shows that there is still a positive and significant correlation with being selected in a democracy, worth about 0.6 on this education scale.
Column (3) picks up on a theme from Spilimbergo (Reference Spilimbergo2009), who shows that students who study abroad in democracies appear to promote democracy in their countries of origin. Perhaps one feature of democracies is also, therefore, that their leaders are more likely to have received a foreign education. The result in column (3) of Table 3, where the dependent variable is a dummy variable indicating whether the leader has studied abroad, shows that this is indeed the case. A leader selected in a democracy is 12% more likely to have studied outside the country.Footnote 19
Measuring Democracy
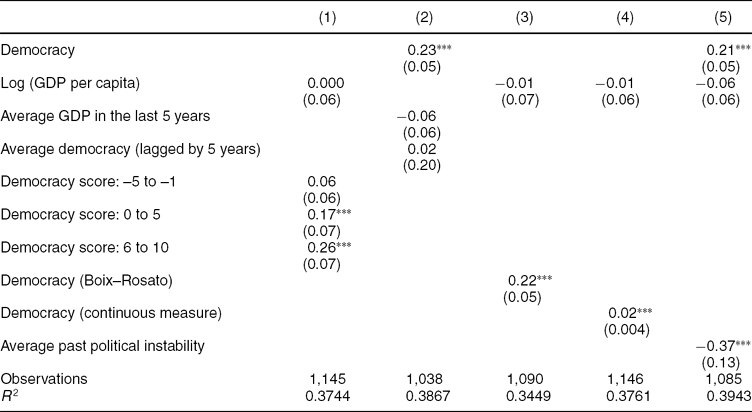
Table 4 looks at the effect of varying our measure of democracy. In column (1), we disaggregate the democracy variable into a series of dummy variables corresponding to the POLITY2 measure lying in different numerical ranges, with the omitted category being a democracy score lying between minus 10 and minus 6. The regression reported in column (1) shows that the core result is essentially driven by a country having a positive democracy score at the time when it selects its leader. This effectively justifies the approach that we have taken, where a single dummy variable for a positive POLITY2 score was used.
Democracy and Education: Alternative Measures of Political Systems

Notes: All specifications include country and year dummies. The estimation method is OLS. Standard errors clustered at the country level in parentheses. The sample is a panel of 197 countries: 1848–2004. Each observation is for the first year a new leader is selected. The dependent variable is a dummy variable that takes the value 1 if the leader has a graduate degree and zero otherwise. The Democracy and Per Capita Income variables are measured in the first year that the leader is selected. Average Democracy (lagged 5 years) is the average of the democracy variable of the country lagged by 5 years.
*Significant at 10%; **significant at 5%; ***significant at 1%.
Column (2) adds the average experience of democracy since the country entered the sample (lagged by five years) as a regressor. One possibility is that political selection is a reflection of an emerging democratic culture rather than the institutions at the time of leadership selection. The fact that this new regressor is not significant goes against the idea that some kind of emerging democratic tradition is driving the results. Column (2) also controls for longer-term economic trends by including the average GDP level of the past five years instead of the contemporaneous GDP, in case high-frequency changes in GDP contain very little signal about economic prospects. This variable is also not significant.
The Polity IV data are not without critics. Hence, we also check the robustness of our results to using a different data set to measure democracy. This was originally due to Przeworski et al. (Reference Przeworski, Alvarez, Cheibub and Limongi2000), but the version that we use was updated by Boix and Rosato (Reference Boix and and2001). The data code a country as democratic if its elections are free and competitive, the executive is accountable to citizens, and at least 50% of the male electorate is enfranchised. These data cover the period between 1800 and 1999. Compared to the Polity IV categorization of democracy, the Boix and Rosato (Reference Boix and and2001) measure depends more heavily on political contestation, with less weight being placed on political participation and executive constraints.Footnote 20 Column (3) of Table 4 confirms that the results are robust to using this alternative measure. In column (4), we use the POLITY2 variable as a continuous measure of democracy. Again, the core result linking democracy and leader education is robust.
We argued earlier that leaders may be discouraged from standing for office by the prospect of forcible or violent removal from office. Thus, a history of political instability and violence could act as a deterrent to higher-quality leaders making themselves available. And it is possible, also, that this history is negatively correlated with being democratic, because autocratic leaders are more susceptible to violent removal, given the nature of their institutions. To examine this issue, we use a measure of how frequently past leaders exited power via a coup, via a revolution, or by being assassinated; the exact measure is the percentage of previous leaders who have left power by such means. This varies over time within a country as the experience of leadership exit evolves. This variable is included in column (5) of Table 4. In line with what we expected, the coefficient on this variable is negative and significant, suggesting that instability of this form acts as a deterrent to educated leaders taking office. However, the sign and significance of democracy indicator at the time of selection remains as in the core results.
Varying the Sample
We now show that the results hold up in various subsamples.
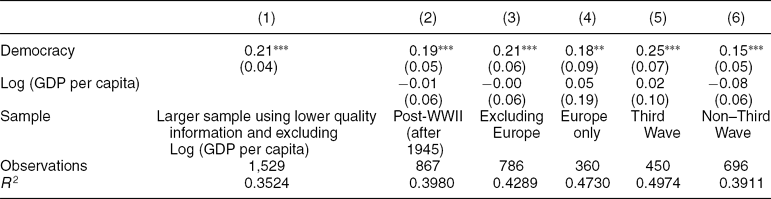
One general concern is that we have not been able to track down educational attainment information for all leaders in Archigos. There is perhaps a concern that there is something special about the sample that we have. Our baseline data used only our higher-quality sample, for which we are confident in our assessment of the educational attainment of leaders. By including GDP, we are also restricting the sample. Even though this is a potential concern, there is little evidence of institutional differences in sample means across these cases. Among those where we have good-quality information and GDP data, 60% are democracies. In the sample with good-quality educational data and no GDP data, this drops to 57%, which is the same proportion as in the larger sample, where we are less sure about educational attainment. It is perhaps not too surprising, therefore, that the baseline result is robust when we expand the sample to include leaders for whom we are less sure about the quality of the data and drop GDP from the regression. This is demonstrated in column (1) of Table 5, which has more than 1,500 observations.
Democracy and Education: Subsamples

Notes: All specifications include country and year dummies. The estimation method is OLS. Standard errors clustered at the country level in parentheses. The dependent variable is a dummy variable that takes the value 1 if the leader has a graduate degree and zero otherwise. Third Wave countries are defined as those that made a permanent transition to democracy after 1980.
*Significant at 10%; **significant at 5%; ***significant at 1%.
Column (2) of Table 5 shows that the baseline result holds in the post–World War II data, where the sample of independent countries is larger. Column (3) excludes Europe from the sample entirely. Again, the baseline result is robust in sign and significance. Column (4) looks only at the European sample and again finds the same result.
The remainder of Table 5 splits countries according to whether or not they belong to democracy's “third wave,” which we define as countries that made a permanent transition to democracy after 1980. These include Eastern European countries and some countries in Latin America. Column (5) includes only third wave countries, whereas column (6) looks at the complement of this set. Although the point estimates differ, they are statistically indistinguishable from each other and from the baseline result in Table 1. So it seems as if these newly created democracies followed the pattern of electing more educated leaders that we have found in the data as a whole.
Taken together, this subsample analysis shows little evidence of heterogeneity in the relationship between selecting a highly educated leader and being a democracy.
Reverse Causation?
Finally, we address whether reverse causation could explain our results. This would be the case if poorly educated autocratic leaders tended to precede democratizations, whereas highly educated leaders tended to be selected before democracy collapses.
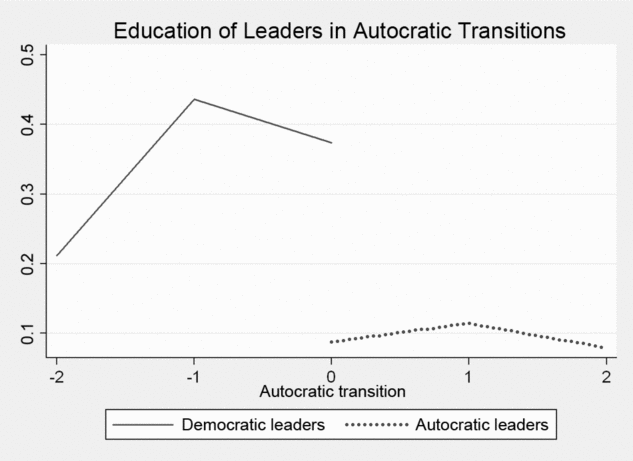
One way to address this concern is consider the following “event study” representation of the data around transitions to and from democracy. Here, we look at the educational attainment of leaders prior to democratic/autocratic transitions to see if there is a pattern before the transition takes place. Specifically, we look at the mean educational attainment of the two leaders before a transition and the two leaders afterwards. And we look at this separately for transitions out of autocracy and out of democracy.
The results are shown in Figures 3 and 4. In Figure 3, we see a jump in the educational attainment of leaders around a transition to democracy. The magnitude of this jump is about 20%, which is exactly in line with the size of the regression coefficient. There is no sign of a trend for the two leaders preceding the transition. In Figure 4, we see an abrupt fall in the leader's educational attainment after a transition to autocracy. This is also of magnitude similar to the regression estimate. And there also seems to be little evidence of the existence of a pretransition trend. Taken together, these figures show that the education attainment of a country's leader changes only at the point of transition to democracy/autocracy, but not before the transition. This suggests that the causal relationship runs from democracy to a leader's educational attainment and not vice versa.
Democratic Transitions

Autocratic Transitions

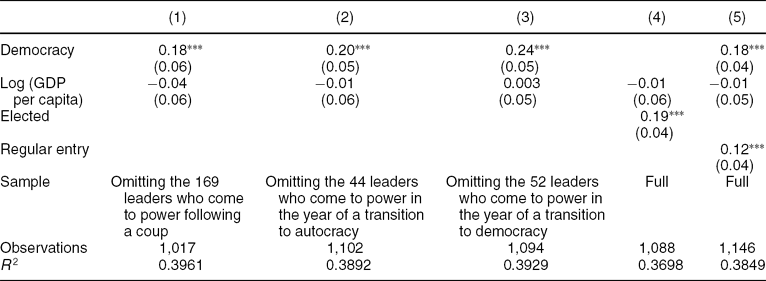
In Table 6, we look at the possibility that transitions to/from democracy are related to the educational level of the leader. In column (1), we show that the core finding from Table 1 is robust to dropping the 169 leaders who came to power following a coup in case their education level affected the probability of a coup taking place. The core result on democracy and education remains in both sign, size, and significance.
Democracy and Education: Regime Transitions and Method of Entry

Notes: All specifications include country and year dummies. The estimation method is OLS. Standard errors clustered at the country level in parentheses. The dependent variable is a dummy variable that takes the value 1 if the leader has a graduate degree and zero otherwise.
*Significant at 10%; **significant at 5%; ***significant at 1%.
We now eliminate cases where there was an autocratic or democratic transition in the year in which the leader came to power. In such cases it may be difficult to know for sure whether the leader in question was causing the transition. We have a total of 44 leaders who come to power in a year in which there was an autocratic transition, and 52 leaders that came to power in a year in which there was a democratic transition.Footnote 21 Column (2) of Table 6 looks at what happens when we drop the 44 leaders who came to power in the year of an autocratic transition. Again, the core result is robust. The regression reported in column (3) shows that the core result is also robust to dropping the 52 leaders who came to power in the year of a democratic transition. This indicates that the effect of democracy on the selection of an educated leader persists even if we drop all the data points for which the endogeneity of the political regime may be of particular concern.
We have also constructed a variable labeled “elected,” which indicates whether a leader came to power through an election or through another (nondemocratic) selection process. This indicator is set to zero for leaders who lead a democratic transition. In column (4) of Table 6, we first use the variable “elected” instead of the democracy dummy. This also predicts selection of a more highly educated leader. The coefficient on “elected” is similar in magnitude to the coefficient on the democracy dummy.Footnote 22
Finally, in column (5) of Table 6, we look at whether a leader comes to power via regular means as defined in the Archigos data set. We include this variable in addition to whether Polity IV classifies the country as democratic.Footnote 23 The core finding linking democracy and a leader's education remains. In addition, we find that regular entry is associated with a 12% greater chance of a leader having a graduate degree.
Although none of these exercises can completely rule out concerns about endogeneity of the political regime with respect to the leader's educational attainment, they show no evidence of fragility in the core finding. Indeed, the results in Table 1 are robust to all of these exercises.
CONCLUDING COMMENTS
This paper presents robust evidence that political selection with respect to education differs between autocracies and democracies. The evidence is drawn from a wide range of countries over more than 150 years and is robust to a wide range of estimation methods, variable definitions, and subsamples. The results suggest that democratically elected leaders are around 20% more likely to be highly educated than leaders chosen in autocracies.
The results provide convincing evidence that there is a difference between political institutions in the characteristics of those selected to be leader. This further fuels the impetus towards empirical investigation of political selection.
It is not beyond doubt that having more educated leaders as measured here increases the quality of government. However, given the large amount of evidence of the importance of education in private and public spheres, it would be surprising if there were no relationship between the leader's education and the quality of policy making.Footnote 24 Besley, Montalvo, and Reynal-Querol (n.d.) provide some evidence in this direction, showing that economic growth after a leader's death due to accident or illness varies with the leader's educational attainment.
But further investigation of how far the quality of government hinges on the characteristics of those that are selected for high office remains an important and challenging topic for future research.
DATA APPENDIX
Variable Definitions and Sources
Graduate Degree. A dummy that is equal to one if the leader has a graduate degree. Sources: Lentz (Reference Lentz1994, Reference Lentz1999); Britannica Online Encyclopedia, Academic Edition (http://www.britannica.com/); The Statesman's Yearbook Online (http://www.statesmansyearbook.com/about.html); Barcelona Center for International Affairs' Political Leaders Biographies (CIDOB) (http://www.cidob.org/en/documentation/biografias_lideres_politicos); and other online sources, as well as individual biographies from Lexis-Nexis.
Democracy. A dummy that is equal to one if the POLITY2 variable has a positive value in the year the leader is selected, and zero otherwise. Source: Marshall and Jaggers (Reference Marshall and Jaggers2005).
Log (GDP per capita) (All tables and columns except columns (9) and (10) of Table 1). Log of per capita income measured in the year when the leader is selected. Sources: Maddison (Reference Maddison2003); Table 1, columns (9) and (10), Penn World Tables 6.2.
Average Years of Education. The average years of schooling in the total population over 15. Source: Morrisson and Murtin (2009), measured in the year when the leader is selected.
Average Years of Education (Population over Age 25). The average years of schooling in the total population over 25, interpolated, from Barro and Lee (Reference Barro and Lee2001) for the sample 1960 onward. The variable is measured in the year that the leader is selected (original variable is tyr25). Source: www.barrolee.com.
College Degree. A dummy that has value 1 if the minimum education level of the leader is college, and zero otherwise. Sources: Lentz (Reference Lentz1994, Reference Lentz1999); Britannica Online Encyclopedia, Academic Edition (http://www.britannica.com/); The Statesman's Yearbook Online (http://www.statesmansyearbook.com/about.html); Barcelona Center for International Affairs' Political Leaders Biographies (CIDOB) (http://www.cidob.org/en/documentation/biografias_lideres_politicos); and other online sources, as well as individual biographies from Lexis-Nexis.
Studied Abroad. A dummy variable that has value 1 if the leader studied abroad and zero otherwise. Sources: Lentz (Reference Lentz1994, Reference Lentz1999); Britannica Online Encyclopedia, Academic Edition (http://www.britannica.com/); The Statesman's Yearbook Online (http://www.statesmansyearbook.com/about.html); Barcelona Center for International Affairs' Political Leaders Biographies (CIDOB) (http://www.cidob.org/en/documentation/biografias_lideres_politicos); and other online sources, as well as individual biographies from Lexis-Nexis.
Democracy Boix-Rosato. A dummy variable that has value 1 if the country is considered democratic following the definition in Przeworski et al. (Reference Przeworski, Alvarez, Cheibub and Limongi2000). Taken at the year the leader is selected. Source: Boix and Rosato (Reference Boix and and2001)
Average Political Instability. Percentage of past leaders who lost power by irregular means (coups, revolutions, or assassinations). Following Archigos definition of exit by irregular means. Source: Goemans, Gleditsch, and Chiozza (Reference Goemans, Gleditsch and Chiozza2006).
Occupational Dummy Variables. Military Professional, Lawyer. Dummies that are equal to 1 if the leader was in the military, or was a lawyer, immediately before holding office. Sources: Lentz (Reference Lentz1994, Reference Lentz1999); Britannica Online Encyclopedia, Academic Edition (http://www.britannica.com/); The Statesman's Yearbook Online (http://www.statesmansyearbook.com/about.html); Barcelona Center for International Affairs' Political Leaders Biographies (CIDOB) (http://www.cidob.org/en/documentation/biografias_lideres_politicos); and other online sources, as well as individual biographies from Lexis-Nexis.
Elected. A dummy that is equal to one if the leader was elected in the first instance. Sources: Ludwig (Reference Ludwig2002) and Lentz (Reference Lentz1994, Reference Lentz1999).
Regular Entry. A dummy variable that is equal to one if the leader came to power via regular means as defined in the Archigos dataset. Source: Goemans (Reference Goemans, Gleditsch and Chiozza2006).
Sample Construction
The Archigos project collects data from 1875 to 2004.Footnote 25 It provides information on the exact dates between which leaders have been in power. For each state, Archigos identifies the primary ruler, the way in which leaders entered and left power, the post-tenure fate of the leader, and personal data such as date of birth/death and gender. As Archigos explains, many countries have more than one leader. In some cases, the formal headship of state may be a ceremonial position, as in many present-day European monarchies. Archigos attempts to identify the actual effective ruler based on its knowledge of the particularities of each state. However, there are a small number of exceptions based on the Gleditsch and Ward (Reference Gleditsch and Ward1999) sample. Thus, if a country is conquered or occupied but is governed by an autonomous leader, then those leaders are included in the data. This was the case, for example, in Denmark between 1940 and 1943 or Estonia in 1940. This creates a small number of inconsistencies with the Polity IV data, which code such cases as regime transitions. For each leader the Archigos data provide information on the start and end date, creating a leader-spell. Because some leaders have more than one spell in office, the same leader may have more than one start date and end date.
We supplement data in Archigos using Ludwig (Reference Ludwig2002), which includes all leaders from independent states who held power as the “chief executive” for any length of time, mainly for the period between 1900 and 2000. The data list some leaders who were in office between 1848 and 1900. These data are based on de facto leaders, i.e., those judged to have the greatest political authority, with or without formal titles or positions. For inclusion in his database, the chief executive may share power with other branches of government such as a legislature or council. However, they are adjudged not to be sharing power equally with other individuals, such as a junta. In other words, in his assessment, the leader has to be “in charge.” In order to establish the list of leaders Ludwig (Reference Ludwig2002) uses Lentz (Reference Lentz1999) as well as the “Rulers” database from the geocities webpage (http://www.geocities.com/Athens/1058/rulers.html). To decide whether real executive power was vested in a monarch, president, or prime minister, his data also use Britannica Online, the Library of the Congress Country Studies, and a number of country level studies. The Europa World Year Book for 1997, 1998, 1999 and Lexis–Nexis Academic Universe were consulted for information on many late-century leaders who were neglected by Lentz (Reference Lentz1999) and Britannica.
Using the sample of leaders established in this way, we collected a new dataset on the education of leaders following Ludwig (Reference Ludwig2002)'s criteria. Our data cover 1,672 leaders of the potential set of 2,097 leaders identified by Archigos and Ludwig (Reference Ludwig2002). For 1,468 leaders of the 1,672, we use the Encyclopedia of Heads of States and Governments, Encyclopedia Britannica, Statesman's Yearbook, and other online sources, as well as individual biographies from Lexis—Nexis. Ludwig (Reference Ludwig2002) provides information on the education of only 333 leaders.Footnote 26 We used his data to cross-check our findings. In a few cases, they were used to fill in the information on education in cases where we could not find any information ourselves. In completing this exercise, we were careful to exclude honorary degrees obtained during or after a leader's spell in office. We separate our sample into high-quality data, where we are confident in our assessment of a leader's educational attainment, and a lower-quality sample, where we feel that the sources are less secure. The lower-quality sample contains information for an additional 204 leaders, taking the sample size to 1,654 leaders. We collected information on whether the leader was educated abroad from the same sources as the basic education data.
We have a total of 197 countries for which a leader is listed between 1848 and 2004, using the previous sources. We pick one leader per year to give us a total of 2,097 leaders and a total of 2,486 leader-spells in office. In cases where more than one leader is in office in a given year, we focus on the leader who was in office for the longest time period during the year. In our core results in column (1) of Table 1, we have 1,146 leaders from 146 countries and data from 1872 to 2004. The results in column (1) of Table 5 come from a sample of 1,529 leaders drawn from 161 countries over the period from 1848 to 2004.




Comments
No Comments have been published for this article.