1. Introduction
1.1. Objectives
Much of the diapycnal mixing in the stratified deep ocean takes place over and close to the continental slopes. Several processes, including the up- or down-slope flows in Ekman boundary layers generated by along-slope flows, may contribute to this mixing (Phillips Reference Phillips1970; Wunsch Reference Wunsch1970; Thorpe Reference Thorpe1987a). However, the breaking of internal waves in boundary layers termed ‘internal surf zones’ by Hogg (Reference Hogg1971) generally appears most likely to support the turbulent mixing (Munk Reference Munk1966; Armi Reference Armi1978; Eriksen Reference Eriksen1985; Garrett & Gilbert Reference Garrett and Gilbert1988; Munk & Wunsch Reference Munk and Wunsch1998; Wunsch & Ferrari Reference Wunsch and Ferrari2004; wave breaking over continental slopes is reviewed by Lamb Reference Lamb2014). Such wave-induced boundary mixing is also locally significant over the slopes surrounding some seamounts (Eriksen Reference Eriksen1998).
It is remarkable that effects apparently associated with wave reflection from uniform slopes are so clearly evident in the observed near-slope spectra of internal waves (Eriksen Reference Eriksen1982, Reference Eriksen1998) even though the actual bottom slopes are not extensively uniform and, in their theoretical representation, the internal waves and stratification are idealized. Further investigation into effects not represented in the existing theories of internal waves near sloping boundaries is therefore merited to discover the limitations of the theories in their application to the real ocean.
A simplifying assumption is often made; internal wave trains are supposed to be uniform. In reality, there is a tendency for waves to have an uneven, group-like structure, although sometimes they appear as beams or rays (e.g. as described by Tabaei & Akylas Reference Tabaei and Akylas2003; Lamb Reference Lamb2004; Johnston et al. Reference Johnston, Rudick, Carter, Todd and & Cole2011; Karimi & Akylas Reference Karimi and Akylas2014; Chalamalla & Sarkar Reference Chalamalla and Sarkar2016; Dauxois et al. Reference Dauxois, Joubaud, Odier and Vanaille2018; Fan & Akylas Reference Fan and Akylas2019, Reference Fan and Akylas2020; Leclair, Raja & Staquet Reference Leclair, Raja and Staquet2020). The structure of the wave groups is important, e.g. substantial differences are known to exist in the mean flows induced by one-, two- and three-dimensional internal wave packets (van den Bremer & Sutherland Reference van den Bremer and Sutherland2018; van den Bremer, Yassin & Sutherland Reference van den Bremer, Yassin and Sutherland2019). Motivated by the commonly observed effects that incoming surface wave groups have in the surf zones that border the edge of the sea (e.g. the periodicity of high waves and breakers that is familiar to surfers and apparent to those paddling on sandy beaches), our objectives are to investigate how mixing over sloping boundaries far beneath the ocean surface may be affected by a group-like structure of incident internal waves and to show how the internal wave groups themselves are modified by reflection from sloping boundaries.
Some existing knowledge of internal waves and groups on which later results depend is summarized in the following parts of § 1.
1.2. Internal waves, wave groups and their breaking
1.2.1. Internal waves
In a fluid with constant buoyancy frequency, N, and Coriolis frequency, f, internal inertial gravity waves of frequency σ have the dispersion relation
 \begin{equation}{\sigma ^2} = {N^2}s_\beta ^2 + {f^2}c_\beta ^2,\end{equation}
(e.g. Gill Reference Gill1982), where β is the inclination of the group velocity to the horizontal and sβ and cβ equal sinβ and cosβ, respectively. The phase and group velocities of the waves in a two-dimensional (X, Z) vertical plane of the waves are given by
 \begin{equation}\boldsymbol{c} = [\sigma /({K^2} + {M^2})](K,M),\end{equation}
and
 \begin{equation}{\boldsymbol{c}_{\boldsymbol{g}}} = \{ \sigma KM({N^2}\text{--}{f^2})/[({K^2} + {M^2})({N^2}{K^2} + {f^2}{M^2})]\} (M, - K),\end{equation}
respectively, where (K, M) is the wavenumber of the waves and X and Z are horizontal and vertical axes. Since the dot-product of the vectors  $\boldsymbol{c}\boldsymbol{\cdot }{\boldsymbol{c}_g} = 0$, the phase velocity is normal to the group velocity.
1.2.2. The generation of wave groups and modulated rays
An internal wave group consists of a packet of relatively high or steep waves. Groups may be generated in the ocean in at least three ways (Thorpe Reference Thorpe2010): by the occasional superposition of waves propagating with similar wavenumbers, and therefore frequencies; through a Benjamin--Feir type of instability of an existing train of internal waves; and by the radiation of packets of waves from transient moving disturbances or regions of instability within or at the boundaries of the ocean. Rays or beams, modulated in amplitude by the spring-neap cycle of the tides and thus forming groups, can be generated by tidal flows over rough topography, and radiate away to reach distant sloping oceanic boundaries (see e.g. Lamb Reference Lamb2004; Johnston et al. Reference Johnston, Rudick, Carter, Todd and & Cole2011). For simplicity, and not because all wave groups are known to have these properties, we choose to confine attention to roughly symmetrical incident groups containing waves with a relatively narrow frequency bandwidth propagating with a speed and direction given by the local group velocity and without significant change in shape as they approach a sloping boundary. After reflection, groups may be twisted (§ 2.2) and symmetry is diminished.
1.2.3. The size of internal wave groups
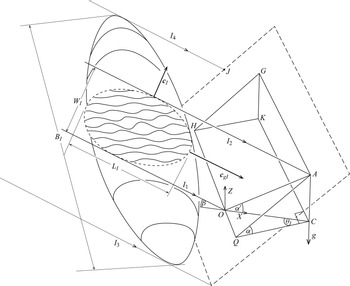
Incident groups of roughly ellipsoidal form are considered, like that sketched in figure 1. Three measures of the size of an incident wave group (denoted by subscript I; subscript R will later stand for ‘reflected’) are defined, as shown in the figure: LI is the length of the group in the direction, cgI, of its propagation; WI is its width in the direction, cI, of the phase propagation of its component waves; and BI is the breadth of the group in the third direction, that of the vector cross-product,  ${\boldsymbol{c}_{\boldsymbol{I}}} \times {\boldsymbol{c}_{\boldsymbol{gI}}}$. Thorpe (Reference Thorpe2010) finds that the time for which internal wave groups can persist before dispersing depends upon their shape. Two-dimensional groups (with very large BI/WI) have greater lifetimes than three-dimensional groups. Such groups frequently have their longer axes inclined at an angle to the horizontal that is close to the inclination of the group velocity, β. Because the most stable wave groups are those most likely to be observed in the ocean (provided that mechanisms exist for equitable generation), LI is chosen here to be the extent of a group in the propagation direction. Thorpe shows that groups with relatively large LI/WI (as in rays or beams) and those with
 ${B_I}/{W_I} \gg 1$, are expected to last longest and are, in this sense, the most stable.
A sketch of a wave group (the elliptical or zeppelin-shaped region at the left) approaching a sloping plane boundary (dashed lines at the right), part of which is indicated by the area AQHG. The boundary is at an angle α to the horizontal plane, CQOHK, and extends indefinitely beyond this inclined area e.g. out to and beyond the rectangular area indicated by the dashed lines. The line AG is at a shallower isobath on the slope than QOH. Isopycnal wave displacements are shown within a vertical section through the group. They are within the elliptically shaped dashed region of length, LI, width WI and breadth, BI, defining the dimensions of the group. The group is bounded vertically by lines I 1 and I 2 and horizontally by I 3 and I 4. The section moves in the direction of advance of the group, c gI. The group propagates with the group velocity of its component waves at an azimuthal angle OCQ, equal to θI, to the slope. Lines of constant phase in the waves are aligned in the direction cgI and advance at phase velocity cI (see also figure 16). Axes (X, Z) are horizontal and vertical in the plane of the waves. The effective slope, angle α/, is in the plane (X, Z) of the waves of this incident group.

1.2.4. The causes of internal wave breaking
Internal wave breaking may be caused by a local instability in the wave field induced by the waves themselves: through convective instability of steep waves (Orlanski & Bryan Reference Orlanski and Bryan1969; Moum et al. Reference Moum, Perlin, Klymak, Levine, Boyd and Kosro2004; Lamb Reference Lamb2014; Zhang & Alford Reference Zhang and Alford2015) or by self-induced Kelvin–Helmholtz (K–H) shear instability (Woods Reference Woods1968; Thorpe Reference Thorpe1999a; Moum et al. Reference Moum, Farmer, Smyth, Armi and Vagle2003; Troy & Koseff Reference Troy and Koseff2005; van Haren & Gostiaux Reference van Haren and Gostiaux2010; Zhang & Alford Reference Zhang and Alford2015; Carr et al. Reference Carr, Franklin, King, Davies, Grue and Dristschel2017). Near sloping boundaries such instabilities can be promoted through the reflection and steepening of incident waves. Furthermore, in conditions to be considered in §§ 1.3.7 and 3, resonant interactions between the incident and reflected waves travelling in groups may lead to wave instability and hence breaking (Thorpe Reference Thorpe1987b, Reference Thorpe2000; Leclair et al. Reference Leclair, Raja and Staquet2020). Fronts may also be produced within the surf zone and may strongly modulate mixing (Legg & Adcroft Reference Legg and Adcroft2003; van Haren & Gostiaux Reference van Haren and Gostiaux2012). Thorpe (Reference Thorpe1987a), White (Reference White1994) and Hosegood & van Haren (Reference Hosegood and van Haren2004) observe fronts explained as a consequence of reflection in near-critical conditions when β ≈ α (see § 1.3.4, later) whilst Gemmrich & van Haren (Reference Gemmrich and van Haren2001) report thermal fronts occurring with M 2 tidal period caused by internal tides propagating downwards (offshore) from the continental shelf break in the Bay of Biscay. We leave such internal fronts and the effects of mean flows, possibly generated by reflecting wave groups, for consideration elsewhere.
1.2.5. Breaking of waves propagating in wave groups
Phillips (Reference Phillips1966) recognizes that, in the Boussinesq approximation, the equations for the density and the velocity components of internal waves in a uniform density gradient, together with (1.1) and (1.2), form an exact, finite amplitude, solution of the inviscid and non-diffusive equations of motion. Uniform plane wave beams of infinite along-beam extent are also exact solutions of the nonlinear inviscid equations of motion (McEwan Reference McEwan1973; Tabaei & Akylas Reference Tabaei and Akylas2003). It may be expected that these solutions provide a valid base from which to determine the motion of breaking, or extreme, regions in wave groups containing finite amplitude waves; the precise effects of the finite length of wave beams representing wave groups are, however, as yet uncertain (Karimi & Akylas Reference Karimi and Akylas2014) and deserve further investigation.
The breaking of multiple waves in a group is described in appendix A and illustrated in figure 16. A region in which internal waves break within an internal wave group propagates with vector
 \begin{equation}{\boldsymbol{c}_{\boldsymbol{b}}} = \boldsymbol{c} + {\boldsymbol{c}_{\boldsymbol{g}}},\end{equation}
or using (1.2)
 \begin{equation}{\boldsymbol{c}_{\boldsymbol{b}}} = [\sigma /({N^2}{K^2} + {f^2}{M^2})](K{N^2},M{f^2}),\end{equation}
lying between the phase vector, c, of the internal waves and the group vector, cg, of the waves and the group to which they belong (see inset in figure 16). The time interval between the onset of breaking in successive waves is T = 2π/σ, the wave period, and the vector, cb, defining the advance of breaking region in a group is inclined at an angle
 \begin{equation}\gamma = {\tan ^{ - 1}}({F^2}/{t_\beta }),\end{equation}
to the horizontal, where F = f/N and tβ = tanβ (Thorpe Reference Thorpe1988).
1.2.6. Continuity of wave breaking
Wave breaking in groups is more extensive and therefore more effective when it occurs continuously and persistently in a local region, rather than intermittently. Continuity of the breaking region in groups is described by Thorpe (Reference Thorpe1999b) and for easy reference is briefly reviewed in appendix B. It is germane to the discussion following in § 4.
1.3. Reflection of internal waves from a slope
1.3.1. The sloping lateral boundaries of oceans
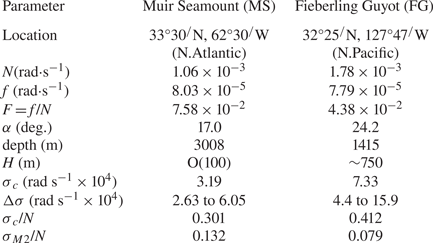
The mean slope or angle, α, of inclination of the surface of the continental slope to the horizontal is about 2°–4° (Cacchione, Pratson & Ogston Reference Cacchione, Pratson and Ogston2002). Locally, slopes may reach 12° (e.g. Thorpe & White Reference Thorpe and White1988). The slopes surrounding seamounts are typically 17°–25° (Eriksen Reference Eriksen1982, Reference Eriksen1998, and as shown later in table 2). Stratification is maintained, on average, over a sloping boundary and, although hydraulic jumps associated with internal tides and overturning waves are known temporally to modify and substantially reduce the stratification (e.g. Thorpe Reference Thorpe1987a), it is customary to describe the local dynamics in terms of reflecting internal waves in a uniform density gradient, as we shall do here.
1.3.2. Linear theory of wave reflection
Müller & Briscoe (Reference Müller and Briscoe2000, their figure 4) provide a summary of the effects of internal waves on the layer over a sloping boundary, including the generation of along-slope flows and – a subject of the present study – wave interactions. The wave frequency and wavenumber components parallel to the uniform sloping boundary are conserved on reflection. Conservation of frequency implies that, through (1.1), the inclination, β, of the vector group velocity of a reflected wave group of waves of a given frequency is the same as that of the incident group (Phillips Reference Phillips1966). Conservation of wavenumbers leads to an expression for the ratio of the vertical wavenumbers of the reflected and incident waves
 \begin{equation}|{M_I}/{M_R}|= \textrm{ |}t_\beta ^2 - t_\alpha ^2|/[t_\alpha ^2 + t_\beta ^2 + 2{t_\alpha }{t_\beta }{c_{{\theta _I}}}],\end{equation}
(derived, with amended notation, from Eriksen Reference Eriksen1982), where tα = tanα and  ${c_{{\theta _I}}} = \cos {\theta _I}$.
1.3.3. Wave azimuth
The azimuthal direction of the incident wave group, θI, is defined as the angle between the vertical (X, Z) plane of the incident wave group and the horizontal direction, QC, normal to the direction of slope isobaths in figure 1; θI = 0° defines a plane normal to the isobaths.
The azimuth, θR, of the reflected wave in terms of θI is given by Eriksen (Reference Eriksen1982) and can be written as
 \begin{equation}{\theta _R} = {\cos ^{ - 1}}[{\pm} \{ [2{t_\alpha }{t_\beta } + (t_\alpha ^2 + t_\beta ^2){c_{{\theta _I}}}]/[t_\alpha ^2 + t_\beta ^2 + 2{t_\alpha }{t_\beta }{c_{{\theta _I}}}]\} ],\end{equation}
where the sign is positive or negative depending on whether α < β or α > β.
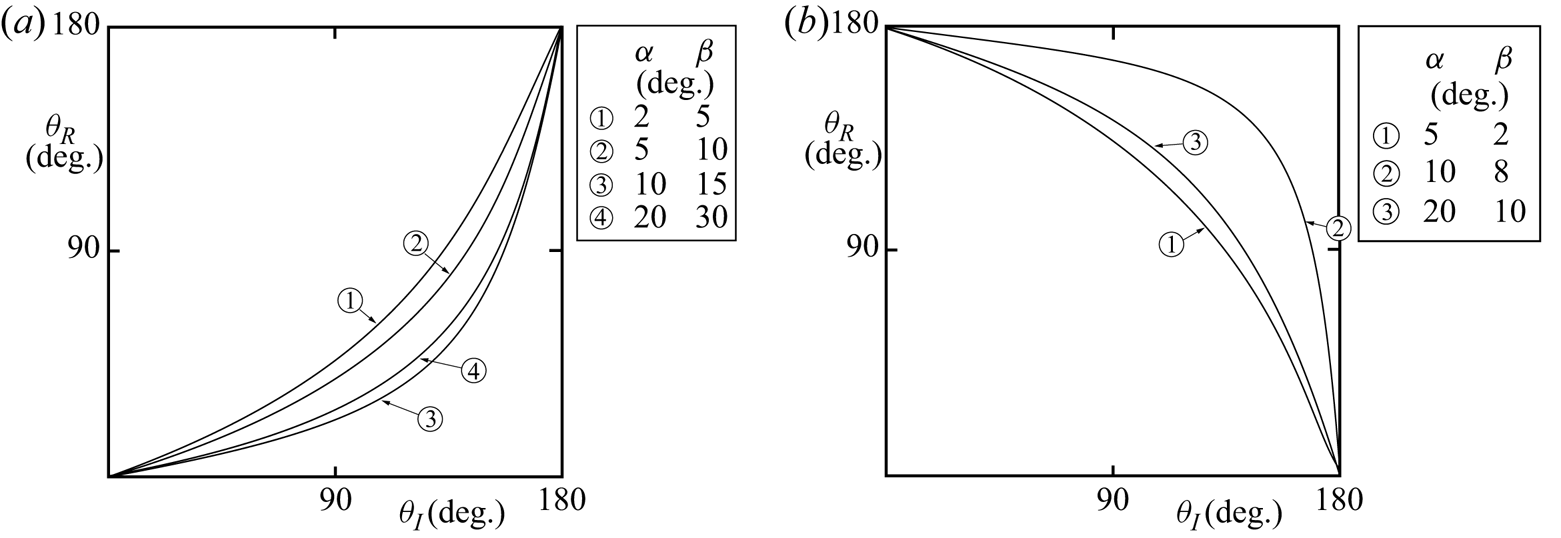
Figure 2 shows the variation of θR with θI at selected α and β. (The values of α and β chosen in this and later figures are not intended to be comprehensive but illustrate the ranges and variation of the various parameters that depend upon them, particularly over continental slopes and sides of seamounts.)
The variation of the azimuth angle of the reflected waves, θR, with that of incident waves, θI, for selected α and β: (a) α < β or σ < σc (subcritical waves); (b) α > β or σ > σc (supercritical waves).

1.3.4. Critical conditions
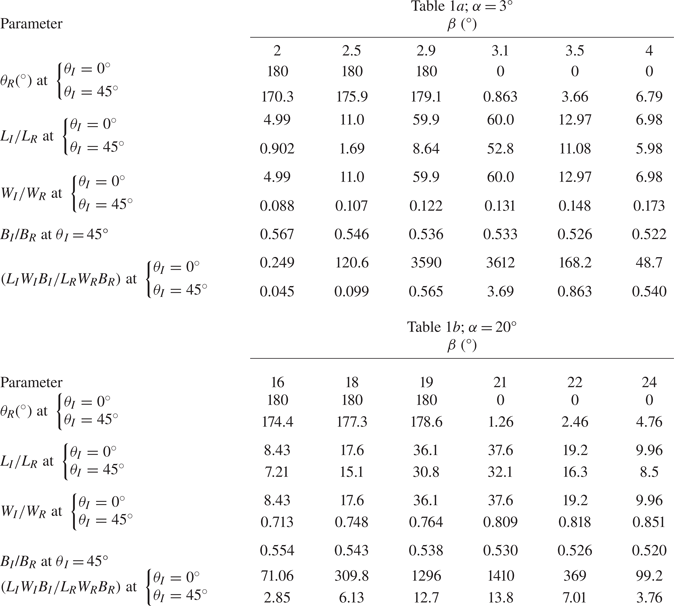
Critical conditions with reflected wave properties that are substantially enhanced occur when β ≈ α (Eriksen Reference Eriksen1982, Reference Eriksen1985, Reference Eriksen1998; Ivey & Noakes Reference Ivey and Noakes1989; Taylor Reference Taylor1993; Ivey, Winters & de Silva Reference Ivey, Winters and de Silva2000; Gemmrich & Klymak Reference Gemmrich and Klymak2015) even when θI ≠ 0°. (Examples are given later in table 1.) For example, the ratio of vertical wavenumbers, |MI/MR| given by (1.5) tends to infinity as β tends to α. The frequency, σ = σc, of critical waves is given by (1.1) with β = α. Subcritical waves are those with σ < σc or β > α, as in figure 2(a). Waves with azimuth angle 0° < θI < 90° advance with a positive up-slope component, towards shallower water. The corresponding reflected waves have 0° < θR < 90° but with θR < θI, representing waves travelling more closely up-slope than the incident waves. Points with 90° < θI < 180° represent incident waves that advance down-slope towards deeper water. The reflected waves have θR < θI, but travel down-slope only when θR exceeds 90°; there is a range with θI in which the incident waves travel down-slope whilst the reflected waves travel up-slope. Supercritical waves are those with σ > σc or β < α, as in figure 2(b). For 90° < θR < 180° reflected waves travel towards deeper water. In this range the incident wave direction varies from zero to a value exceeding 90°; from directly up-slope to a direction with a component that is down-slope.

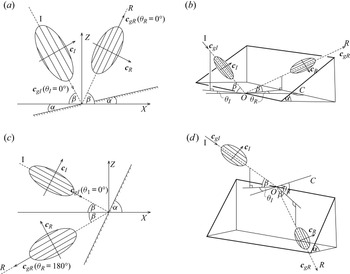
For sake of argument and simplicity, the incident groups are chosen to be as illustrated in figure 3; the incident group velocities have positive horizontal components in the up-slope direction and downward vertical components. In this and subsequent figures the groups are shown diagrammatically, and incident and reflected waves and groups are not to scale. Figure 3 is in four parts: panels (a) and (c) have θI = 0° and (b) and (d) have θI > 0°, while panels (a) and (b) have α < β (subcritical) and (c) and (d) have α > β (supercritical). Supercritical waves that approach the slope in an upward direction are not given special consideration. The reflected subcritical waves must always be above the slope but supercritical reflected waves, as in (d), lie along the slope when  ${\theta _I} = {\cos ^{ - 1}}( - {t_\beta }/{t_\alpha }), = {\theta _{Ic}}$ say, and the range of θI > θIc is later excluded in figures 5(b) and 6(b).
The reflection of wave groups from the plane boundary. In panels (a) and (c) the incident waves are at zero azimuth (i.e. θI = 0°: two-dimensional reflection). Panels (b) and (d) show groups approaching and departing from the boundary in three-dimensions. Incident and reflected wave groups are labelled I and R, respectively. In panels (a) and (b) α < β (subcritical) and in (c) and (d) α > β (supercritical). The slope in (b) and (d) is delineated by bold lines. The wave groups are indicated diagrammatically by elliptical shapes approaching or departing from the slope at velocities cgI and cgR along dashed lines parallel to lines of constant phase. The line CO is in a horizontal plane normal to isobaths on the slope.

1.3.5. The effective slope
The ‘effective slope’, α/ -- the angle AOC in figure 1 -- is given by
 \begin{equation}{\alpha ^/} = {\tan ^{ - 1}}({c_{{\theta _I}}}{t_\alpha }).\end{equation}
The effective slope is that encountered by the incident or reflected wave group at an azimuth angle, θ. When α > β, the effective slope at θI = θIc is α/ = 90° − β.
1.3.6. Relative changes of wave properties on reflection
The ratio of the group velocities of the incident and reflected waves is given by
 \begin{equation}{\boldsymbol{c}_{gI}}/{\boldsymbol{c}_{gR}} = |{M_R}/{M_I}|.\end{equation}
Defining  ${s_{(\alpha + \beta )}}/{s_{(\beta - \alpha )}}[ = ({t_\alpha } + {t_\beta })/({t_\beta }\text{--}{t_\alpha })]$ to be equal to R, the ratio in (1.8) is equal to R at zero azimuth when β > α and, with the adopted selection of incident waves, −R, when β < α. This implies, for example, that when α < β, the vertical wavenumber of waves in a group of zero azimuth increases on reflection (so that the vertical wavelength decreases) and the group speed decreases.
The wave amplitude ratio is
 \begin{equation}{A_I}/{A_R} = {M_I}/{M_R},\end{equation}
(Eriksen Reference Eriksen1982), whence the wave slope ratio is
 \begin{equation}{A_I}{M_I}/{A_R}{M_R} = {({M_I}/{M_R})^2}.\end{equation}
The wave slope provides a measure of the maximum steepness of isopycnal surfaces (Thorpe Reference Thorpe2018) with overturning and convective instability possibly leading to mixing if the wave slope exceeds unity (e.g. Legg & Adcroft Reference Legg and Adcroft2003). The reflected wave slope, ARMR, becomes relatively large when the direction of the incident wave, β, is near critical. For example, for waves of zero azimuth when the wave slope is increased by a factor R 2, the wave slope is increased on reflection by a factor exceeding 10 if β is between tan−1(0.52tα) and tan−1(1.93tα).
1.3.7. Interactions between incident and reflected waves
There are numerous known possibilities for interactions between incident wave trains and those reflected from a slope of small angle, α, that may lead to instability. These include self-induced convective, K–H instabilities and PSI (parametric subharmonic instability; Karimi & Akylas Reference Karimi and Akylas2014; Fan & Akylas Reference Fan and Akylas2019). Chalamalla & Sarkar (Reference Chalamalla and Sarkar2016) examine the instability of a wave beam to PSI following reflection from a slope. Critical conditions may occur not only when σ = σc as in § 1.3.4, but also when the inclination, nhβ, of a harmonic of the incident wave train matches that of the slope, or at frequencies corresponding to  $\beta = {\sin ^{ - 1}}({s_\alpha }/{n_h})$, where nh = 2, 3, … is the number of the harmonic (Thorpe Reference Thorpe2000). Resonant interactions between the incident and reflected waves are also possible: e.g. Thorpe (Reference Thorpe1987b when f/N = 0, and (Reference Thorpe1997) when f/N ≠ 0) shows that, at zero azimuth, there are two sets of values of α less than 8.4° when β < 30° (decreasing as f/N increases from zero) at which resonant interactions can occur at second order. Interaction then promotes waves of frequency 2σ having wavenumbers 2k parallel to the slope, twice the wavenumbers, k, of the incident and reflected waves parallel to the slope. Similarly there are two sets of values of α less than 11.8° when β < 19.5° at which resonant interactions are found at third order, interaction then promoting waves of frequency 3σ and wavenumber 3k parallel to the slope (Thorpe Reference Thorpe1987b). The likelihood of effective resonant interactions occurring between incident and reflected waves is greater than that in waves remote from a slope because, during reflection, they are locked together in phase.
1.4. Contents
Changes in the dimensions of reflecting wave groups with azimuth angles, θI, are examined in § 2. Resonant interactions between incident and reflected wave groups can only take place within the fluid volumes in which they can co-exist in space and time. This is examined in § 3. The group structure of the incident waves results in there being a maximum height, h, of fluid over the slope within which the incident and reflected waves in a group may spatially and temporally co-exist, and therefore possibly interact (§ 3.1). The height, h, depends on θI and on spatial and temporal conditions that depend on the relative aspect ratios of the incident and reflecting wave groups (§ 3.2). In § 4 conditions are derived in which wave breaking will persist in time close to a slope. The necessary conditions are generally found to be possible only at small angles of slope, typical of those of the oceanic continental slopes. The results and some available observations are summarized and discussed in § 5. The final section, § 6, lists some of the assumptions made about groups. The need for further observations of the variability of internal waves and their group-like structure in the ocean is emphasized.
2. Distortion of an incident wave group on reflection
2.1. Length, width and breadth of reflecting groups
The wavelength of waves with wavenumber (K, M) is 2π/κ, where κ = (K 2 + M 2)1/2, and since KI/MI = KR/MR = tβ, the ratio of the wavelengths of the waves in incident and reflected groups is λI/λR = MR/MI. The time over which a wave group with length LI and speed cgI encounters a slope is the same as that over which it departs but with length LR and speed cgR. It follows that ratio of the lengths of reflecting groups measured in the directions of their propagation is
 \begin{equation}{L_I}/{L_R} = {\boldsymbol{c}_{gI}}/{\boldsymbol{c}_{gR}},\end{equation}
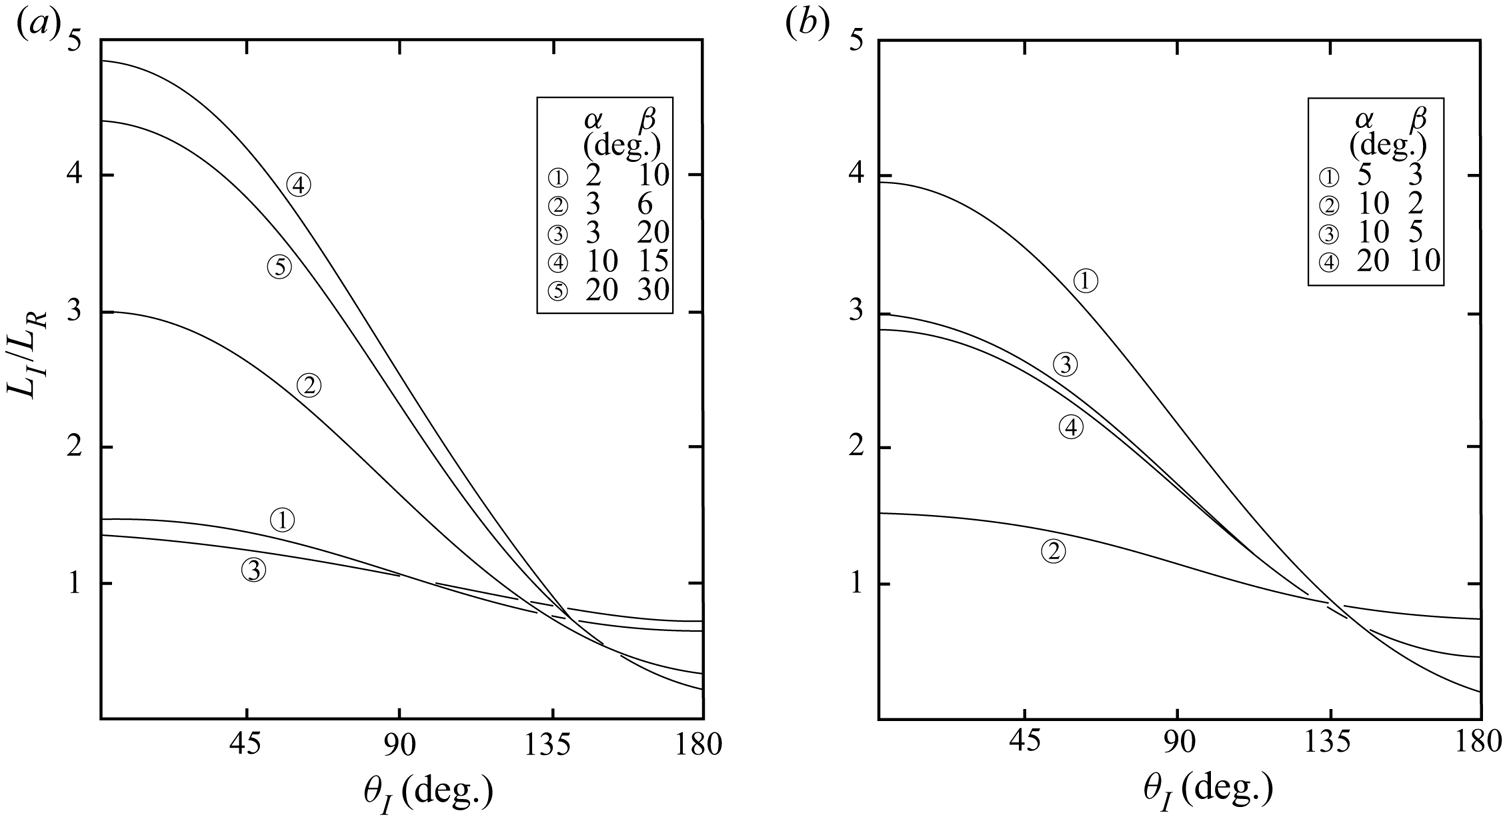
which is found using (1.8) and (1.5) and shown in figure 4. The ratios at zero incident azimuth, θI = 0°, are equal to R (defined in § 1.3.6) when β > α and, with the adopted selection of incident waves, (−R) when β < α. The lengths of wave groups are generally reduced on reflection (i.e. LI/LR > 1) at small or moderate θI, but the lengths of reflected groups generally exceed those of the incident groups when θI > 130°.
The ratio of the lengths of incident and reflected groups, LI/LR, measured in the directions of their propagation, as a function of the incident azimuthal angle, θI: (a) α < β and (b) α > β.

The ratio of the widths, WI/WR, of the incident and reflected wave groups can be found as described in appendix C.1
 \begin{equation}{W_I}/{W_R} = {s_{({\alpha ^/} + \beta )}}/\sin \{ {\cos ^{ - 1}}[{s_{{\alpha ^/}}}{s_\beta } + {c_{{\alpha ^/}}}{c_\beta }{c_{({\theta _I}\text{--}{\theta _R})}}]\} .\end{equation}
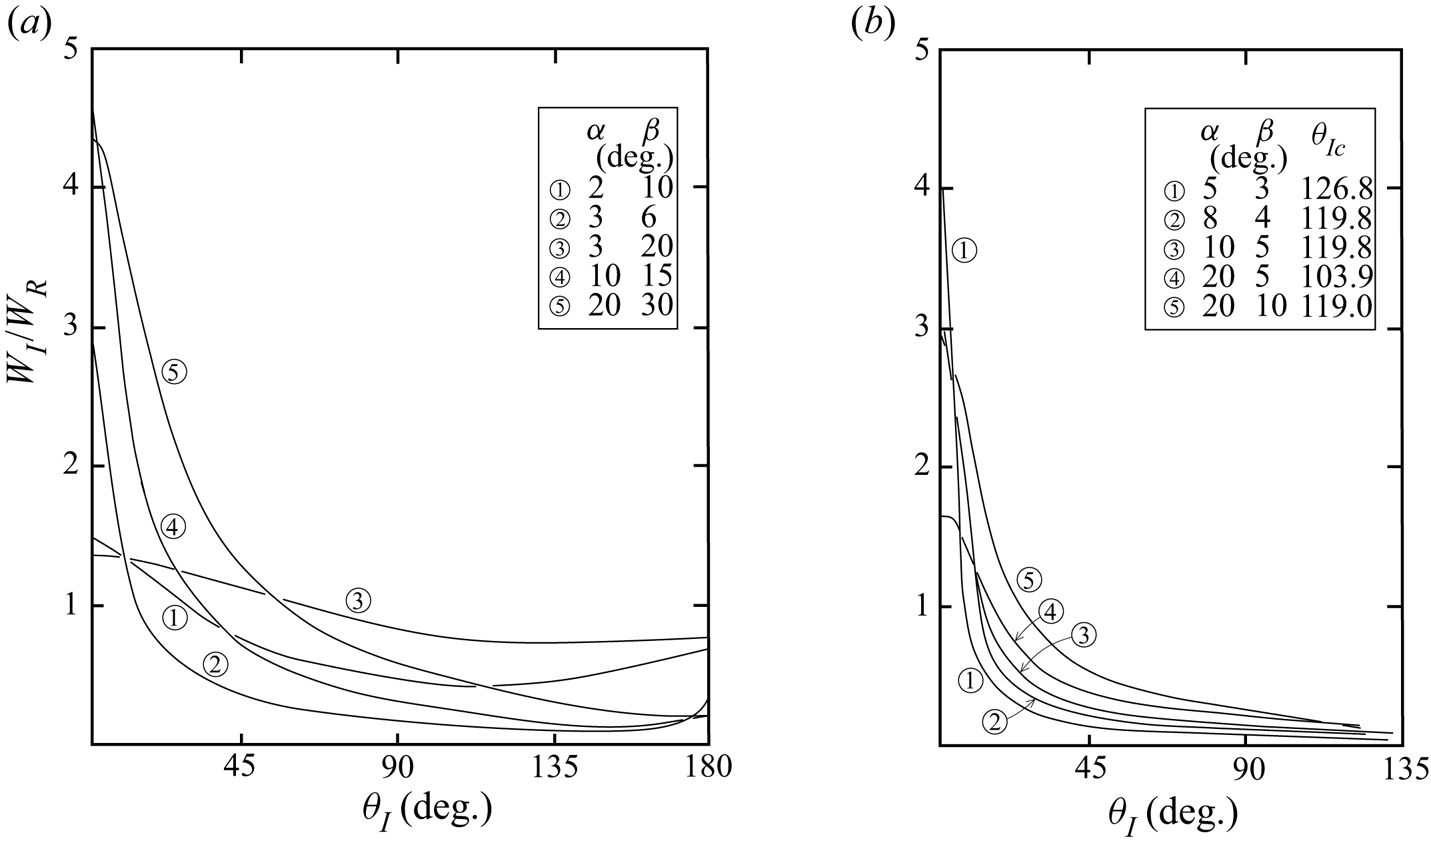
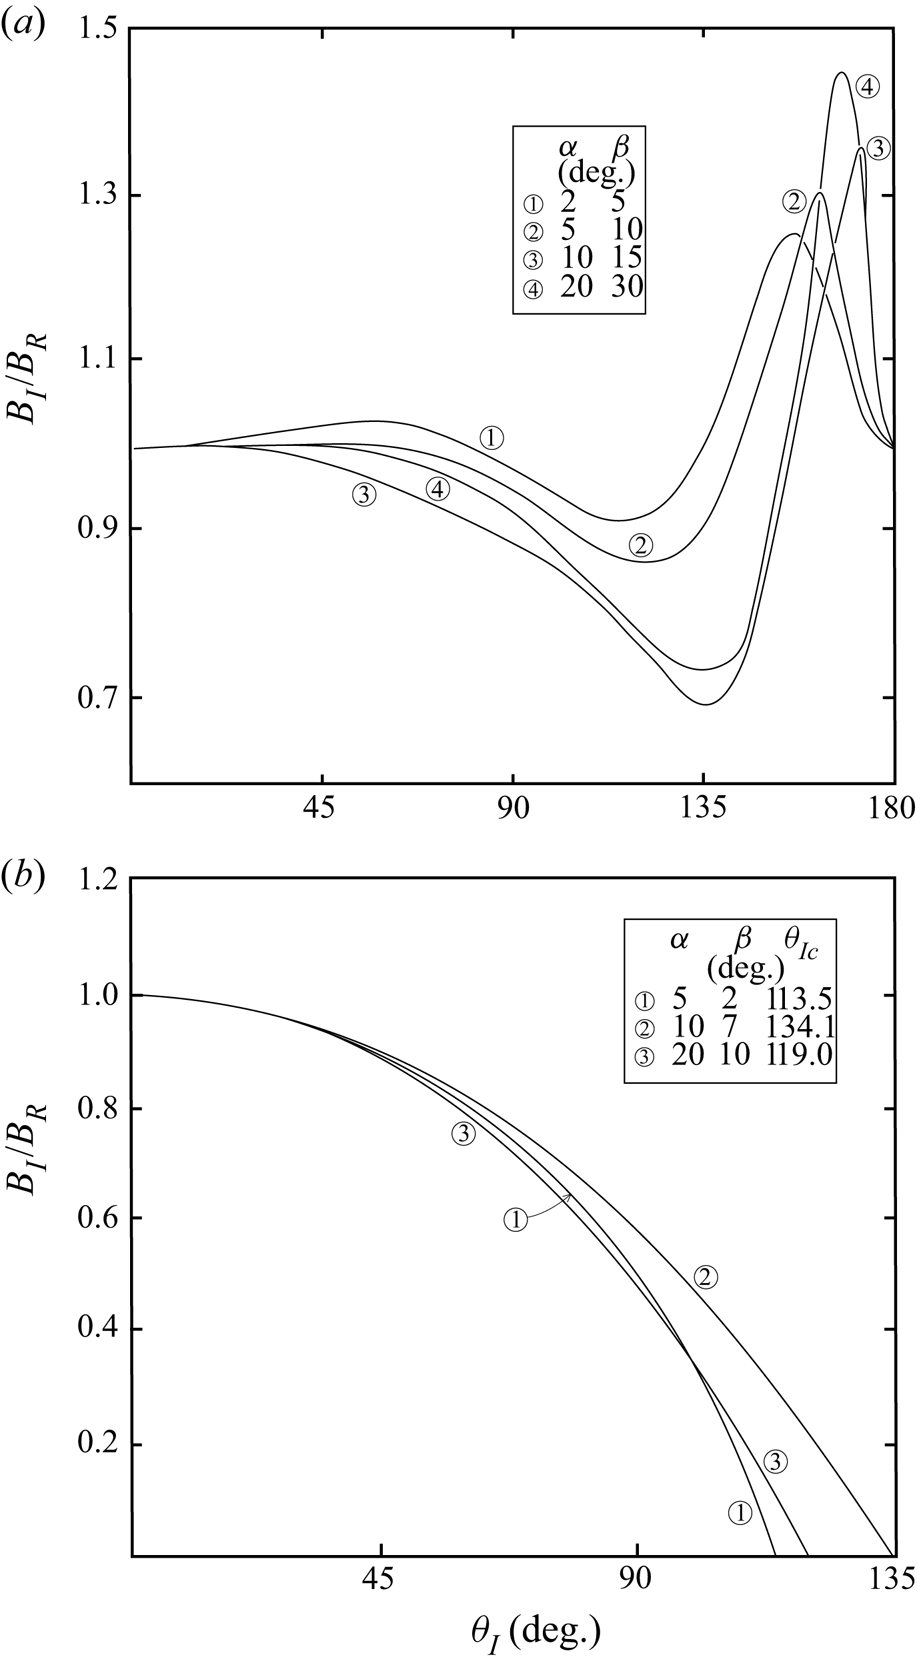
This ratio is shown in figure 5 for various α and β. It generally decreases with increasing θI. Widths of the reflected groups are substantially less than those of the incident at small θI but increase to values that are generally greater when θI > 60°, i.e. when WI/WR = 1. The relative breadths, BR, of the reflected wave groups are found in appendix C.2. The ratio BI/BR is given by (A3) and (A4) and is shown in figure 6 as a function of θI for various α and β. The breadths of the incident and reflected groups are approximately equal for θI < 40° and when α < β, although the breadth of the incident groups exceeds that of the reflected by approximately 20 % near θI = 160°, compared to the changes in length and width, the breadth of groups is only moderately changed on reflection.
The ratio of the widths of the incident and reflected groups, WI/WR, as a function of the incident azimuthal angle, θI. Panel (a) α < β and (b) α > β. The parameter θIc is defined in § 1.3.4.

The ratio of the breadths of the incident and reflected groups, BI/BR, as a function of the incident azimuthal angle, θI, at specified values of (a) α < β and (b) α > β.

The ratio LIWIBI/LRWRBR provides a measure of the relative volumes of the incident and reflected wave groups. Its variation with θI may be inferred from figures 4–6. When α < β, the volume of an incident wave group is generally greater than that of the reflected group at small θI; the ratio LIWIBI/LRWRBR equals R 2 and exceeds unity at θI = 0°. The ratio, however, decreases as θI increases. For example, if (α, β) = (3°, 6°) the ratio reaches unity when θI = 37° and if (α, β) = (20°, 30°) it reaches unity when θI = 96°. Examples of the variation of the volume ratio near critical slopes are shown later in table 1. The changes in volume may be due in part to variations in the shape of groups on reflection, considered in the next section.
The ratios of group dimensions on reflection take no account of the changes to the amplitude or slope of waves within a reflecting group that may, according to the criteria used to determine the boundaries of a group, result in a variation of its extent.
2.2. Group shape
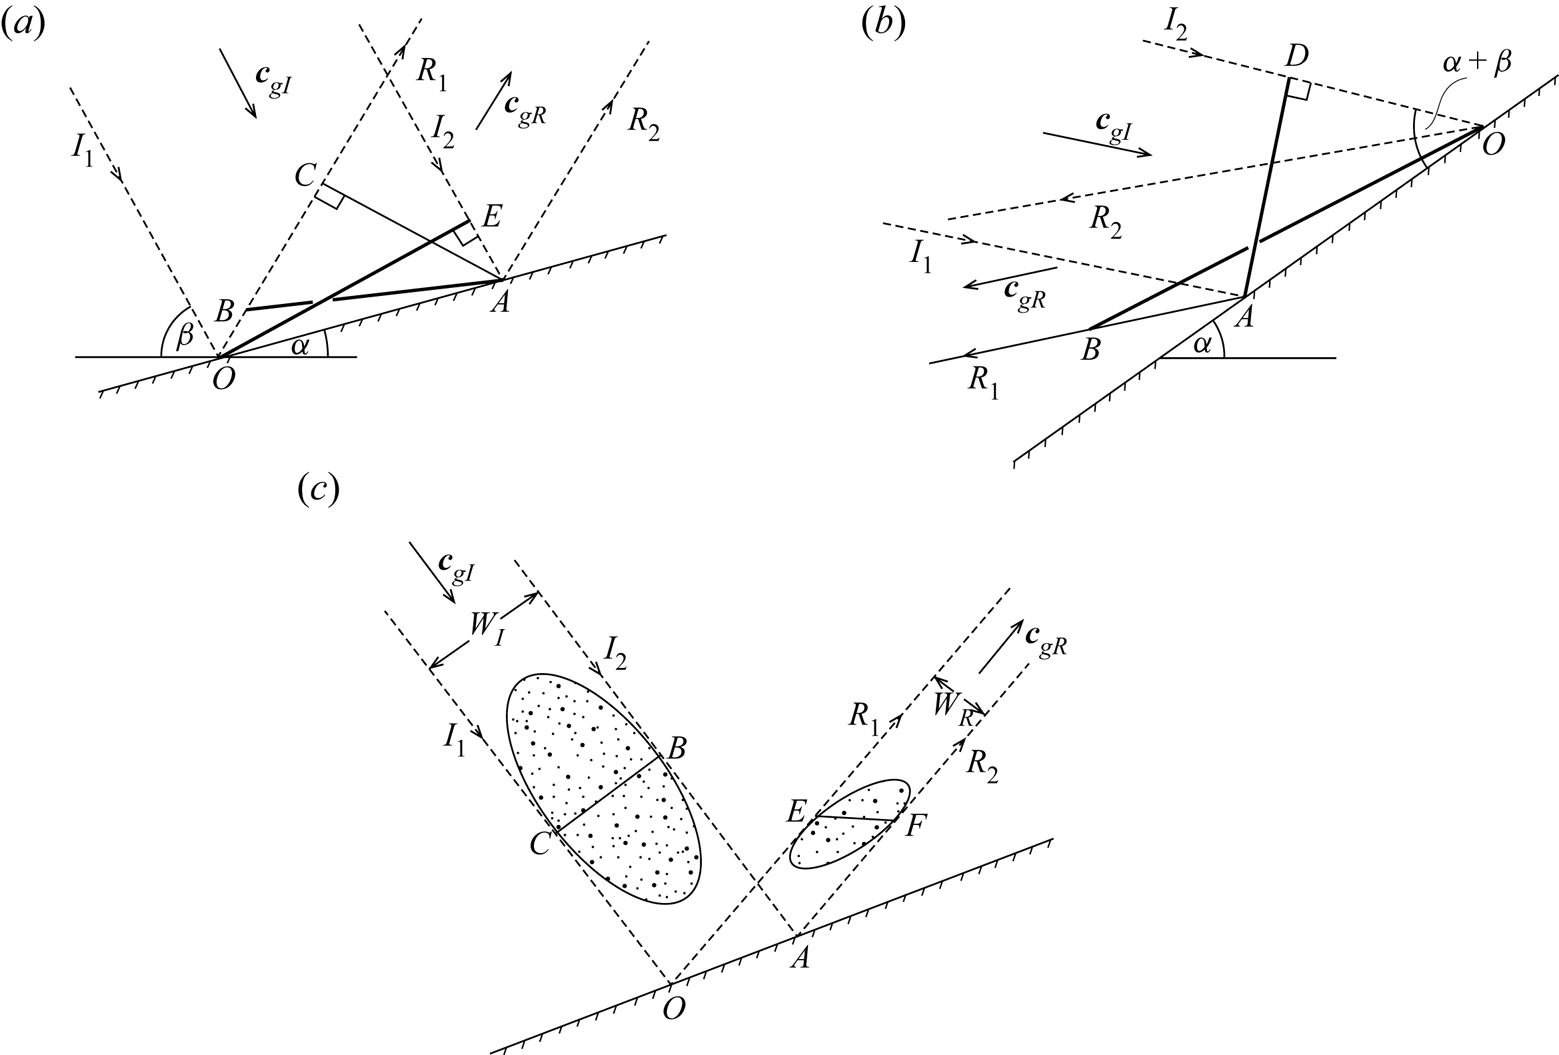
Insight into the properties of the reflected groups may be provided by choosing particular forms for the incident groups. For example, the reflection of a subcritical group with α < β, relatively large breadth, and azimuth θI = 0°, is described in appendix D and shown in figure 7(a). The incident group is selected to have a plane front normal to the direction of propagation. The plane front of the incident group is OE, normal to cgI. Unless α + β = 45°, the front of the reflected group is skewed, no longer normal to the propagation direction. The angle CAB between the reflected front, along AB, and one normal to the propagation direction, the line AC, is equal to  ${\tan ^{ - 1}}[(1 - {t_{(\alpha + \beta )}})/{t_{(\alpha + \beta )}}{t_{(\beta - \alpha )}}]$ and this may be large. E.g. if α = 6° and β = 15°, angle CAB = 84.4°. A case when α > β is illustrated in figure 7(b). The front of the incident group is AD normal to I 1 and I 2. The front of the reflected group is OB, twisted from the direction normal to R 1 and R 2.
(a,b) The reflection of wave groups with α + β < 90° and with fronts, OE in (a; α < β) and AD in (b; α > β), that are planar and normal to the group boundaries, I 1 and I 2, respectively The wave azimuth is θI = 0°. The reflected groups have fronts along (a) AB and (b) OB. All fronts are shown by bold lines. In (c) the incident wave group (stippled) has an elliptical shape with maximum width CB. It propagates between I 1 and I 2 at direction β > α, to the horizontal with θI = 0°. The reflected group propagates between R 1 and R 2. E and F in the reflected group correspond to C and B, respectively.

The reflection of an elliptically shaped subcritical group is sketched in figure 7(c). One axis, CB, extends across the group width from I 1 to I 2. Its distortion on reflection can be described as for the incident group in figure 7(a): if the incident and reflected groups are each assumed to remain unchanged as they approach or recede from the boundary, the line across the width of the reflected group, EF, corresponding to CB in the incident group, is skewed as is the front AB in figure 7(a), leading to a twisting of the incident elliptical group shape.
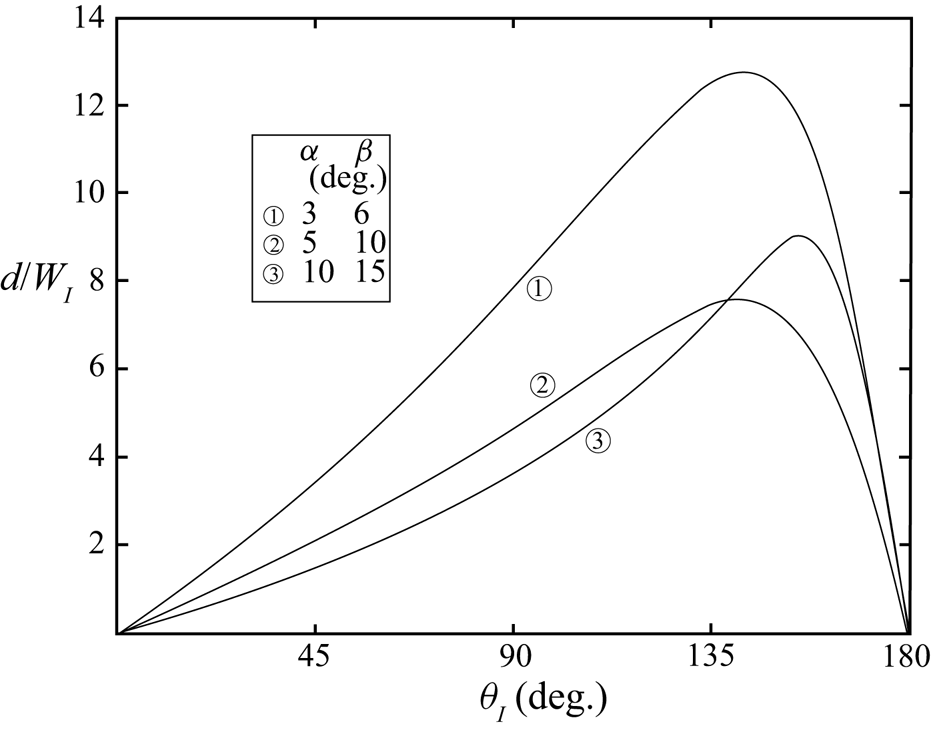
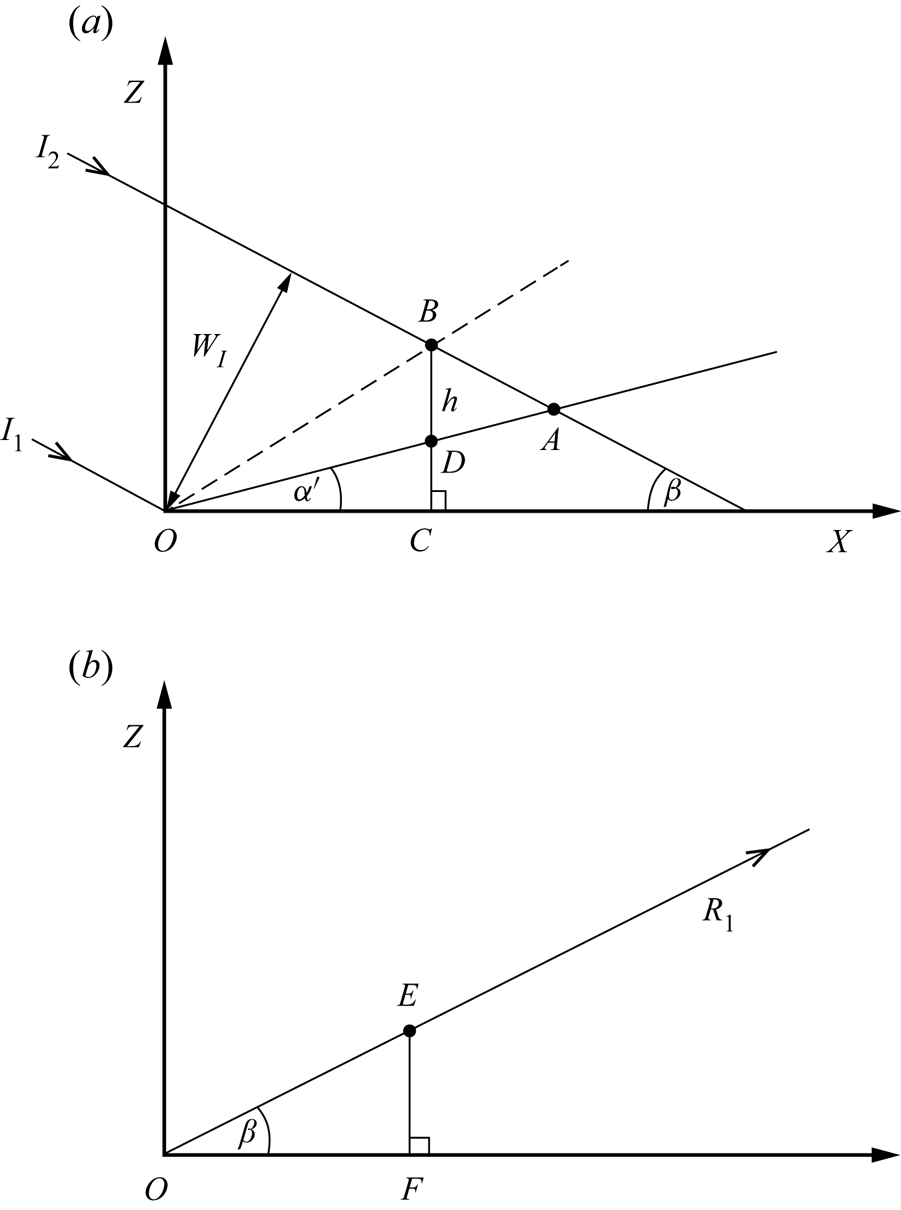
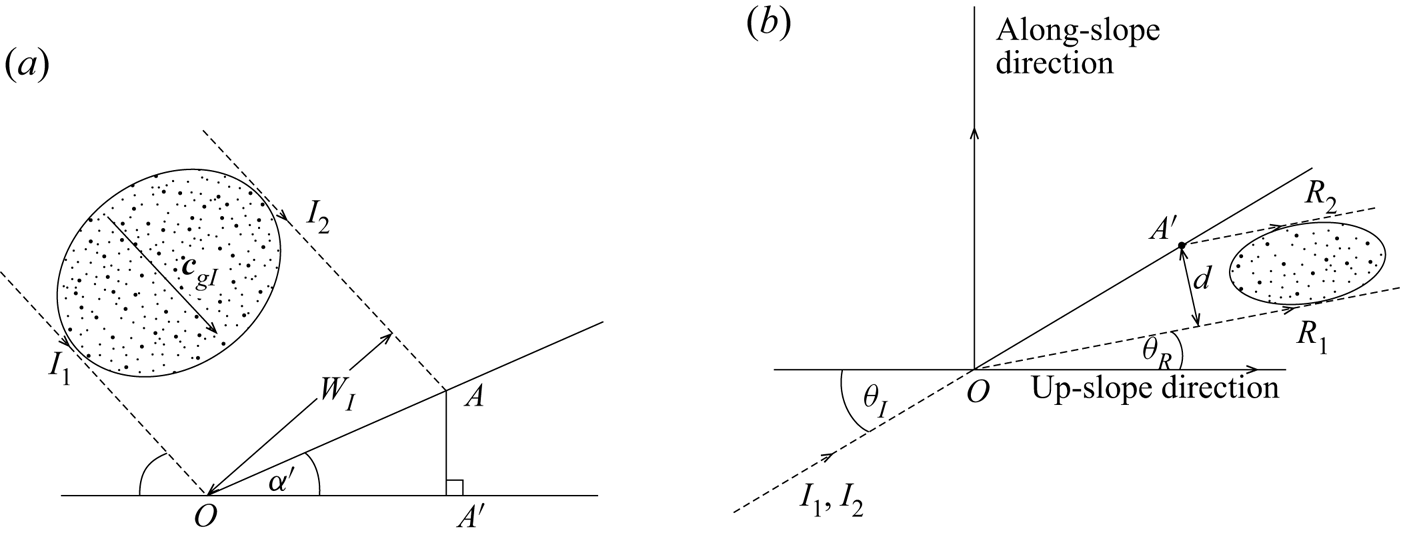
The propagation direction of a group is given by β and azimuthal angle, θ. The latter changes on reflection (§ 1.3.3). As shown in appendix E the waves in the lower part of an incident group reach the sloping boundary at a time different from the upper, an earlier time if α/ + β < 90°. Generally therefore the group is twisted on reflection from the finite length of the slope. The lower waves of the incident group shown in figure 19(a) are displaced, after reflection, by a horizontal distance, d, given by (A5a) and shown in figure 19(b), from the waves in the upper part of the reflected group. The plane of the reflected waves is no longer vertical as is that of the incident waves in figure 1, but is tilted through an angle proportional to d/WI. Although moderate at small azimuthal angle, θI, and as θI approaches 180°, it is shown in figure 8 that d/WI may exceed 3, with relatively severe twisting of the reflected group, when θI is in a range greater than about 80°.

3. The layer of interacting incident and reflected wave groups on a slope
3.1. The height, h, and area, A, of wave group interaction regions
The extent and effectiveness of the interactions between incident and reflected waves described in § 1.3.7, or the energy transferred from the waves to their interaction products, will depend on how far from the slope the incident and reflected wave groups co-exist. Figure 9(a) shows the vertical plane at azimuth angle, θI, in which an incident wave group of width, WI, is travelling between the lines I 1 and I 2 with an inclination, β, to the horizontal that exceeds α. The upper edge of the group is labelled I 2 and the lower edge, I 1, as in figure 1. The sloping boundary lies along the line ODA at angle α/ to the horizontal X axis. The group encounters and reflects from the slope between points O and A. The reflected group propagates at azimuthal angle, θR, in the vertical plane shown in figure 9(b). The waves in the incident wave group that are reflected from the point O travel along line OE, labelled R 1. The projection of OE from the azimuthal direction θR onto direction θI in figure 9(a), is OB. This gives the location of the reflected waves travelling along R 1. The position of the point B indicates the maximum extent of the region above the slope within which the incident and reflected waves may co-exist and interact; the length of the vertical line, BD = h, say, is the greatest vertical distance from the slope of the region where both incident and reflected wave groups may be present and may interact. At normal incidence when θI = θR = 0°, the line OB is that of the reflected waves in the group which originate along I 1 in the incident group. Figure 9(b) takes account of the difference between θR and θI (e.g. as shown in figure 2). Using simple geometry it can be shown that
 \begin{equation}h/{W_I} = 2[{s_\beta }{c_{({\theta _I}\text{--}{\theta _R})}} - {c_\beta }{c_{{\theta _I}}}{t_\alpha }]/\{ {s_{2\beta }}[1 + {c_{({\theta _I}\text{--}{\theta _R})}}]\} ,\end{equation}
when α < β or
 \begin{equation}h/{W_I} = 2[{s_\beta }{c_{({\theta _I}\text{--}{\theta _R})}} + {c_\beta }{c_{{\theta _I}}}{t_\alpha }]/\{ {s_{2\beta }}[1 - \textrm{ }{c_{({\theta _I}\text{--}{\theta _R})}}]\} ,\end{equation}
if α > β.
(a) The vertical (X, Z) plane at azimuthal angle, θI, in which an incident wave group of width, WI, is travelling downwards from the left with inclination, β, to the horizontal. The upper edge of the waves in the group is labelled I 2 and the lower edge, I 1, as in earlier figures. (b) The vertical plane of the reflected group with azimuthal angle, θR.

The area in which the incident and reflected waves of the group coincide in the vertical plane at angle θI (the area of the interaction triangle OBA in figure 9a) is given by A where
 \begin{equation}A/W_I^2 = (h/{W_I}){c_{{\alpha ^/}}}/[2{s_{(\beta + {\alpha ^/})}}].\end{equation}
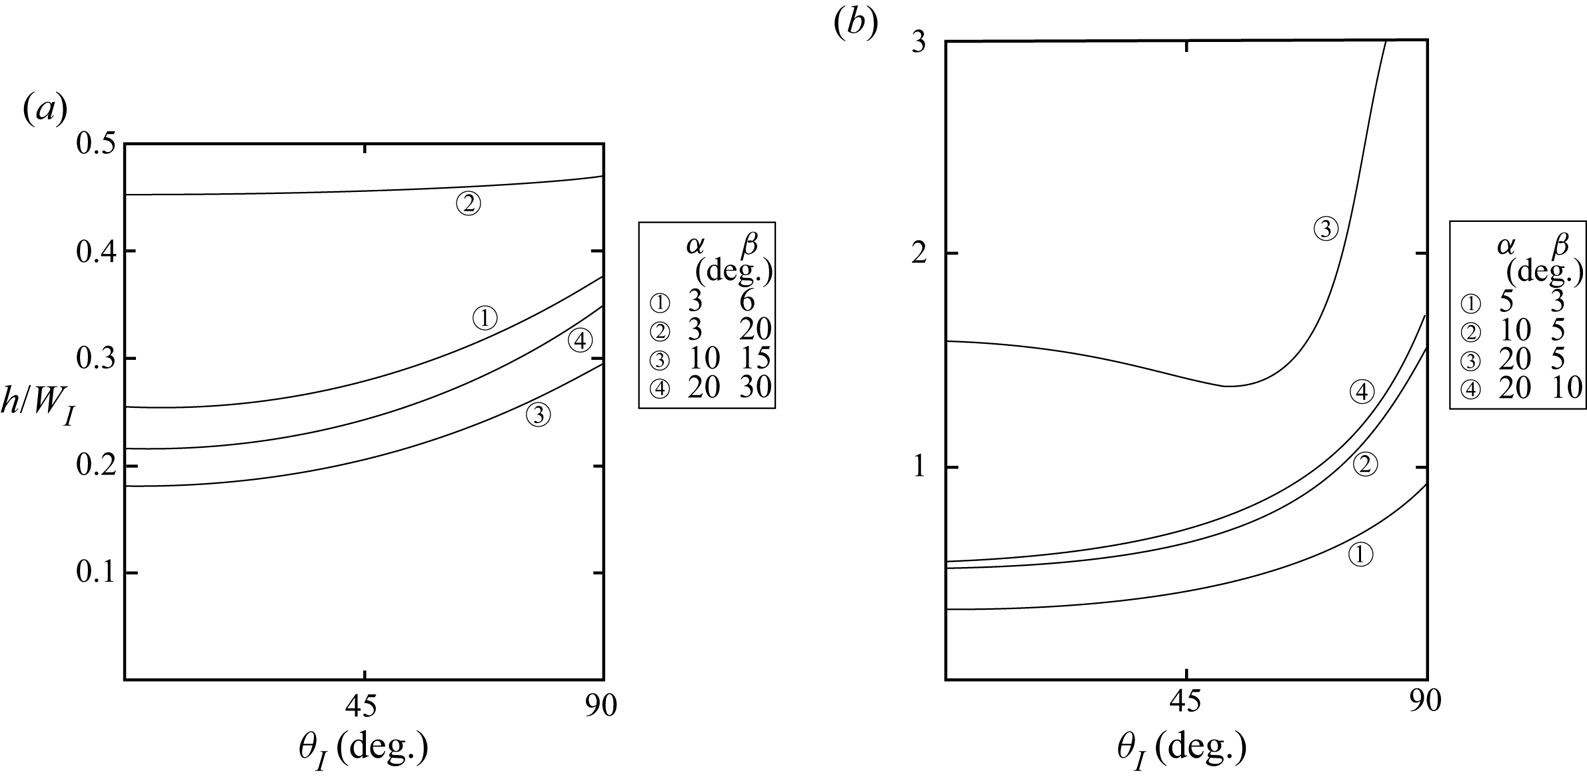
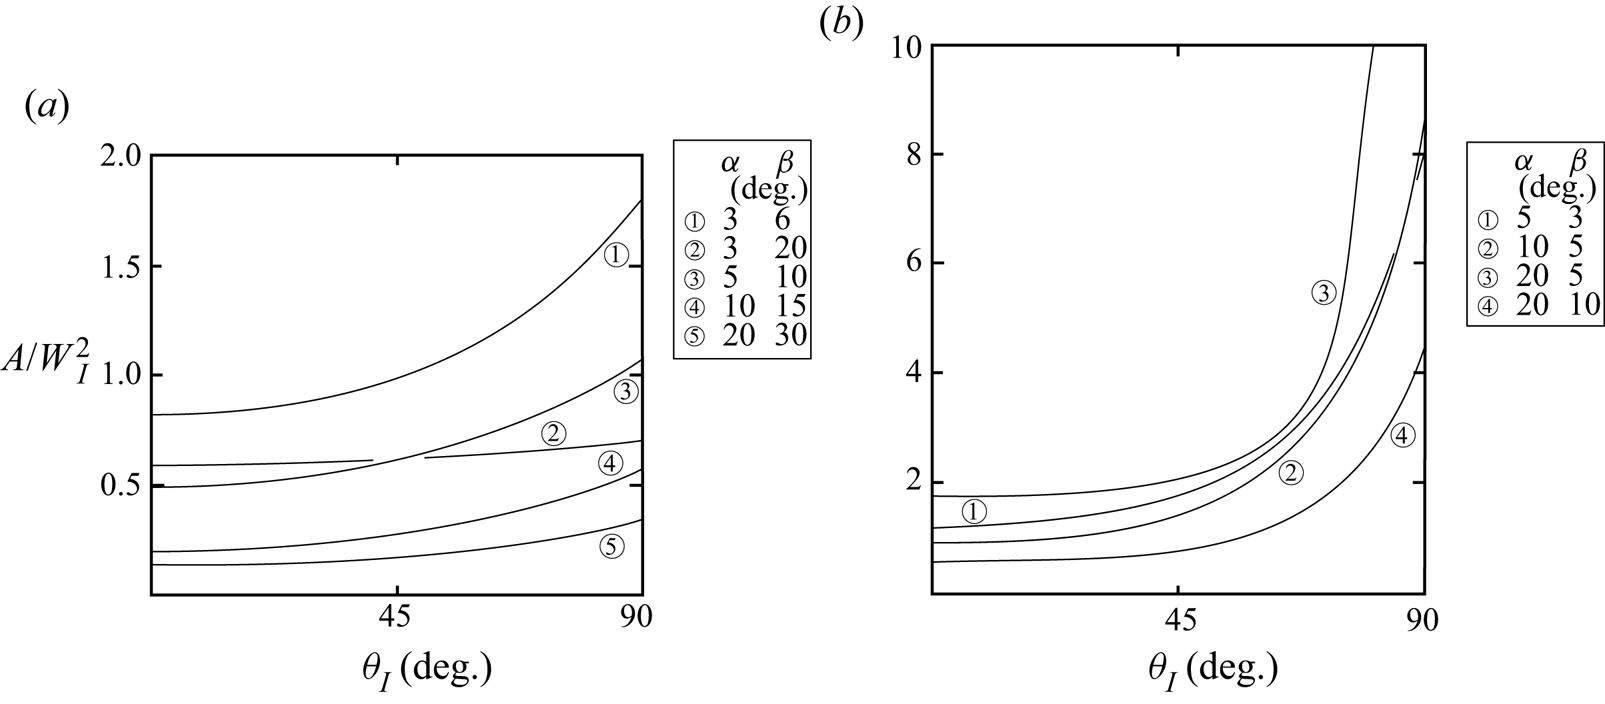
Figures 10 and 11 show values of h/WI and  $A/W_I^2$, respectively, as functions of the azimuthal angle of the incident wave, θI, at various α and β. Values increase with θI but are relatively insensitive to an increase of θI when θI is less than 30°.
The non-dimensionalized height, h/WI, of the interaction region of incident and reflected groups, as a function of θI at specified slope and wave propagation angles, α and β: (a) α < β and (b) α > β.

The non-dimensionalized area,  $A/W_I^2$, of the interaction region of incident and reflected groups as a function of θI at specified slope and wave propagation angles, α and β: (a) α < β and (b) α > β.

Wave interactions within the area A are examined by Leclair et al. (Reference Leclair, Raja and Staquet2020) for an incident beam of two-dimensional plane waves of finite width, but only with θI = 0° and α < β. They calculate the transfer of energy to a second harmonic wave of frequency 2σ within the area A and take account of its radiation, showing that the effects of viscosity will eventually dominate over those of nonlinear transfer as the slope angle, α, increases.
3.2. Spatial and temporal limits on h
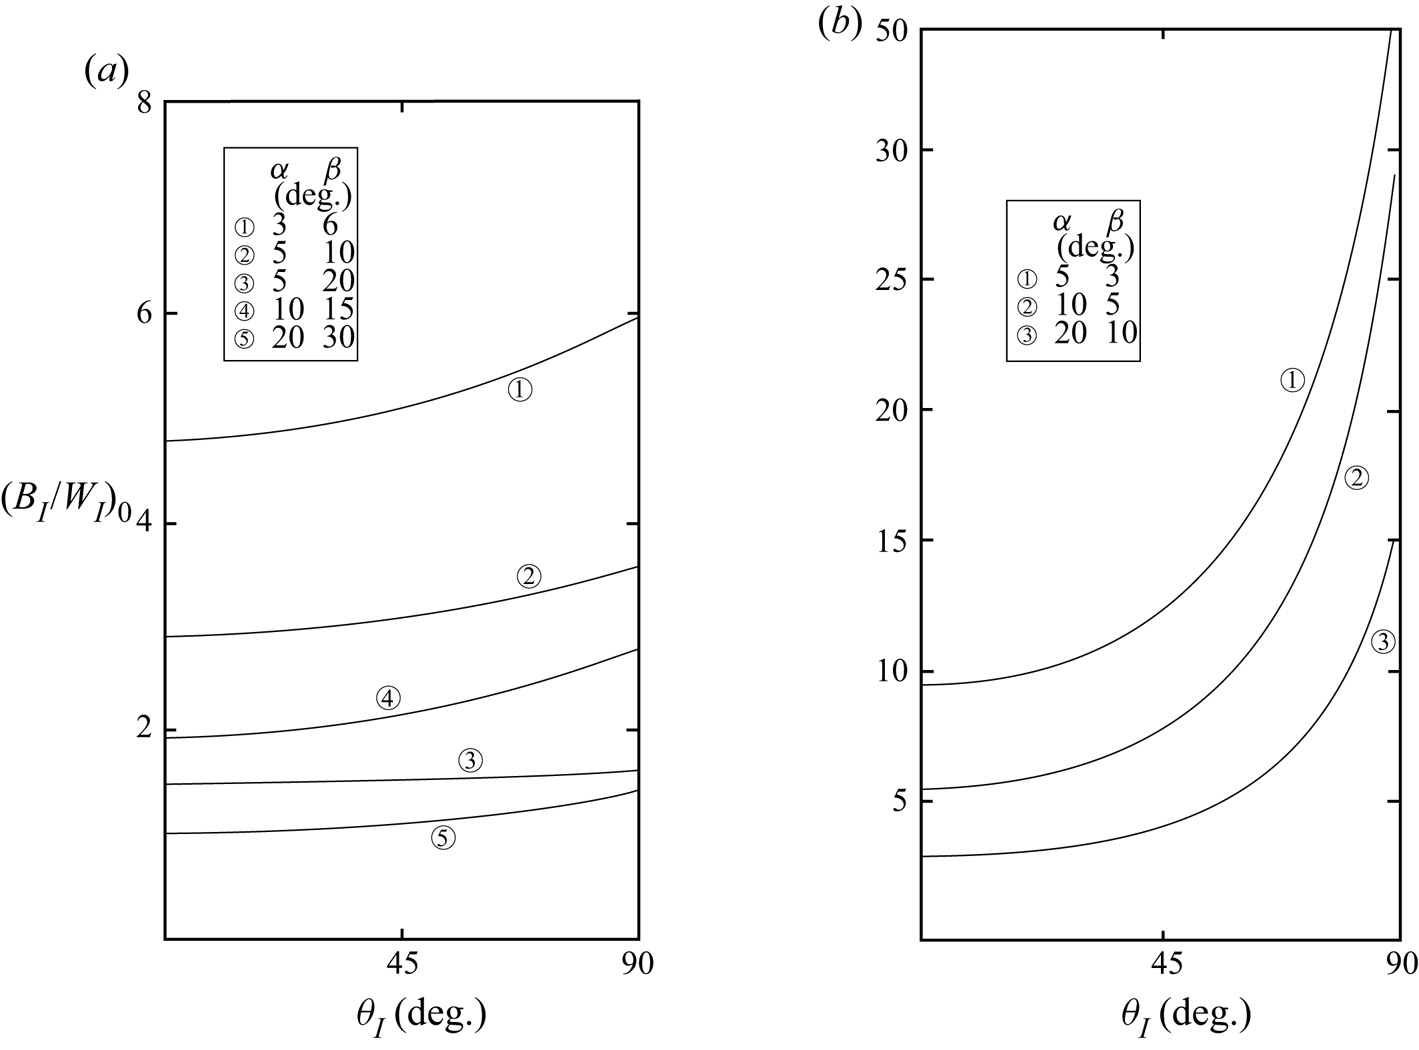
Whether interaction can actually occur over the full depth, h, given by (3.1), or over the area A of (3.2), depends on further conditions. The first is spatial: because the wave azimuth changes on reflection, it is necessary that the reflected wave group is broad enough at location E in figure 9 to extend from section θR (figure 9b) to θI (figure 9a); the breadth of the wave group, BR, must be sufficiently large. This is so when
 \begin{equation}{B_I}/{W_I} \gt {({B_I}/{W_I})_0},\end{equation}
where
 \begin{equation}{({B_I}/{W_I})_0} = 1/[{s_\beta }(1 + {c_{({\theta _I}\text{--}{\theta _R})}})],\end{equation}
if α < β, or
 \begin{equation}{({B_I}/{W_I})_0} = 1/[{s_\beta }(1 - {c_{({\theta _I}\text{--}{\theta _R})}})],\end{equation}
if α > β, where  ${c_{({\theta _I}\text{--}{\theta _R})}} = \cos ({\theta _I} - {\theta _R})$. (BI/WI)0 is shown in figure 12 as a function of the direction θI, for several values of β and α. When BI/WI < (BI/WI)0, the height of the region of possible interaction between the incident and reflected waves is reduced to h(BI/WI)/(BI/WI)0; the height, h, given by (3.1) is therefore an upper bound for the extent of the possible interaction region adjoining the slope.
The lower bound of the wave group dimensional ratio, (BI/WI)0, satisfying the spatial condition that the incident and reflected groups co-exist to height h from the slope, as a function of the incident wave direction θI, (a) α < β and (b) α > β.

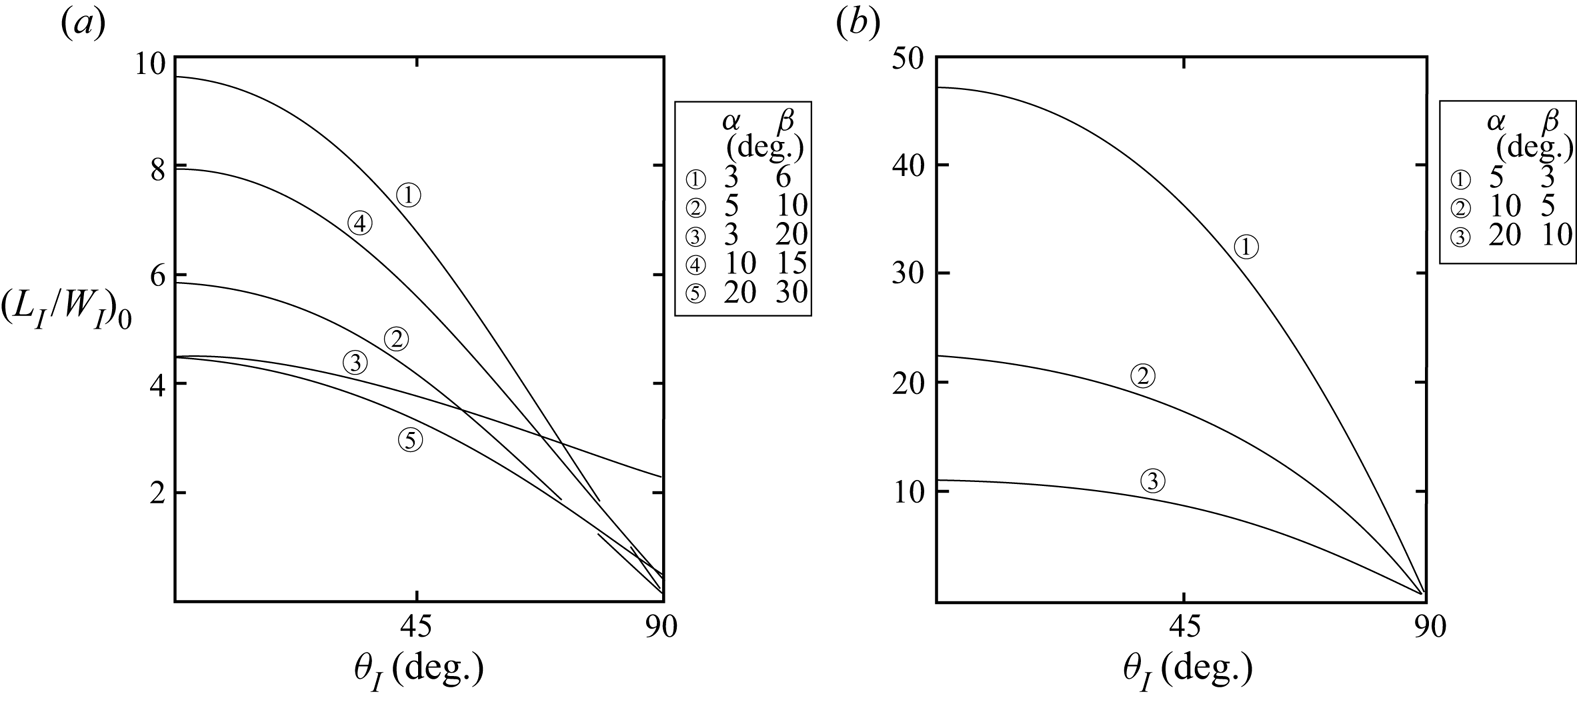
A second condition for interaction to be possible to height h is temporal: the incident and reflected wave groups are both present at the same time at height, h, only if the front of a reflected wave group has propagated upwards to height, h, in a time before the rear of the incident wave group reaches the height, h. Only then can interaction be possible over the full height, h. This condition depends on the length of the incident wave group, LI, and can be written
 \begin{equation}{L_I}/{W_I} \gt {({L_I}/{W_I})_0},\end{equation}
where the minimum value of LI/WI is
 \begin{equation}{({L_I}/{W_I})_0} = 2{c_{({\theta _I}\text{--}{\theta _R})}}[({\boldsymbol{c}_{gI}}/{\boldsymbol{c}_{gR}}) + 1]/\{ {s_{2\beta }}[1 + {c_{({\theta _I}\text{--}{\theta _R})}}]\} \text{--}{({t_\beta })^{ - 1}},\end{equation}
when α < β, or
 \begin{equation}{({L_I}/{W_I})_0} = 2{c_{({\theta _I}\text{--}{\theta _R})}}[1 - \textrm{(}{\boldsymbol{c}_{gI}}/{\boldsymbol{c}_{gR}}\textrm{)}]/\{ {s_{2\beta }}[1 - {c_{({\theta _I}\text{--}{\theta _R})}}]\} + {({t_\beta })^{ - 1}},\end{equation}
when α > β. (A version of (3.6a) is given by Thorpe (Reference Thorpe2001), but only when θI = 0° and even then incorrectly.) Examples of the variation of (LI/WI)0 with θI are shown in figure 13. As in the spatial condition (3.3), the height of the region of possible interaction between the incident and reflected waves is reduced to h(LI/WI)/(LI/WI)0 when LI/WI < (LI/WI)0.
The lower bound of the wave group dimensional ratio, (LI/WI)0, satisfying the temporal condition that the incident and reflected groups are present at the same time at a position at a height h from the slope as a function of the incident wave direction θI, for specified slope angles, α, and group velocity directions, β: (a) α < β and (b) α > β.

A further temporal condition is necessary for interactions to lead to a significant effect on mixing: the duration of interaction between the incident and reflected waves must exceed the time required for growth of the instabilities produced by the wave interactions to reach finite amplitude. This time is proportional to the inverse growth rate of instabilities described in § 1.3.7, a time commonly proportional to N −1 but which depends on their nature. This condition implies that even greater values of  ${({L_I}/{W_I})_0}$ than given by (3.5) will be required for interactions to lead to substantial mixing to height h.
As can be seen from figures 12 and 13, values of the limits, (BI/WI)0 and (LI/WI)0, are relatively large at some θI. These are lower bounds of the group dimension ratios BI/WI and LI/WI, and extreme values larger than those given by (3.3) and (3.5) are required for turbulent mixing caused by wave--wave interaction to occur. Although large values of BI/WI and LI/WI coincide with those at which wave groups have their greatest duration (§ 1.2.3), the latter (large LI/WI) being characteristic of wave rays or beams, it is likely that the requirement for extreme values of the ratios will not be satisfied in general. Mechanisms that generate groups with specific, large or small, dimension ratios are yet to be classified. Consequently, rather than being driven by wave interactions, in some regions close to a sloping boundary mixing is more commonly driven through an alternative mechanism. This may be through turbulence induced by mean flow Ekman layers (§ 1.1) or by the breaking of waves in incident or reflected wave groups through convective instability or K–H instability. Mixing through wave breaking is most likely after waves have steepened on reflection (see (1.10)) or when the minimum Richardson number is substantially reduced after wave reflection. Such near-boundary breaking in wave groups is considered in the following section.
4. Continuous and continual wave breaking in wave groups near a sloping boundary
We now consider the nature of mixing imposed by the breaking of incident or reflected wave groups near a sloping boundary, following the brief discussion of the continuity and intermittency of breaking in appendix B.
4.1. Continuous breaking and mixing
A patch of continuous mixing within a boundary layer parallel to a sloping boundary is promoted by an internal wave group if the direction of a breaking wave in the group, γ, is equal to that of the effective slope, α/, i.e. from (1.4) and (1.7), when
 \begin{equation}{t_\beta } = {F^2}/{t_\alpha }{c_\theta }.\end{equation}
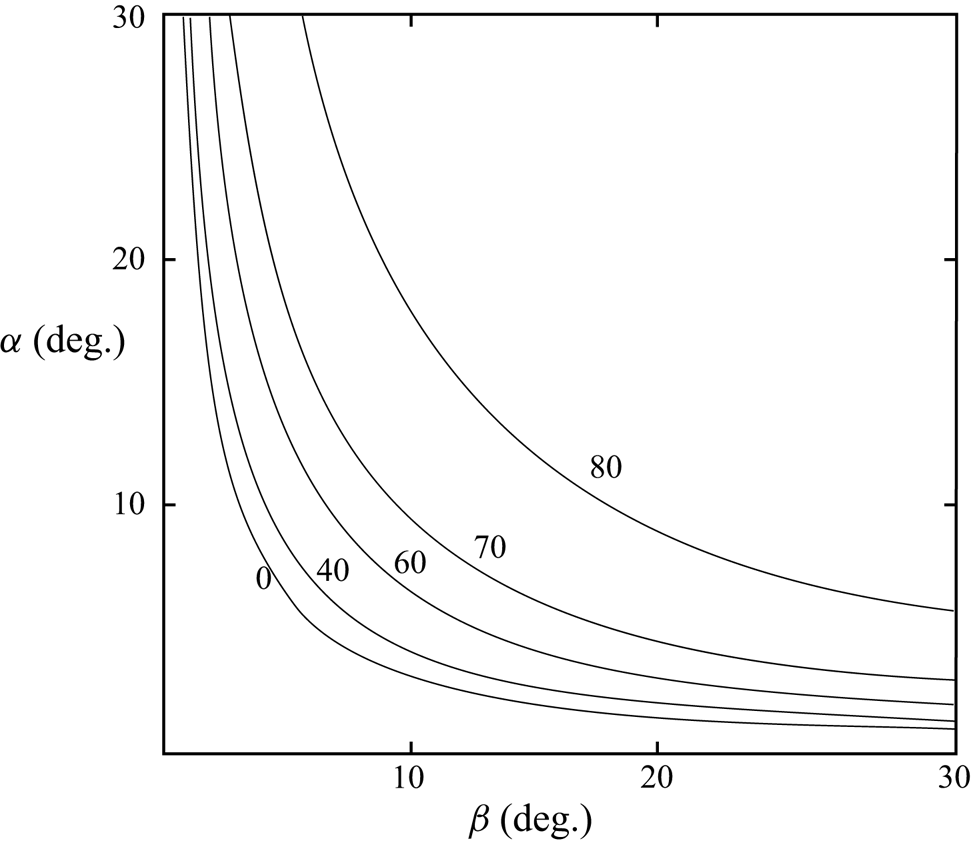
This relationship is shown in figure 14 for a typical value F = 0.1 at various values of θI specified on the curves. There are no solutions of (4.1) when α or β is small, or when  ${t_\alpha }{t_\beta } \lt {F^2}$, below the curve θ = 0° in figure 14. The frequency, σb, of waves that satisfy (4.1) is given by (1.1)
 \begin{equation}{({\sigma _b}/f)^2} = [{F^2} + {({t_\alpha }{c_\theta })^2}]/[{F^4} + {({t_\alpha }{c_\theta })^2}].\end{equation}
Labelled contours of constant azimuth angle (θ measured in degrees) where continuous mixing occurs in the (α, β) plane from (4.1) when F ( = f/N) = 0.1.

Condition (4.1), whilst necessary, is not sufficient. It must be geometrically possible that cb lies along the effective slope. Taking for example the wave reflection of an incident wave at zero azimuth, θI = 0°, as shown in figure 3, (a(i)) and (b(i)), the sloping boundary plane lies in quadrants 1 and 3 (where X and Z are both positive or both negative). Although being of different magnitude, the phase vector, c (1.2a), and the breaking wave vector, cb (1.3b), lie in the same quadrants because their components have the same signs. The incident phase velocity, cI, has both K and M > 0 (figure 3, parts (i)) lying in the first quadrant and therefore so too does cbI, which may consequently be parallel to the slope. The reflected wave phase velocities, cR, have K > 0 and M < 0 when α < β, or K < 0 and M > 0 when α > β, as in figure 3(a(i),b(i)), respectively, and so lie in the fourth and second quadrants, respectively. Neither are in the same quadrants as the sloping boundary and cbR cannot be parallel to the boundary, even when (4.1) is satisfied.
4.2. Successive breaking
If the velocity, cg, of a group in which a wave is breaking is parallel to the effective slope, successive waves will break in a direction along the slope at time intervals approximately equal to the wave period, T, and separated by distances of Tcg. A line of mixed patches will then be formed (e.g. as illustrated by Thorpe Reference Thorpe1999b; his figure 4). The condition that cg is parallel to the effective slope is
 \begin{equation}{t_\beta } = {t_\alpha }{c_\theta }.\end{equation}
At θ = 0° this gives α = β, and the wave frequency is equal to the critical frequency, σc. This is not so if θ ≠ 0°. After reflection, can the group velocity, cgR, for waves travelling in direction θR be parallel to the effective slope in this direction? Substituting  ${\theta _R} = {\cos ^{ - 1}}({t_\beta }/{t_\alpha })$ from (4.3) into (1.6) gives
 ${\theta _I} = {\cos ^{ - 1}}( - {t_\beta }/{t_\alpha }) = {\theta _{Ic}}$; thus waves with incident azimuth angle
 ${\cos ^{ - 1}}( - {t_\beta }/{t_\alpha })$ will reflect at angle
 ${\theta _R} = {\cos ^{ - 1}}({t_\beta }/{t_\alpha })$ parallel to the effective slope defined in § 1.3.5. This implies that the corresponding incident waves must travel tangentially to the effective slope. Unless the slope happens to be convex (when effects not considered here may occur, as they are by Gilbert & Garrett Reference Gilbert and Garrett1989; Legg & Adcroft Reference Legg and Adcroft2003) it is difficult to see how such waves travelling tangentially to a sloping boundary may be generated and occur naturally.
4.3. When does wave breaking adjacent to a slope have its greatest effect?
The breaking of incident or reflected wave groups will have a more substantial and extensive effect in mixing the internal surf zone when the waves that are breaking remain within the surf zone, i.e. when the group velocity vectors, cgI or cgR, are in directions that remain within the boundary layer or nearly parallel to the effective slope at which waves meet the boundary. Mixing initiated by waves breaking within the internal surf zone will continue to be generated within the zone if the direction, γ, of cb lies between the lines OA (representing the effective slope) and OB (the upper limit of the reflecting wave group) in figure 9(a). This leads to the conditions  ${t_{{\alpha ^/}}} \le {t_\gamma } \le \tan (\textrm{angle}\;\textrm{BOC})$ or
 \begin{equation}{t_\alpha }{c_{{\theta _I}}} \le {F^2}/{t_\beta } \le {t_\beta }{c_{({\theta _I}\text{--}{\theta _R})}},\end{equation}
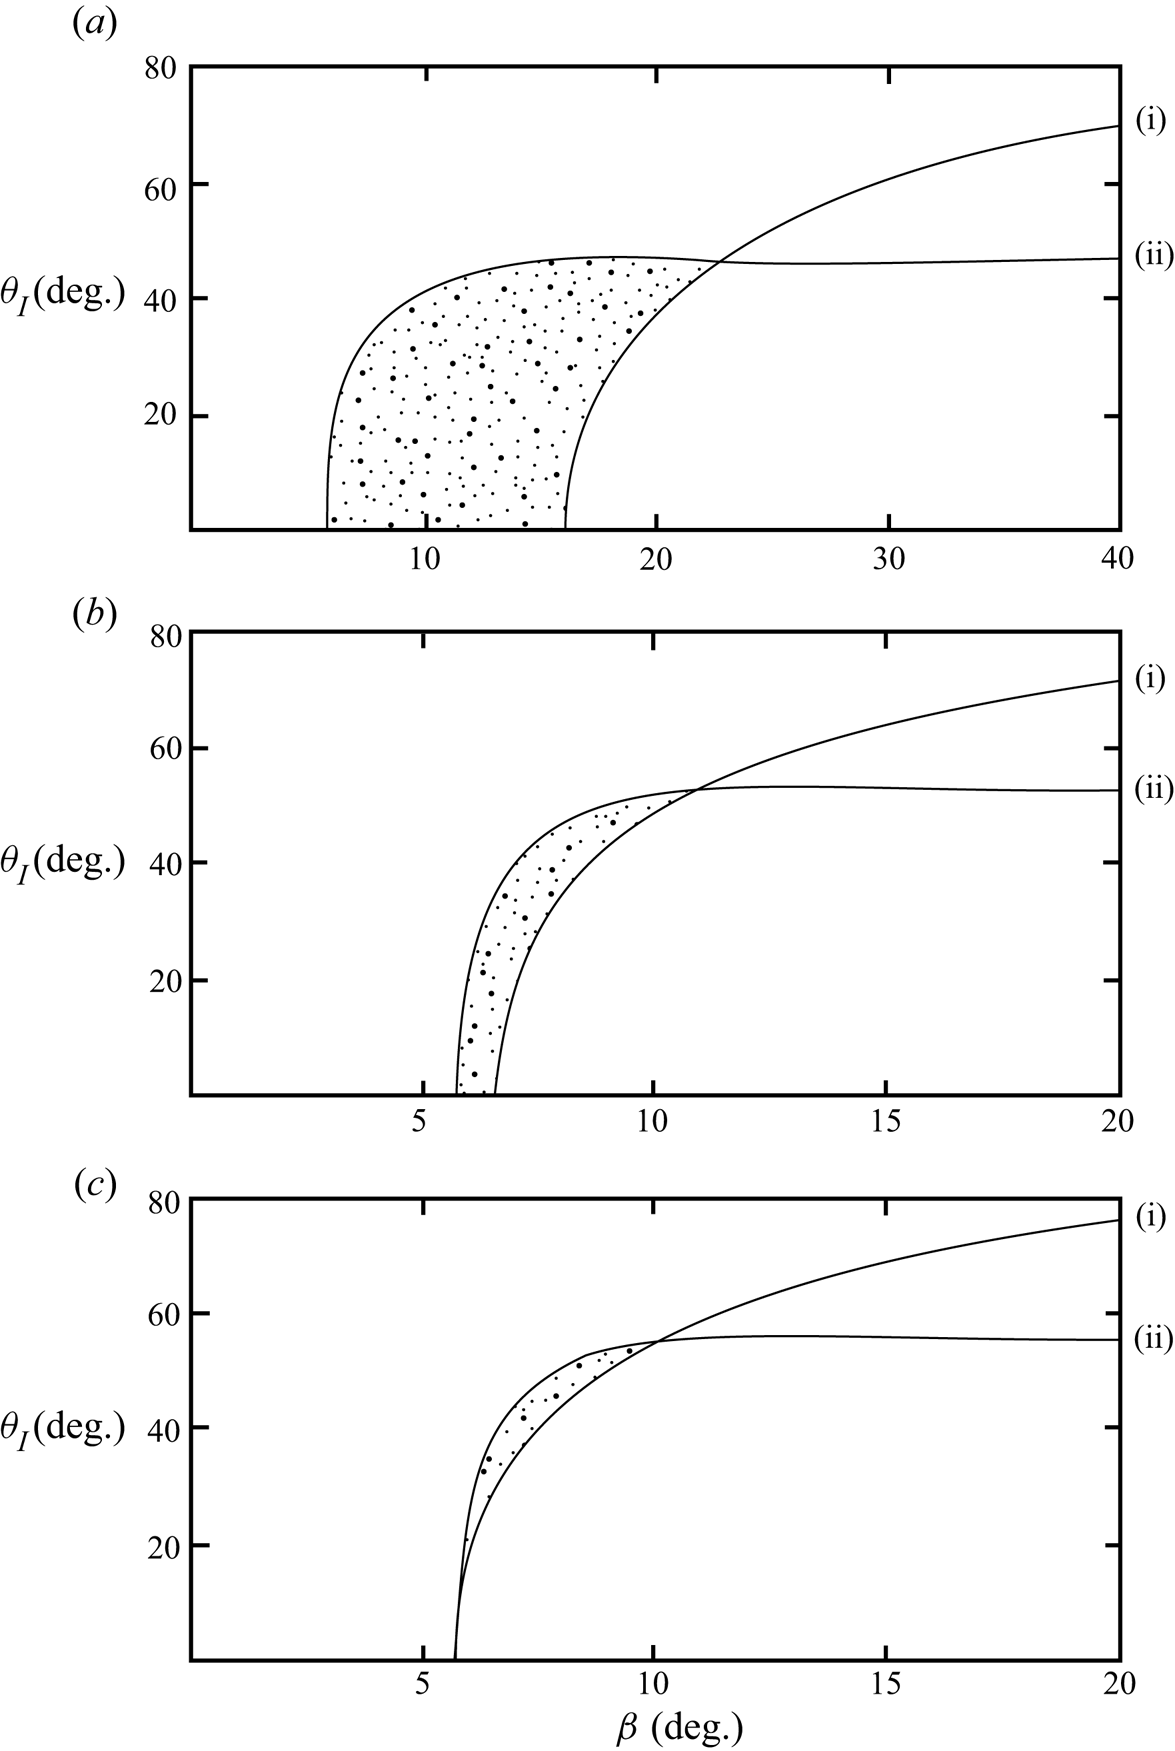
when the breaking of incident or reflected waves remains in and repeatedly produces mixing in the internal surf zone. Figure 15 shows the lower (i) and upper (ii) bounds on F 2/tβ in (4.4) at various α for a typical value, F = 0.1. At zero azimuth the upper limit of (4.4) implies that β ≥ tan−1F = 5.71°. Points in the stippled area of the figure satisfy both the conditions of (4.4). For the selected value of F, there appear to be no values of β that satisfy (4.4) when α > 6°. Using the relation (1.6) between θI and θR it may be shown that, in general, there are no solutions of (4.4) when β < tan−1F. When α < β (subcritical waves) solutions are found in a limited range of θI < 90° and in a narrow range of β (consistent with figure 15). When α > β (supercritical waves) solutions are found only in a limited range of θI below and adjoining 90°.
The upper (labelled (i)) and lower (labelled (ii)) bounds of F 2/tβ given by (4.4) when F = 0.1. Shown is the variation of θI with β for various slope angles, α, when (a) α = 2°; (b) α = 5° and (c) α = 5.71°. The curves are at points in the stippled areas that satisfy condition (4.4) for the breaking of waves in wave groups to be sustained near the slope.

5. Summary and discussion
5.1. Analytical results
The most stable and therefore persistent wave groups in mid-water are those with large LI/WI and BI/WI (§ 1.2.3). Some of these will eventually reach the sloping boundaries of the ocean and be reflected. There they will modify the internal surf-zone.
Several consequences of the interaction of wave groups with a sloping boundary have been considered. On reflection, changes occur to the dimensions and volume of groups. In § 2.1 these changes are shown to depend on the azimuthal directions, θI, of the incident wave groups, as well as on α and β: the relative lengths and widths of the incident and reflected groups, LI/LR and WI/WR, both decrease with increasing θI, at least when θI < 90°. The ratio of volumes of the incident and reflected groups is given by LIWIBI/LRWRBR. At θI = 0°, the ratio is greater than unity; the volume of an incident wave group exceeds that of its reflection. The relative volume of reflected groups decreases as θI increases. At a sufficiently large θI, depending on α and β, the volume of an incident group becomes equal to that of its reflection and, at even larger θI, its volume will increase on reflection. There are also structural changes. Examples in appendix D with θI = 0° show that the shape of the front (or rear) of groups can be changed on reflection. When θI ≠ 0°, changes in the orientation of the groups’ boundaries cause groups to become twisted on reflection.
Interactions, including resonant interactions, may occur between the waves in groups that are incident on a slope and those in their reflected groups. The types of possible interactions are summarized in § 1.3.7. For such interactions and subsequent turbulent mixing to be possible there must be a region within which the incident and reflected wave groups co-exist. In § 3 it is shown that there is a region of maximum height, h, and area, A, above a plane slope within which such co-existence is possible. The size of h is subject to conditions on the dimensions of the incident group. A spatial condition demands that the incident and reflected groups must co-exist in space to the distance, h, above the slope. This is satisfied only when BI/WI is sufficiently large, i.e. only if BI/WI exceeds the value (BI/WI)0, given by (3.4). Otherwise the thickness of the interaction region, h, is fractionally reduced to h(BI/WI)/(BI/WI)0. A temporal condition requires that the incident and reflected wave groups must also co-exist in time over the full height, h. This is satisfied only if the ratio LI/WI of an incident group's dimensions exceeds a value, (LI/WI)0, given by (3.6). The height of the interaction region is otherwise reduced to h(LI/WI)/(LI/WI)0. The height, h, given by (3.1) is therefore an upper bound for the extent of the possible wave interaction region adjoining the slope. As shown in figure 13 (LI/WI)0 may be relatively large, especially when α > β. A further limit is, however, required if there is to be a significant contribution of wave interaction to mixing: the duration of interaction between the incident and reflected waves must exceed the time required for growth to finite amplitude of the instabilities produced by wave interactions; larger values of LI/WI than (LI/WI)0 are required if interactions to height h are to lead to turbulence. The time required for an instability to lead to mixing may, however, be reduced if earlier breaking leaves a substantial disturbance on which instability can grow; the intermittency of wave groups may be an important factor.
The spatial and temporal conditions on the size of the region in which interactions may occur coincide with those of the longest lived and therefore most stable wave groups (§ 1.2.3). Given their severity, however, the conditions appear to be unlikely to be satisfied on all oceanic slopes, and their turbulent boundary layers may be sustained by the breaking of waves in incident or reflected wave groups through convective instability or K–H instability rather than through resonant interactions.
Table 1 shows examples of how values of the parameters defining the changes in the dimensions of a group vary when its component waves are near critical. Examples are selected at α = 3° and 20°, typical of the continental slopes and of seamounts, for incident wave azimuths of 0° and 45°. The table shows how, in the chosen example, θI = 45°, the azimuthal direction of reflected waves, θR, is rotated towards the up- or down-slope direction in near-critical conditions. The group characteristics, LI/LR, when θI = 0° and 45° and WI/WR, when θI = 0°, approach maximum values as β tends to the critical direction of the component waves in the incident group. The ratio, LIWIBI/LRWRBR, of the volume of the incident and reflected groups also increases as β tends to α from above or below. Far greater changes in group volume occur near critical conditions at θI = 0° than at θI = 45°. Maxima near critical frequencies are not apparent in WI/WR when θI = 45°, or in BI/BR; evidently the group properties may differ from those of the component waves.
The breaking of incident or reflected wave groups will have a more extensive effect within the internal surf zone when the waves that are breaking there remain near the slopes, leading to repeated mixing within the internal surf zone. Conditions in which this occurs are summarized by (4.4) and marked by the stippled areas of figure 15. The wave groups must travel in directions β > α, with β in a moderate range of values that exceed tan−1F, but with a broad azimuth angle, θI. These conditions are satisfied only at small α, typical of the continental slopes, and at moderate β.
5.2. Observations
Except for the definitive observations of K–H billows by van Haren & Gostiaux (Reference van Haren and Gostiaux2010) at 10–20 m above the sloping side of the Great Meteor Seamount in the Canary Basin, the available measurements in the boundary layer over a slope are generally insufficient to establish whether, when or where, the mixing is generated as a result of resonant interactions, or by convective or K–H instability.
The values, H, in table 2 are the heights above the sloping bottom to which Eriksen finds that the internal wave spectra are enhanced over a band of frequencies centred at the local internal wave critical frequency, σc. At the Muir Seamount (MS) spectral enhancement decays roughly exponentially from the sloping bottom with a vertical scale of about 100 m, the value taken to characterize H at the MS in table 2. The enhancement is studied in greater detail by Eriksen (Reference Eriksen1998) using data obtained on the side of the Fieberling Guyot (FG). High above the sloping bottom of the FG the internal wave spectra are in agreement with those predicted by Garrett and Munk (Munk Reference Munk1981). Variation of the observed wave spectra from the G-M model appears to be due to the presence of reflected waves and can be detected to a vertical distance, H, from the bottom of 750 m, the value given at the FG in table 2. Approximate measures of the frequency bands of spectral enhancement at about 100 m off the bottom at the MS and FG are given by Δσ in table 2. These are not symmetrical about σc; the upper values are almost twice those of the critical frequencies, σc, suggesting that a sub-harmonic resonance may be a contributor.
Parameter values characterizing observations reported by Eriksen (Reference Eriksen1982, Reference Eriksen1998) over the Muir Seamount (MS) and Fieberling Guyot (FG). ‘depth’ is the water depth at the location of observations. The height, H, of the boundary layer in which wave spectra are affected by wave reflections from the slope are those found by Eriksen (Reference Eriksen1982, Reference Eriksen1985, Reference Eriksen1998) and explained in § 5.1. The parameter Δσ gives the approximate range of wave frequencies around the critical frequency, σc, over which spectra are significantly enhanced above the Garrett--Munk spectra at a height of approximately 100 m above the slope.

The boundary layers of spectral enhancement of internal waves having thickness H in table 2 are distinct from those in which turbulent mixing occurs. At the FG Eriksen (Reference Eriksen1998) detects relatively frequent density overturns that occur between sensors separated vertically by 10 m. Their occurrence frequency decreases monotonically with height up to at least about 100 m off the bottom, a distance substantially less than H. At 20–30 m off the bottom Richardson numbers, Ri, < 0.25, indicative of impending or existing K–H instability occur for 23.1 % of the one year observation period. Approximately half of these low Richardson numbers are associated with negative density gradients (when Ri < 0), and may be a consequence of convective instability. Eriksen deduces that, rather than a superposition of tidal or lower frequency activity, the internal wave activity is responsible for the occurrence rates of unstable conditions; shear and vertical strain fields are dominated by near-critical internal waves. It is not possible, however, from the moored instruments to distinguish between K–H instability and convective instability as sources of overturns; Eriksen is unable, unambiguously, to establish the origin of the overturns. There appears to be a lack of suitable observations of the time and spatial variation of the density structure over a relatively uniform and gentle continental slope to which the present theoretical study can be related. There are, moreover, no observations of the dimensions of wave groups that can provide guidance.
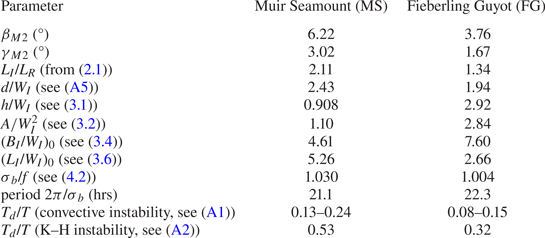
We may, nevertheless, examine Eriksen's data further to see whether (or not) they conform to our analytical results. Table 3 provides values of parameters at the MS and FG that are derived from the analysis of §§ 2–4, taking β as the inclination, βM 2, of internal waves of tidal semi-diurnal M 2 frequency found using (1.1). This is less than the slope angles, α, and the M 2 internal tidal waves are therefore supercritical. Tabulated values of LI/LR and (LI/WI)0 are found at θI = 0° from (2.1) and (3.6), respectively, but are representative of values in the range of azimuths, 0° ≤ θI ≤ 30°. The lengths of reflected groups are less than the incident and, for resonant interactions to be possible, LI/WI must be at least greater than 2.6.
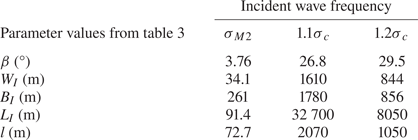
The lengths h/WI in table 3 are the non-dimensional distances from the slope to which the incident and reflected waves may both be present provided that values of BI/WI exceed (BI/WI)0 and LI/WI exceed (LI/WI)0. If h is set equal to Eriksen's observed distance of about 100 m for the extent of the turbulent boundary layer at the FG, then the tabulated value of h/WI at the FG, 2.92, implies that WI is approximately 34 m. Using the tabulated values of (BI/WI)0 and (LI/WI)0 at the FG, BI and LI, however, need to exceed 260 m and 91.4 m, respectively, if the regions of wave interactions are to extend to the height of 100 m to which overturns provide evidence of turbulent mixing. The corresponding vertical area at the FG, A, is 3.29 × 10³ m2. The up-slope length to which a wave group must extend is l = 72.7 m, equal to  ${W_I}/{s_{(\alpha + \beta )}}$ or 2A/(hcα), and BI and l define the smallest dimensions of regions on the slope required for incident and reflecting wave groups to support mixing through interactions to a height of 100 m. Values of β and length scales are summarized in table 4. Values BI, LI and l at the FG defining the smallest sizes of incident and reflected wave groups that can co-exist and therefore possibly interact, are less than the 2.5 km along- and up-slope length of uniformity of the 24.4° slope of the FG around Eriksen's moorings, implying that the assumption that the slope is relatively extensive and uniform may be valid. Provided that incident M 2 internal tidal wave groups with dimensions BI > 258 m and WI > 90.4 m exist, incident and reflected wave groups can co-exist and may interact within the 100 m thick region of observed overturn. No call is required for mixing by waves breaking through K–H instability or convective overturn.
Comparable values for subcritical waves of frequency 1.1σc and 1.2σc at the FG are also given in table 4. The minimum length scales at frequency 1.1σc are relatively large; the vertical size of a wave group is WI/cβ = 1.8 km, comparable to the water depth of 1.415 km at FG where Eriksen's moorings were located, while l exceeds the 2.5 km dimensions of the smooth slope. The analysis is therefore unlikely to be valid for the reflection of wave groups containing waves of frequency 1.1σc. The values at a frequency of 1.2σc appear more possible although, from (1.10) with θI = 0°, it is found that the slopes of waves in the reflected groups exceed those in the incident wave groups by a factor of 75.6 implying that even the reflection of incident waves of moderate slope may be unstable to convective instability. The length scales are proportional to h and would be doubled if h = 200 m.
The necessary (but not sufficient) condition for continual wave breaking near the slope, (4.4), cannot be satisfied at either the MS or the FG; the slopes, α, are too great. Values of σb/f given in table 3 are slightly greater than unity implying that the frequency of breaking waves that will result in a breaking layer that travels along the slope slightly exceeds the inertial. Disturbances of such frequency and period are evident in Eriksen's (Reference Eriksen1998) spectra at FG.
The value of βM 2 is the inclination of the M 2 internal tide to the horizontal found using (1.1) when the wave frequency, σM 2, is that of the internal M 2 (semidiurnal) tide, 1.40 × 10⁻⁴ rad s−1. Values of parameters, LI/LR to (LI/WI)0 at the Muir Seamount (MS) and Fieberling Guyot (FG) are derived from the analysis when θI = 0° and β = βM 2 with other values taken from table 1. Here, γM 2 is the inclination of the breaking wave direction (1.4) to the horizontal for waves of M 2 frequency. The calculated ratios Td/T are those of the duration of turbulence caused by convective instability or by K--H instability, Td, divided by the wave period, T, for waves of M 2 frequency.

Values of β and length scales from the FG for incident waves of frequencies σM 2, 1.1σc and 1.2σc. The group lengths WI, BI, LI and l must be exceeded if wave interactions are possible to h = 100 m.

The observations by van Haren & Gostiaux (Reference van Haren and Gostiaux2010) at the Great Meteor Seamount where K–H billows are observed are in a water depth of 549 m over a slope ≈ 4°. Temperature variations are dominated by supercritical waves of M 2 frequency (βM 2 ≈ 1.5°). Values comparative to those at the FG are h ≈ 50 m, WI = 59.8 m, BI = 1,140 m, LI = 1,370 m and l = 623.9 m. These are relatively moderate values. On reflection an incident M 2 internal wave is increased in steepness by a factor 4.8. It appears possible that, in addition to the K–H instability made evident by billows, resonant wave interactions will also be possible above the Seamount.
Following Kaminski & Smyth (Reference Kaminski and Smyth2019) and as noted in § 5.1 in relation to the intermittency of wave groups, some account should, in general, be taken of the effects of pre-existing turbulence when assessing the new contribution of breaking incident internal wave groups to boundary layer turbulence. The ratios, Td/T, given by (A1) and (A2) in appendix B and displayed in table 3 for the M 2 internal tides at the MS and FG are less than unity, implying that turbulence will not persist over the time, T, between the onset of breaking events in a group. Only at wave frequencies exceeding those of the M 2 tide is turbulence produced by one breaking wave on the steep slopes of the MS and FG likely to persist until its successor is about to break, when it may consequently affect the successor's instability and subsequent transition to turbulence.
6. Conclusions
This study of internal wave groups adds to those of a miscellany of processes, notably resonant interactions and parametric instability, that may lead to turbulent diapycnal mixing induced by internal waves in the globally extensive regions above but close to the continental slopes and the sides of seamounts in the deep ocean. Several simplifying assumptions are made. The density gradient above the slopes is assumed to be uniform and no account has been paid to the effects of along-slope flows. Wave groups are supposed to be composed of internal waves having a small bandwidth. Groups propagate without change of shape towards or from the slopes at the group velocities of linear internal waves. While further consideration of these assumptions is required, the general success of the G-M spectrum in describing internal waves over a wide range of conditions, notably of stratification and shear, in the ocean suggests that an overall, if simplistic approach may provide a useful initial stage in describing wave groups and their reflection. The absence of information about internal wave groups and their breaking is a critical area of ignorance in the knowledge of ocean dynamics. Attention is drawn to the importance of establishing the local cause of turbulence in the sloping boundary layers or ‘internal surf zones’. Is the turbulence generally a consequence of resonant wave interactions or a result of convective or K–H instability? And – recalling the commonly observed 6–9 wave period repetition of high waves in the surface surf zone forced by offshore surface wave groups – is there a periodicity in the turbulence in the internal surf-zone that is related to incoming internal wave groups?
Acknowledgements
I am most grateful to Mrs K. Davis for her care in the preparation of the figures and to the referees for their helpful comments.
Declaration of interests
The author has no conflict of interests.
Appendix A. Propagation of the region of breaking in an internal wave group
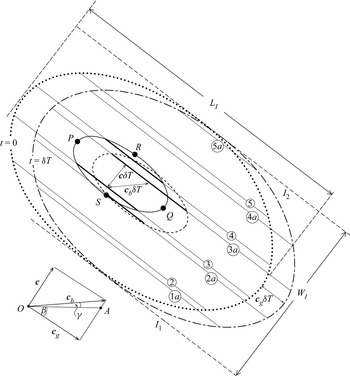
The vector velocities, c, cg and cb in a wave group are shown in figure 16, a sketch of the travel of waves in a vertical section through a wave group, as drawn in figure 1, but over a time period, δT. The dotted curve shows the outline of the group at time t = 0, and lines labelled 2–5 are those of constant phase within the waves, advancing at velocity, c. The curve drawn as a full line near the centre of the group encloses the critical or extreme region moving with the group within which wave breaking occurs. P and Q lie on a line of constant wave phase and PQ indicates the extent of the extreme region in the direction cg of the group's propagation. RS is the maximum extent of the extreme region in the direction c of advancing wave phase. Waves begin to break as they cross the full curve, PSQ. Breaking ceases as waves reach PRQ. Although drawn as a curve that is roughly symmetrical about a straight line joining P to Q, there is no reason even in these idealized conditions why there should be symmetry; the shape of the curve forming the boundary of the extreme region depends on the amplification and decay of waves in the group. Bold lines on waves 3 and 4 indicate the sections of these waves where breaking is occurring at time t = 0 within the extreme region; the lengths of the bold lines indicate the variable extent of unstable conditions and breaking along lines of constant phase in the waves. The extent is increasing for wave 3 but decreasing for wave 4.
A sketch showing the travel of waves in a group and their breaking, explained in appendix A. The initial constant phase lines of component waves in a vertical section through the wave group; the groups are numbered 2–5. After a time δT these have advanced to 2a–5a. Waves have phase velocity, c, and the group has velocity cg. Waves break within the region surrounded by a full line as they move with the group at a mean velocity cg. Bold lines within the extreme region indicate the parts of the lines of constant phase, i.e. the waves, where breaking is occurring. The mean position at which a wave is breaking (at the centre of its bold, constant phase line) moves at velocity cb in a direction inclined at angle, γ, to the horizontal, as shown in the inset at bottom left where the line OA is horizontal.

The dot-dashed curve in figure 16 indicates the position of the group after a time t = δT, in which it has moved in direction cg between the boundary lines I 1 and I 2 through a distance cgδT, where cg = |cg|. (c and cb are similarly defined.) The elliptically shaped dashed curve indicates the location of the extreme region at time δT, having moved a (vector) distance cgδT, from its (full line) position at t = 0. Lines of constant phase have moved a distance cδT to locations 2a–5a. Wave 1 has not reached the wave group at time t = 0 but is within the group in position 1a, but not yet breaking, at time δT. Wave 2 is within the dotted group envelope at time t = 0, and has entered the critical region and, marked as a bold line, has begun to break at time δT. Wave 3 is breaking at time t = 0 and the centre of its breaking region has moved with velocity cb through a distance cbδT at an angle γ to the horizontal in time δT. At time δT its location is 3a. Wave 4 is breaking along some of its length at time t = 0 but, having left the region of extreme waves, has ceased to break at time δT. The non-breaking wave 5 remains in the group over the time δT. At time t = 0, waves 3 and 4 are both breaking, and at time δT waves 2 and 3 are both breaking along the part of their length marked by bold lines. The inset shows the relation between c, cg and cb.
Appendix B. Continuity of wave breaking in a wave group
Continuous breaking occurs in a wave at a location moving at velocity cb as the wave moves through a region of extreme properties, from its entry into the region until its exit from it (Thorpe Reference Thorpe1999b). The duration of continuous breaking is equal to the extent of the extreme region within a wave group in the direction c of the phase speed, the length RS in figure 16, divided by c. The direction in which the successive breaking of waves in a group will occur is given by the motion of the extreme region within a wave group and so travels at angle β with the group velocity, cg. Continual or successive breaking occurs at time intervals equal to the wave period, T, as, one after another, waves enter the moving region of extreme waves. The number of successive breaking events in a breaking group depends on the width of the extreme region and for how long extreme conditions are maintained. This, in turn, may depend on the energy balance of a group and its forcing, whether this is transient or absent, and on the stability of the group (see, e.g. Sutherland Reference Sutherland2006). A further consideration is that of the persistence of turbulence once initiated in a breaking region, the departing breaking wave leaving a trail of decaying turbulence that moves with the fluid rather than the waves or wave group. This is pertinent to the question: ‘Has turbulence from an earlier breaking event collapsed before turbulence is produced in the same location by a following wave?’ The duration of turbulence, Td, resulting from convective instability is (6–12)N −1 and that from K–H instability is approximately 25N −1 (Thorpe Reference Thorpe2018). Turbulence at a specific location in the fluid will persist over the time, T, between the onset of breaking events, if Td > T, or if
 \begin{equation}{T_d}/T = (0.95\text{--}1.9)\sigma /N \gt 1,\end{equation}
when turbulence results from convective overturn, or approximately
 \begin{equation}{T_d}/T = 4.0\sigma /N \gt 1,\end{equation}
for K–H instability. When these conditions are satisfied turbulence produced as a wave enters the (moving) region of extreme conditions in a group, i.e. as shown in figure 16, will still be active when the next wave enters the region. By then, however, breaking may have moved to a new position.
Appendix C. Width and breadth of reflecting groups
C.1 The ratio of widths, WI/WR
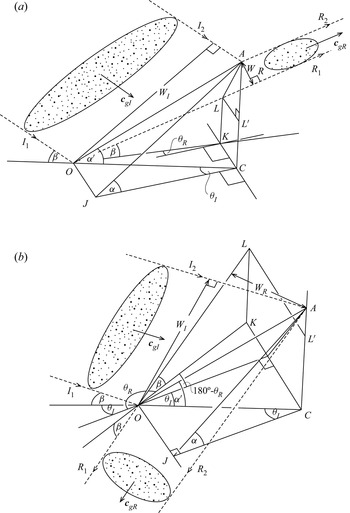
Figure 17 shows a perspective view of the reflections, R 1 and R 2, of the boundaries of a group of incident waves approaching a slope of angle α between I 1 and I 2 in (a) α < β and (b) α > β. The inclination of both the incident and reflected waves to the horizontal is β. I 1 meets the slope at O and I 2 meets the slope at A. The plane OJCK is horizontal. The reflected waves have azimuth angle θR. I 1 and I 2 lie in the vertical plane OCA with azimuth θI, and R 1 lies in the vertical plane LOK. The points O, A and J all lie on the slope. Angle COA = α/. OJ and KC are horizontal and parallel to the isobaths of the slope. R 1 meets the vertical plane ACK at L, and LL / is drawn parallel to KC (and to the isobaths). Angles  $OCK = 90^\circ{-} {\theta _I}$ and OKC = 90° + θR, and so angle
 $KOC = {\theta _I} - {\theta _R}$. Using the sine rule in triangle OCK,
 $OK = OC(\cos {\theta _I}/\cos {\theta _R})$. Since
 $LK( = {L^/}C) = OK{t_\beta }$,
 $A{L^/} = AC - LK = OA[{s_{{\alpha ^/}}} - {c_{{\alpha ^/}}}{c_{{\theta _I}}}{t_\beta }/{c_{{\theta _R}}}]$. Again using the sine rule in triangle OCK,
 $KC = OA{s_{({\theta _I}\text{--}{\theta _R})}}{c_{{\alpha ^/}}}/{c_{{\theta _R}}}$. Using (AL)2 = (LL /)2 + (AL /)2 since angle LL /A = 90°, and using LL / = KC, we have an expression for AL in terms of OA. The cosine rule in triangle AOL gives cos(angle AOL) and thence an expression for WR = OA sin(angle AOL), where
 $\cos (\textrm{angle}\;AOL) = {s_{{\alpha ^/}}}{s_\beta } + {c_\beta }{c_{{\alpha ^/}}}{c_{({\theta _I}\text{--} {\theta _R})}}$. Since
 ${W_I} = OA{s_{({\alpha ^/} + \beta )}}$, WI/WR is given by (2.2).
The reflection of an elliptically shaped (stippled) wave group with azimuth θI lying between lines I 1 and I 2 from a slope AOJ: (a) α < β (subcritical) and (b) α > β (supercritical). The reflected group lies between R 1 and R 2 and has azimuth θR, drawn to be clockwise about the vertical line AC.

C.2 The ratio of breadths, BI/BR
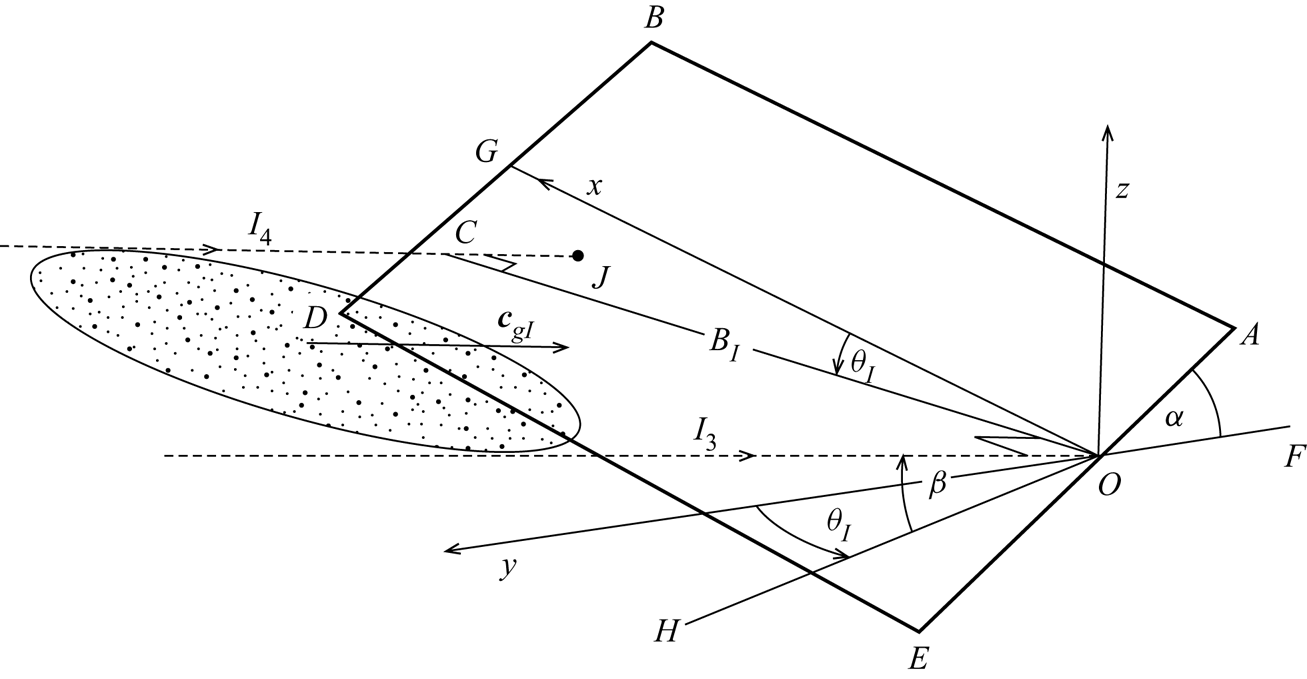
Changes in the breadth of an incident wave group, BI, are caused by its reflection from a plane boundary. It is supposed in figure 18 that an incident wave group lies between parallel lines I 3 and I 4, separated horizontally by the distance OC = BI. I 3 meets a plane sloping boundary, ABDE (outlined by thicker lines, the upper part, OABG, being with y > 0, and the lower, GDEO, with y < 0) at point O. Here y is defined in the set of axes x, y and z, centred at O, with the x axis horizontal in the plane of the slope and z vertical. The co-ordinates of point J where I 4 meets the sloping boundary are found to be
 \begin{align} x(J),y(J),z(J) & = {B_I}({s_{({\alpha ^/} + \beta )}} - s_{{\theta _I}}^2{s_\beta }{c_{{\alpha ^/}}})/({s_{({\alpha ^/} + \beta )}}{c_{{\theta _I}}}),\;{B_I}{s_{{\theta _I}}}{s_\beta }{c_{{\alpha ^/}}}/{s_{({\alpha ^/} + \beta )}},\nonumber\\ & \quad - {B_I}{t_{{\theta _I}}}{s_\beta }{s_{{\alpha ^/}}}/{s_{({\alpha ^/} + \beta )}}.\end{align}
Waves belonging to the incident group near I 3 are reflected from the slope at point O and travel along a line given by directions β and θR. Waves reflected from point J travel along a parallel line. The distance between these two lines is equal to the breadth, BR, of the reflected group, and this is equal to the distance of J from the line marking the waves reflected from point O. This gives
 \begin{equation}B_R^2 = {[z(J){s_{{\theta _R}}} + x(J){c_{{\theta _R}}}]^2} + y{(J)^2},\end{equation}
which is found in terms of BI and angles α/, β, θI and θR using (A3).
The approach of a wave group (stippled) to a plane slope, ABDE, outlined by thick lines. The group lies between parallel lines I 3 and I 4, separated by the breadth of the group, BI, as in figure 1. Here, I 3 meets the slope at point O and I 4 meets the slope at J. Axes x, y and z are centred at O, with the x axis horizontal in the plane of the slope. The azimuth angle is θI. (This is shown as an anticlockwise rotation about the vertical axis, z, and consequently J is below the surface z = 0, in contrast with figure 1, where θI is drawn as a clockwise rotation about the vertical axis and J lies at z > 0.) The direction of I 3 and I 4 is determined by two rotations. The first is a rotation through the azimuth angle, θI, about the z axis; this is equal to that between the y axis and the line OH. The second is a rotation, β, about the horizontal line, OC = BI, the distance between I 3 and I 4. The line I 4 meets the plane slope at the point J.

Appendix D. Distortion of a group on reflection from a uniform slope
Figure 7(a) shows the geometry of the reflection of a two-dimensional group (i.e. such that  ${B_I} \gg {L_I}$ or WI) of waves when θI = 0°, α + β < 90° and α < β. The slope, OA, is at an angle α to the horizontal. The incident wave group lies between the lines I 1 and I 2 and advances parallel to these lines at speed cgI at angle β to the horizontal. It is supposed that the front of the incident group is plane and normal to I 1 and I 2 and, at time t = 0, lies along the line OE of length WI, having just reached the slope at point O. The front of the group at point E on I 2 has not yet arrived at the slope. It does so later, at point A, after a time t = t1. The front of the reflected group then lies along some line AB, with B on line R 1, the upper boundary of waves belonging to the group reflecting from O and propagating at speed cgR. The point C is the foot of the perpendicular from A to R 1. CA would represent the position of the front of the reflected group if it, like the incident group front, were plane and normal to the group boundaries, now R 1 and R 2. The time, t 1, for the advance of the incident group from E to A is the same as that for the reflected group to advance from O to B;
 ${t_1} = EA/{\boldsymbol{c}_{gI}} = OB/{\boldsymbol{c}_{gR}}$. Noting that
 ${\boldsymbol{c}_{gI}}/{\boldsymbol{c}_{gR}} = {s_{(\alpha + \beta )}}/{s_{(\beta - \alpha )}}$, simple geometry leads to
 $OB/OC = 1/{t_{(\alpha + \beta )}}$. In general the reflected front, AB, is skewed between R 1 and R 2. Only when α + β = 45° is it, like the incident front, plane and normal to the wave propagation direction. The reflected front lies below AC, as illustrated in figure 7(a), when α + β > 45°.
Figure 7(b) is similar to (a) but with α > β. The incident front is along AD and is normal, as before, to I 1 and I 2. No reflected fronts are found that are normal to R 1 and R 2. Indeed that illustrated, OB, is at a relatively small angle to R 1.
Figure 7(c) shows the reflection of an elliptically shaped wave group, again when θI = 0° and α < β. Points E and F in the reflected group correspond, respectively, to points B and C on the axis of the incident group. The waves on BC must reflect in the same way as the rectangular front OE shown in figure 7(a), as if BC were the front of the group, with accompanying twisting of the line EF and distortion of the group.
Appendix E. Rotation of a wave group on reflection from a uniform slope
Figure 19(a) shows a vertical plane at azimuthal angle θI through a group of waves of width WI between lines I 1 and I 2 incident on a slope with effective angle α/ < β. I 1 meets the slope at point O and I 2 meets it at point A, as in figure 1. The reflected wave group travels in a plane at an angle  $({\theta _I}\text{--} {\theta _R})$ to the plane at angle θI. Projected onto a horizontal plane through O as shown in figure 19(b) the incident wave group propagates between I 1 and I 2 (which are coincident at an angle θI to the up-slope direction), and the reflected group lies between R 1 and R 2, with direction θR. The point A / is the vertical projection of A onto the horizontal plane. The distance separating I 1 and I 2 in part a of the figure is WI, and d is the horizontal separation of R 1 and R 2 as shown in part b. Since
 $O{A^/} = OA{c_{{\alpha ^/}}}$ (figure 19a),
 ${W_I} = OA{s_{({\alpha ^/} + \beta )}}$ and
 $d = O{A^/}{s_{({\theta _I}\text{--}{\theta _R})}}$ (figure 19b), the distance d through which the waves in the lower part of the group are displaced after reflection from those in the upper part of the wave group is given by
 \begin{equation}d/{W_I} = {c_{{\alpha ^/}}}{s_{({\theta _I}\text{--}{\theta _R})}}/{s_{({\alpha ^/} + \beta )}},\end{equation}
when β > α/ and θI > θR. When β < α/ and θR > θI the reflected waves propagate towards deeper water as in figure 3(d), and (A2a) becomes
 \begin{equation}d/{W_I} = {c_{{\alpha ^/}}}{s_{({\theta _R}\text{--} {\theta _I})}}/{s_{({\alpha ^/} + \beta )}}.\end{equation}
(a) A vertical plane through a group of waves (stippled) of width WI lying between lines I 1 and I 2 and incident from top left onto a slope OA with effective angle α/ at azimuthal angle θI, as in figures 1 and 3(b) when β > α/. (b) The projection of the boundary lines onto a horizontal plane through O. The incident wave group travels at an angle θI to the up-slope direction and the reflected group, between R 1 and R 2, propagates at angle θR. The lines I 1 and I 2 are vertically above one another and therefore appear here as a single line. d is the horizontal distance through which the lower waves in a group are displaced from the waves in the upper part of the reflected group.