Implications
In horses and ponies, obesity is common and is associated with several health risks. In man the location of the fat excess has a greater association with health risk than elevated BW per se. This study showed the existence of a limit in fat tissue expandability of subcutaneous fat tissue in Shetland ponies, which contributes to a better understanding of fat tissue dynamics. It is not yet known if the greater increase in abdominal fat in Shetland ponies has similar negative effects as those described for man and dogs.
Introduction
In parallel with the human obesity ‘epidemic’, obesity is common in horses (Giles et al., Reference Giles, Rands, Nicol and Harris2014; Visser et al., Reference Visser, Neijenhuis, de Graaf-Roelfsema, Wesselink, de Boer, van Wijhe-Kiezebrink, Engel and van Reenen2014). Incidences of obesity of up to 45% have been reported among riding horses in the United Kingdom and the Netherlands (Wyse et al., Reference Wyse, McNie, Tannahil, Murray and Love2008; Stephenson et al., Reference Stephenson, Green and Freeman2011; Visser et al., Reference Visser, Neijenhuis, de Graaf-Roelfsema, Wesselink, de Boer, van Wijhe-Kiezebrink, Engel and van Reenen2014). Obesity is defined as the accumulation of excessive adipose tissue (Robin et al., Reference Robin, Ireland, Wylie, Collins, Verheyen and Newton2014). Feeding a diet that contains more energy than physiologically required results in fat accumulation and weight gain (Carter et al., Reference Carter, McCutcheon, George, Smith, Frank and Geor2009; Lindåse et al., Reference Lindåse, Nostell, Müller, Jensen-Waern and Bröjer2016). Breed differences in the predilection to developing obesity have been documented, underpinning the suggestion that there is a genetic basis to obesity (Bamford et al., Reference Bamford, Potter, Harris and Bailey2014). In this respect, ponies and certain breeds of horses show a greater tendency to becoming obese and undergoing changes in insulin sensitivity than Standardbreds (Frank et al., Reference Frank, Bailey, Geor, Durham and Johnson2010; Bamford et al., Reference Bamford, Potter, Harris and Bailey2014). This makes them more susceptible to the associated negative health effects of obesity including exercise intolerance, insulin dysregulation, laminitis, osteoarthritis and reduced fertility (Wyse et al., Reference Wyse, McNie, Tannahil, Murray and Love2008; Johnson et al., Reference Johnson, Wiedmeyer and Ganjam2009; Giles et al., Reference Giles, Rands, Nicol and Harris2014).
Ectopic fat depots of white adipose tissue are thought to be major drivers of insulin dysregulation and associated metabolic complications, and to trigger higher expression of inflammation-related genes (Tchkonia et al., Reference Tchkonia, Thomou, Zhu, Karagiannides, Pothoulakis, Jensen and Kirkland2013; Gustafson and Smith, Reference Gustafson and Smith2015; Wensveen et al., Reference Wensveen, Valentic, Sestan, Turk-Wensveen and Polic2015). Dysregulation of secretion of these metabolically active substances occurs in obese animals, leading to a state of low-grade inflammation (Frank et al., Reference Frank, Bailey, Geor, Durham and Johnson2010). The distribution of adipose tissue appears to influence the severity and likelihood of the pathological consequences of obesity (Bruynsteen et al., Reference Bruynsteen, Erkens, Peelman, Ducatelle, Janssens, Harris and Hesta2013). Therefore it is important to understand the predilection sites for fat accumulation in breeds predisposed to the negative health consequences of obesity. The objective of this study was to monitor BW gain, increase in body condition scores (BCS) and accumulation and relative distribution of fat deposition in Shetland ponies fed either a control diet at maintenance (100% net energy (NE)) or a high energy (200% NE) diet over a prolonged period.
Material and methods
Animals and husbandry
The study was executed between February 2014 and October 2015. The population consisted of eight Shetland pony mares (age 3 to 7 years, mean 4.7 years), mean body weight 164 (±31) kg, BCS 5.9 (±0.7) out of nine at the start of the study. Only mares were used in this study, which was part of a larger study examining effects of obesity on reproductive parameters. Routine foot care, vaccination and anthelmintic treatments were performed when necessary and rectal temperature and heart rate were monitored daily to assess general health. The ponies were randomly divided among the control (n=4) and the high energy (HE) group (n=4); one pony from the HE group was exchanged with a pony from the control group directly after the start of the experiment because she was not able to eat the amount of feed provided. No medical abnormalities were found in this pony.
Study design
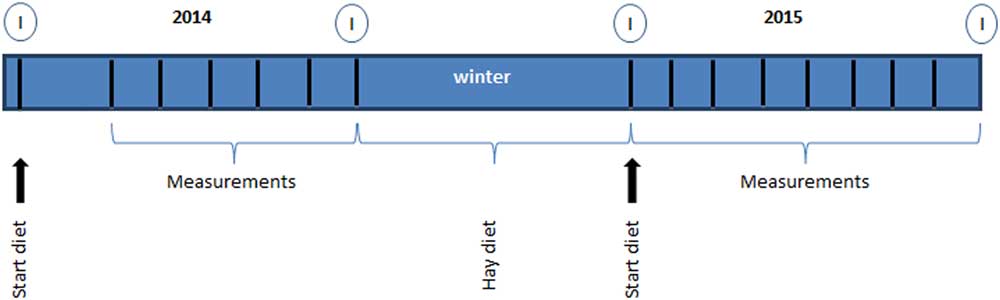
All ponies were allowed an acclimatization period of at least 2 weeks before starting on the experimental diet. Measurements of BW and BCS were performed before the start of the experiment and continued on a monthly basis. For practical reasons, the ultrasonographic fat measurements were initiated 12 weeks after the start of the diet in 2014 and performed monthly from June 2014 to October 2014 (period 1 to 5). In 2015, ultrasound measurements were performed monthly during the entire period of high energy feeding from March 2015 to October 2015 (period 6 to 13) (Figure 1). Basal blood plasma glucose and insulin concentrations were analyzed before and after the feeding periods in 2014 and 2015.
Design of the study to examine the effects of feeding Shetland pony mares a normal (n=4) or double maintenance (high energy (HE); n=4) diet on parameters of obesity. Arrow: start diet, body condition score (BCS) and BW measurements. Measurements: weekly BW, monthly BCS and ultrasound measurements. Hay diet: winter period no measurements, only hay diet for both HE and control group. I=samples for glucose and insulin analysis.

Diet
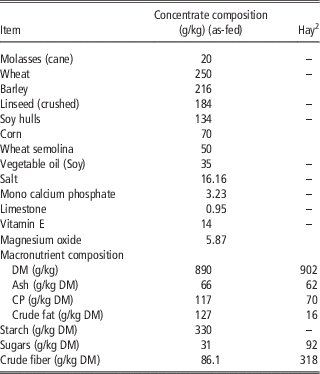
All ponies were fed individually according to BW on a NE basis, and received a ration consisting of a semi-purified concentrate (Table 1), grass hay and a mineral and vitamin supplement. Ponies in the control group were fed an energy level equating to maintenance according to NE requirements set by the Centraal Veevoederbureau (CVB, 2004) (≈0.348 MJ NE×BW0.75). The ponies in the control group received 85% of NE intake in the form of hay. The remaining 15% was provided as concentrates. Ponies in the HE group received 200% of their NE requirements to induce weight gain, as previously described by Carter et al. (Reference Carter, McCutcheon, George, Smith, Frank and Geor2009). Energy intake was adapted to weight gain throughout the whole experiment, to maintain a 200% NE intake. The diet for ponies in the HE group was designed such that 42.5% of NE intake originated from hay, and 57.5% from the semi-purified concentrate. All ponies received >1 kg dry matter (DM) forage per 100 kg BW per day. The NE content of the hay was analyzed (BLGG AgroXpertus; Wageningen, the Netherlands) and hay intake was adapted accordingly to maintain a similar energy partitioning during the study. The concentrate and hay was fed in multiple meals at 0800, 1300 and 1700 h. All ponies received (0800 h) a fixed amount of a supplement (Pavo Vital Complete; Pavo, Boxmeer, the Netherlands) (30 g/day) to ensure adequate provision of minerals, trace elements and vitamins (NRC, 2007). The ponies had free access to water and a salt lick (KNZ®; Hengelo, the Netherlands). During the 1st year (2014), the control ponies were housed in a group but fed individually, and bedded on wood shavings. The HE ponies were housed and fed individually. In between the experimental periods of 2014 and 2015 (winter 2014 to 2015), all ponies were housed together in a group on straw, with a maintenance hay-only diet of at least 100% NE requirements. In the 2nd year (2015), all ponies were housed and fed individually and bedded on shavings. Groups were allowed access to a sand paddock every other day for social contact and limited exercise during the experimental periods.
Calculated ingredient and macronutrient composition of the semi-purified dietFootnote 1 and hay fed to Shetland pony mares

1 PAVO, Heijen, the Netherlands.
2 Analysis provided by BLGG, AgroXpertus, Wageningen, the Netherlands.
Physical measurements: body weight, body condition scores and ultrasonographic fat measurements
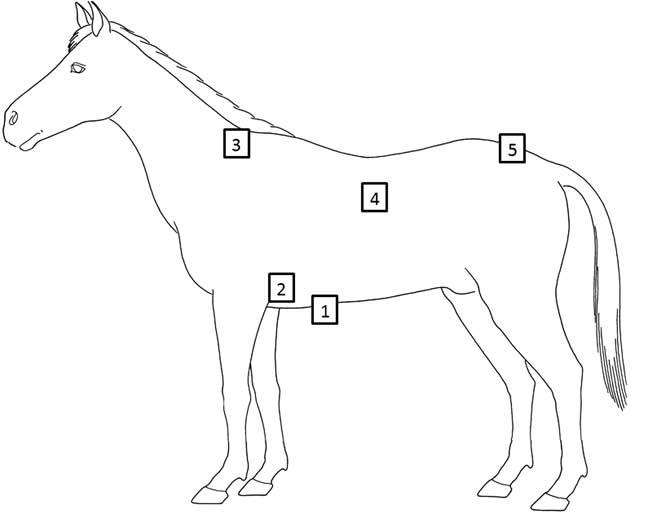
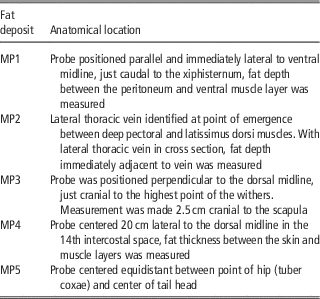
The BW of each pony was measured monthly (mean of three measurements) using a weighing scale (Epelsa BCN100M; Grupo Epelsa, Madrid, Spain). All BCS and fat thickness estimations were performed by the same observer throughout the study, who was blinded to the diet the ponies received. The BCS of each animal was assessed by visual appraisal and palpation and scored on a nine-point scale in accordance with criteria described by Henneke et al. (Reference Henneke, Potter, Krieder and Yeates1983). The superficial fat deposits were measured to the nearest 0.01 mm by transcutaneous B-mode ultrasonography using a Logiq 7 Pro ultrasound machine equipped with a 10 MHz linear array probe (GE Medical Systems; Milwaukee, WI, USA). Five locations named measurement point 1 to 5 (MP1 to MP5; retroperitoneal, axillary, withers, intercostal and rump), were examined on each pony (Table 2 and Figure 2) as described by Dugdale et al. (Reference Dugdale, Curtis, Cripps, Harris and Argo2011a). All locations except for MP1 are referred to as subcutaneous fat tissue, MP1 is referred to as retroperitoneal fat tissue. All measurements were performed on the left side with the pony standing squarely, and repeated three times. Before the measurements the locations were clipped and cleaned using a chlorohexidine solution (Hibiscrub; BMC Ltd., Nottingham, UK) and 70% alcohol solution. Ultrasound imaging was performed using transmission gel (Chemolan; Chemodis, Alkmaar, the Netherlands). Images were saved and fat thickness was measured (GE Truscan architecture; Wauwatosa, WI, USA); the mean of the three measurements per location was used for statistical analysis.
Schematic view of anatomic locations used to asses adipose tissue thickness in Shetland pony mares fed a normal (n=4) or double maintenance (high energy (HE); n=4) diet by transcutaneous ultrasound. 1=retroperitoneal; 2=axillary; 3=withers; 4=intercostal; 5=rump.

Specific anatomical locations used for the transcutaneous ultrasonographic measurement of adipose tissue thickness in Shetland pony mares fed a normal or a double maintenance energy requirement (high energy (HE)) diet

MP1=retroperitoneal; MP2=axillary; MP3=withers; MP4=intercostal; MP5=rump.
All measurements were recorded on the left side of the pony, with the animal standing squarely.
Blood glucose and insulin measurements
After fasting for 8 h whole blood samples were recovered between 0600 and 0800 h into 4 ml sodium-fluoride (glucose) and sodium-heparin (insulin) tubes. Glucose analysis was performed directly. The heparinized tubes were immediately centrifuged at 3000×g for 10 min, the plasma was frozen at −20°C until analysis. In 2014, insulin concentrations were measured using a commercial radioimmunoassay (RIA Coat a Count; Siemens Diagnostic Products Corp, Los Angeles, CA, USA) validated for horses (Kolk van der et al., Reference Kolk van der, Wensing, Kalsbeek and Breukink1995). In 2015, the RIA kit was no longer available and the plasma insulin concentrations were determined using a new commercially available solid-phase, enzyme-labeled chemiluminescent immunometric assay (CLIA) designed for human insulin (Immulite 2000 Insulin; Siemens Diagnostic Products Corp, Los Angeles, CA, USA). This CLIA was validated using equine plasma samples held in our laboratory and compared with the previously used RIA (CAC insulin). Linearity plots were constructed by comparing the CAC insulin concentrations with the CLIA insulin. The relationship between the two assays was determined by linear regression to be: CLIA=0.76×CAC; R 2=0.98. All the insulin concentrations from 2014 were recalculated using this formula to allow comparison with the results from 2015. Hyperinsulinemia was defined as basal plasma insulin ⩾20 µIU/ml, in accordance with the American College of Veterinary Internal Medicine consensus statement (Frank et al., Reference Frank, Bailey, Geor, Durham and Johnson2010).
Statistical analysis
Statistical analyses were performed using SPSS software (SPSS 22-24; Quarry bay, Hong Kong). For all data, normal distribution of the residuals was confirmed using a Shapiro–Wilk test or by visual inspection of the Q-Q plot. MP5 and insulin data needed log transformation in order to achieve a normal distribution, left-censoring for observations below the detection limit was used for the insulin data. For the normally distributed data, a linear mixed-effects model followed by a post hoc Bonferroni test was used; with period and group as fixed effects and pony as random effect. For the non-normally distributed MP3, a non-parametric Mann–Whitney U-test was used to compare between groups, and a Wilcoxon-Signed Rank test was used to compare between measurement periods. For the insulin data a likelihood ratio test was used to test the effect of the diet. In the text, all results except for MP3, are presented as mean±SE of the residuals. MP3 is presented as median (interquartile range (IQR)). P values <0.05 were considered to indicate statistically significant differences. Spearman’s rank correlation coefficient was used to investigate correlations between BW, BCS and subcutaneous and retroperitoneal fat depth.
Results
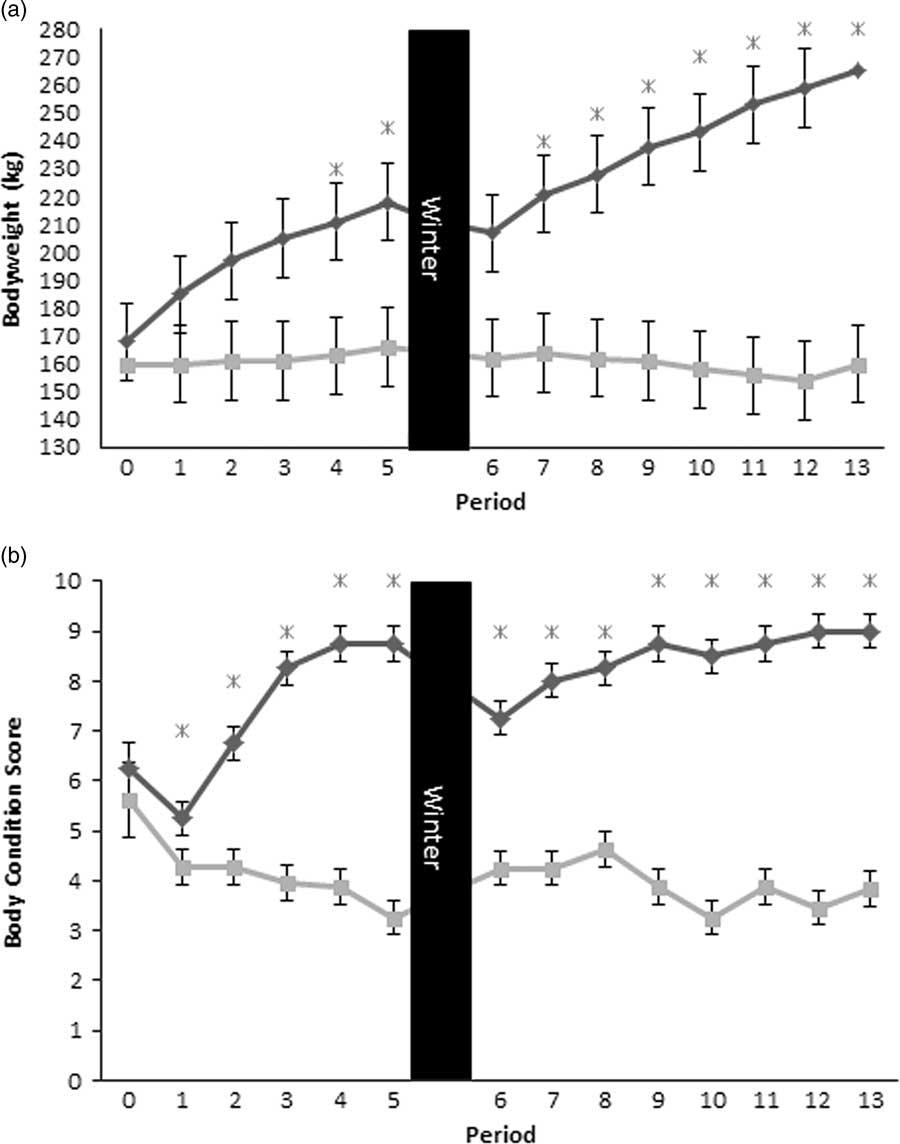
During the course of the study, one pony in the control group developed mild colic once; one pony in the control group was not always able to finish the concentrate. None of the ponies developed any signs of laminitis or any other significant clinical symptoms. There was no significant difference in BW between the control (160±1.1 kg) and the HE (168±1.1 kg) group at the onset of the study (P=0.24). The HE group exhibited a significant increase in BW over time in all periods, with the exception of the winter period where they showed a significant decrease in BW (P<0.0001). From period 4 (week 24), the HE ponies were significantly heavier than the control ponies (P<0.05) (Figure 3a). After the winter period there was again no difference in BW between the control and the HE group, although the latter were still considerably heavier than their initial BWs. After 28 weeks (period 5) of the HE diet in 2014, the respective ponies showed a mean increase in BW of 30% (P=0.001). In 2015, the mean increase in BW of the HE group after 34 weeks of receiving the diet (period 13) was 28% (P<0.0001). The overall mean increase in BW from period 1 to 13 in the HE ponies was 52%. The control group showed no significant changes in BW over the entire monitoring period (Figure 3a).
(a) Monthly mean±SE BW measurements and (b) monthly mean body condition scores in normal or double maintenance fed Shetland pony mares (n=4 per group) during a 2-year feeding trial. Period 0 was at the start point of the diet, periods 1 to 5 were in year 1, and periods 6 to 13 in year 2.  =Control group;
 =High Energy group; *=test group significantly different from control group, P<0.05; winter=period with hay-only diet in both groups.
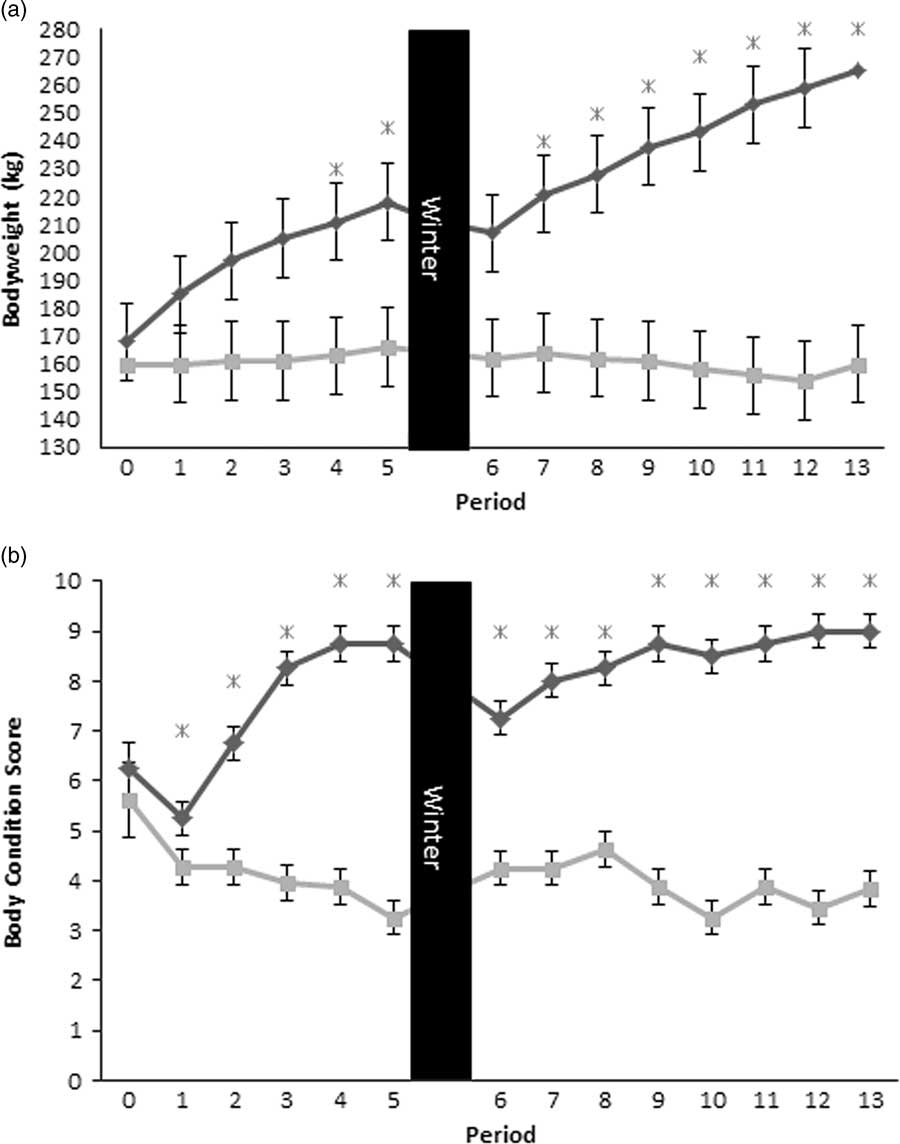
The BCS at the start of the study was not significantly different between the two groups (5.6±0.02 for the control group v. 6.3±0.02 for the HE group). In 2015, the BCS of the control group differed slightly in several periods (Figure 3b). The HE group showed an increase in BCS from period 1 (5.3±0.02) to period 5 (8.8±0.02; P<0.001), with a drop in the winter period from 8.8±0.02 to 7.3±0.02 (P<0.001). In 2015, the increase in BCS resumed with the start of the HE diet and progressed to 9.0±0.02 by period 13 (P<0.001) in all HE-fed ponies. The HE group showed a mean increase in BCS of 67% in 2014 (P<0.001) and 24% in 2015 (P<0.002). The overall mean increase from period 1 to period 13 was 70% (P<0.001) (Figure 3b).
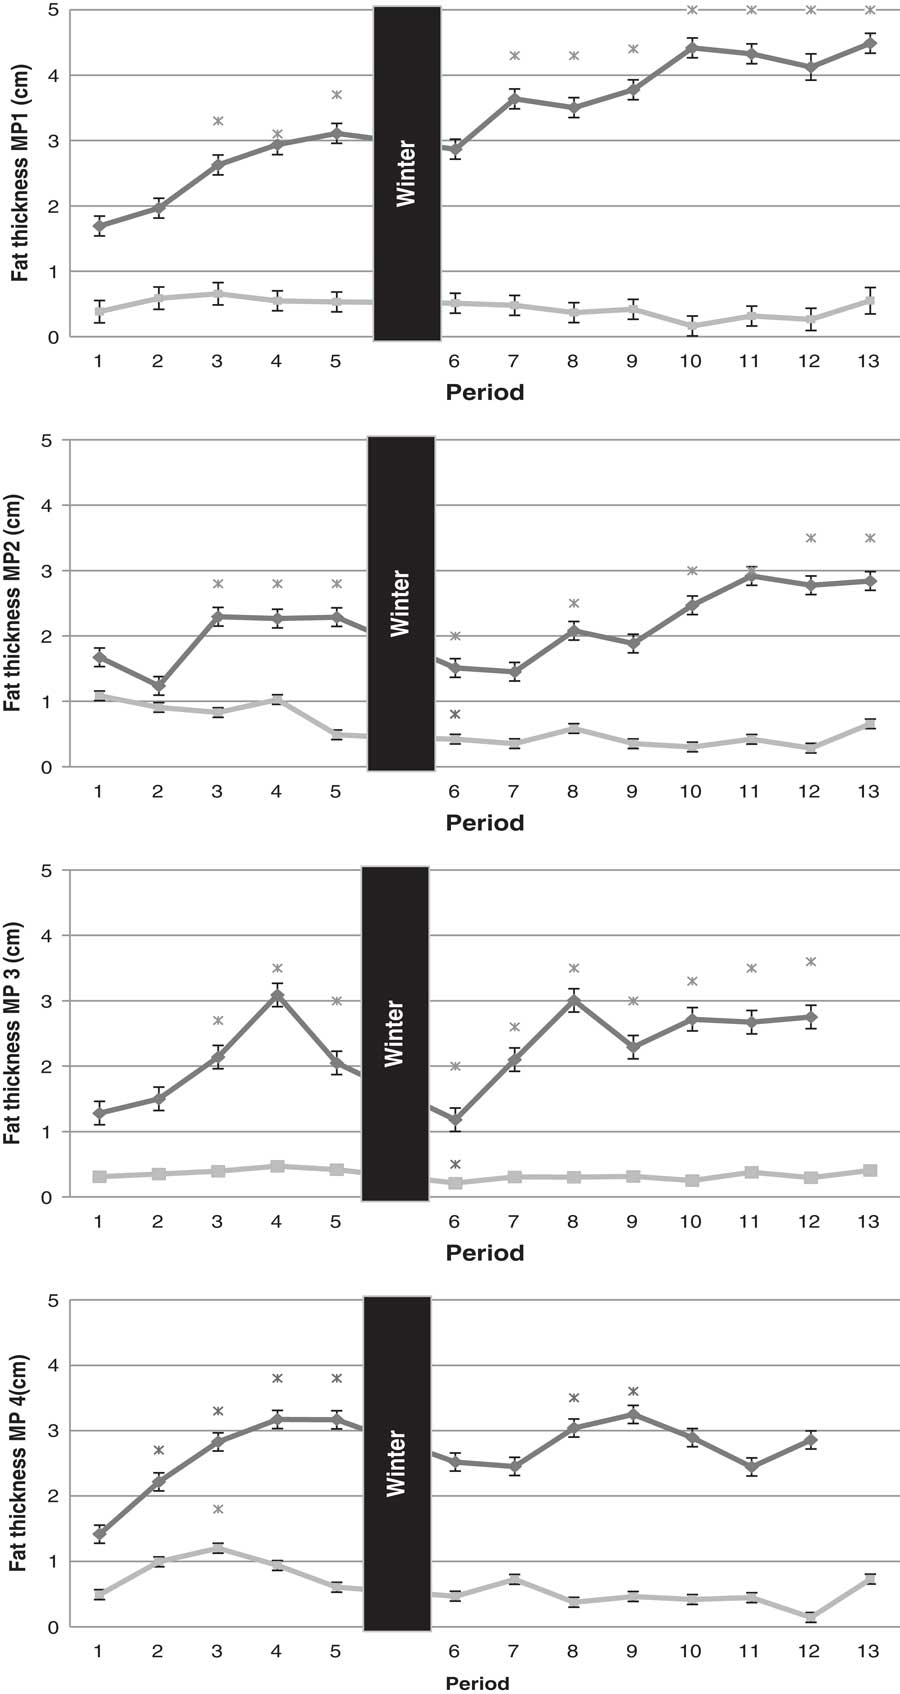
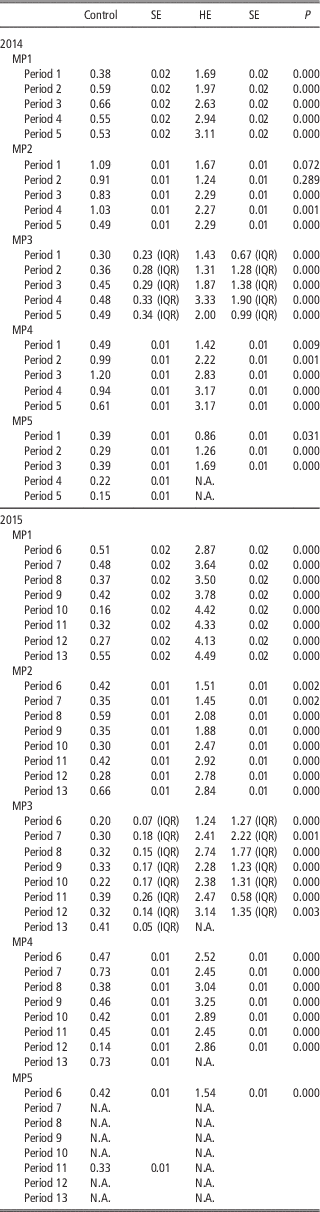
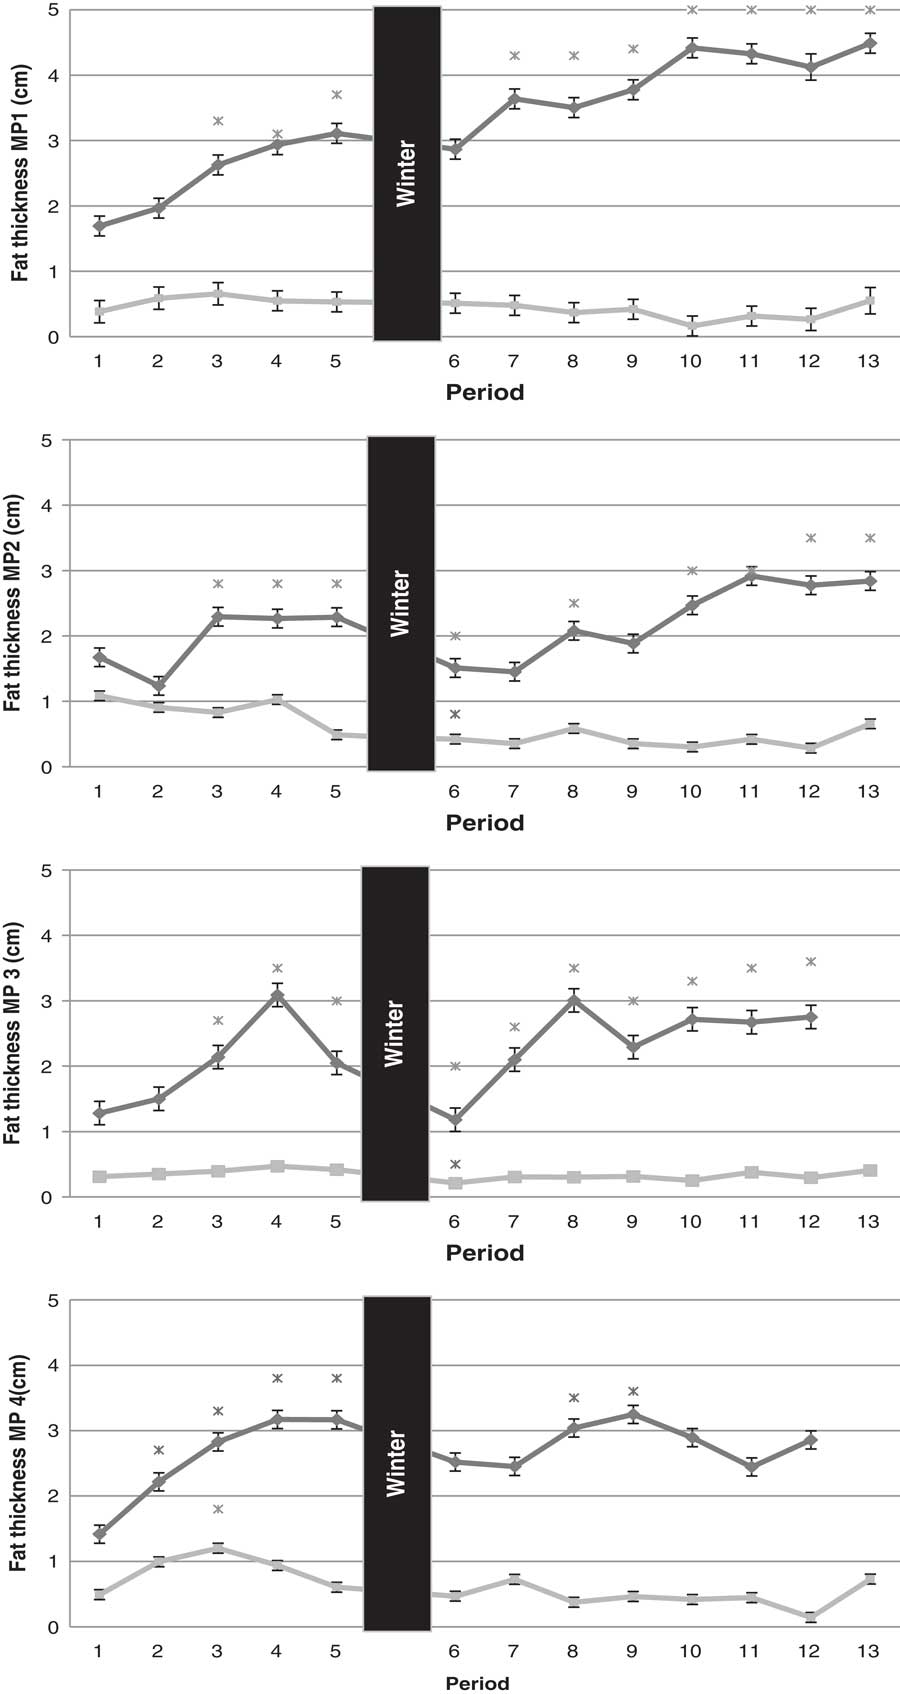
In period 1 (12 weeks on the diet), the HE group had significantly thicker fat layers at all locations compared with the control group, with the exception of the axillary fat deposit (MP2; Table 3). The control group showed some fluctuations in fat depth over time (Table 3 and Figure 4).
Monthly mean±SE (MP1, 2 and 4) or median (MP3) transcutaneous ultrasonographic adipose tissue thickness measurements in normal or double maintenance fed Shetland pony mares (n=4 per group) during a 2-year feeding trial on four different locations. Period 0 was at the start point of the diet, periods 1 to 5 were in year 1, and periods 6 to 13 in year 2. Locations: MP1=retroperitoneal; MP2=axillary; MP3=withers; MP4=intercostal; MP5 (rump) was not shown in this graph =Control group; =High Energy group; *=significantly different from start of diet, P<0.05; winter=period with hay-only diet in both groups.
Mean fat depth (cm)±SE at the different time points in Shetland pony mares fed a normal (n=4) or double maintenance (high energy (HE): n=4) diet, comparing the HE and control group at the different time points (period)

MP1=retroperitoneal; MP2=axillary; MP3=withers; MP4=intercostal; MP5=rump.
For MP3 median (IQR) (cm) noted. P<0.05 indicating significant difference between control and HE group.
For the HE group, the fat depth increased significantly over time at all locations during 2014 (Table 3 and Figure 4). After the winter hay-only period, the HE group showed a slight decrease in fat depth that only reached statistical significance for MP2 and MP3. The retroperitoneal adipose tissue (RAT, MP1) showed a gradual increase in depth over the entire feeding period, and was eight times greater than in the control group by the end of 2015, when the subcutaneous deposits (SAT) were only 1.6 to 2.2 times greater in the HE group. In 2014, fat thickness at MP1, MP2, MP3 and MP4 stabilized during period 3 to 5 in the HE group. A similar plateau was seen during the 2nd year, data from the HE group for MP3 and MP4 in period 13 were missing due to difficulty in obtaining representative ultrasound images. For MP5 only data from periods 1 to 3 in 2014 was available for analysis. Nevertheless, the HE group showed a significant increase in fat depth at MP5 over time. A strong positive correlation (ρ=0.81) was found between BCS and BW. Correlations ranging from 0.84 to 0.91 were found between BCS and the various ultrasonographic measurements locations of fat depth. The correlations between BW and measurement locations ranged from 0.73 to 0.76.
Two basal glucose values at the start of 2014 in the HE group were below the normal reference range of 3.9 to 5.6 mmol/l, all other values were within the reference range. No changes were observed in glucose concentrations over time in the control group. In the HE group, there was a significant increase in mean glucose concentration between the start and the end of 2015, starting at 4.3±0.02 mmol/l and increasing to 4.9±0.02 mmol/l (P=0.02). Mean basal insulin levels in the control group before (2.1±0.23 μIU/ml) and at the end (all ponies below detection limit of 2.0 μIU/ml) of the experiment did not differ. In the HE group, insulin levels before the start of the diet were below the level of detection in both years (<2.0 μIU/ml), and had increased after the dietary period (3.8 μIU/ml±0.23 in 2014, P=0.04; 3.5 μIU/ml±0.23 in 2015, P=0.04) with a likelihood ratio of 4.14.
Discussion
In this study, ultrasonography was used to measure changes in subcutaneous and retroperitoneal fat depth in Shetland pony mares on a high energy diet equating to 200% of maintenance energy compared with Shetland pony mares on a maintenance energy diet. The excess dietary energy was shown to be stored in the form of subcutaneous and retroperitoneal fat. Across the monitoring period, retroperitoneal fat depth increased by a factor of 8 compared with more modest increases in subcutaneous fat thickness (1.6 to 2.2 times) within which the accumulation of axillary fat appeared to be slower than at other locations. Carter et al., found a similar 1.6 times increase in subcutaneous fat thickness in horses fed 200% maintenance energy diet for 16 weeks, although different measurement locations were used (Carter et al., Reference Carter, McCutcheon, George, Smith, Frank and Geor2009). The increase in BW in the HE group in the present study is comparable with the BW increase found by Carter et al. (Reference Carter, McCutcheon, George, Smith, Frank and Geor2009) of 20% over 24 weeks.
In the winter period the HE group showed significant decreases in BW, BCS and withers and axillary fat thickness which reduced to pre-study levels, while retroperitoneal fat (MP 1) did not decrease notably. This finding suggests that the retroperitoneal fat depot not only increases the most, but during a period of relatively lower energy supply it reduces less compared with the subcutaneously located fat deposits. The decrease in BCS despite a constant BW observed in the control group during 2015 might be attributed to growth of the young ponies.
Dugdale et al. (Reference Dugdale, Curtis, Cripps, Harris and Argo2010) evaluated five overweight pony mares during a 12-week period of weight loss and found decreases in BW and subcutaneous fat depots (gluteal region and 12th intercostal space) but no decrease in BCS which is in contrast with the present study where the sonographic reduction in fat thickness was reflected by decreased BCS in the HE group. The difference with the present study might be explained by a longer period of low energy feeding and, possibly, season (Dugdale et al., Reference Dugdale, Curtis, Cripps, Harris and Argo2011a). Strong correlations between BCS and ultrasound fat thickness have been reported previously in horses (ρ>0.8) and donkeys (ρ=0.7 to 0.9) and showed similarity to our findings (ρ=0.8 to 0.9) in Shetland ponies (Gentry et al., Reference Gentry, Thompson, Gentry, del Vecchio, Davis and Del Vecchio2004; Quaresma et al., Reference Quaresma, Payan-Carreira and Silva2013). A relative stability of rump fat has previously been reported in studies that monitored weight loss in horses and ponies (Gentry et al., Reference Gentry, Thompson, Gentry, del Vecchio, Davis and Del Vecchio2004; Dugdale et al., Reference Dugdale, Curtis, Cripps, Harris and Argo2011a and Reference Dugdale, Grove-White, Curtis, Harris and Argo2012). In the present study, we observed an increase in rump fat over time in the HE compared with the control group, and a strong correlation between rump fat thickness and BW and BCS in the early stage of the study period. In the later stages of the study the image quality at the rump was poor, breed and local thickening of the skin are assumed to be contributory factors to these difficulties. This was not reported in other studies; however, other studies collected fat thickness results only once or over a shorter period of time (Gentry et al., Reference Gentry, Thompson, Gentry, del Vecchio, Davis and Del Vecchio2004; Dugdale et al., Reference Dugdale, Curtis, Cripps, Harris and Argo2011a).
In man, the adipose tissue expandability theory states that SAT has limited expandability (Gustafson and Smith, Reference Gustafson and Smith2015). When the SAT reaches its limits, further accumulation will occur in visceral adipose tissue or as ectopic fat depots, which are known to have more negative effects on metabolic parameters than SAT (Frank et al., Reference Frank, Bailey, Geor, Durham and Johnson2010; Huang et al., Reference Huang, Espiritu, Uy, Holterman, Vitello and Mazzone2011; Alligier et al., Reference Alligier, Gabert, Meugnier, Lambert-Porcheron, Chansaeume, Pilleul, Debard, Sauvinet, Morio, Vidal-Puig, Vidal and Laville2013; Gustafson and Smith, Reference Gustafson and Smith2015; Moreno-Indias and Tinahones, Reference Moreno-Indias and Tinahones2015; Wensveen et al., Reference Wensveen, Valentic, Sestan, Turk-Wensveen and Polic2015). Differences have been described in the expandability of fat depots per location, sex and ethnicity (Tchkonia et al., Reference Tchkonia, Thomou, Zhu, Karagiannides, Pothoulakis, Jensen and Kirkland2013; Gustafson and Smith, Reference Gustafson and Smith2015). Men accumulate their excess fat intra-abdominally whereas women are more prone to excess fat storage in subcutaneous fat depots, like on the legs. This is considered the safest location, in terms of health repercussions, for fat accumulation in man (Tchkonia et al., Reference Tchkonia, Thomou, Zhu, Karagiannides, Pothoulakis, Jensen and Kirkland2013; Gustafson and Smith, Reference Gustafson and Smith2015). Dogs with abdominal obesity have been shown to have a higher risk of heart disease (Thenchaisri et al., Reference Thenchaisri, Theerapun, Kaewmokul and Sastravaha2014), suggesting a similar negative effect of visceral adipose tissue as in man. In our study, the predominant site of fat deposition in overfed Shetland pony mares was retroperitoneal fat; it is yet not known if this has similar negative effects as described for man and dogs. The moderate increase of the subcutaneous fat depth in the different subcutaneous regions followed by the plateau phase seems to prove the existence of a limit of adipose tissue expandability in Shetland ponies, just as in man.
Ultrasound is a noninvasive technique for accurately and reliably measuring fat deposition at a specific body site or estimating total fat accumulation (Gee et al., Reference Gee, Fennessy, Morel, Grace, Firth and Mogg2003; Dugdale et al., Reference Dugdale, Curtis, Harris and Argo2011b; Quaresma et al., Reference Quaresma, Payan-Carreira and Silva2013). It is useful in a clinical setting due to its low cost and relative simplicity (Quaresma et al., Reference Quaresma, Payan-Carreira and Silva2013; Giménez et al., Reference Giménez, de Blas Giral and Aguirre Pascasio2015). In this study there were significant differences in the control group in fat thickness over time, especially in the 1st year of measurements at the intercostal space (MP4). Although the measurements were executed by a single operator it is probable that regular use of the technique improved its accuracy. In the HE group the increase in SAT stabilized whereas BW and BCS continued to increase. This could be because of limitations in the expandability of the subcutaneous fat layers. It might also be partly due to increased pressure of the US probe as, with increasing fat tissue depth, the quality of the image decreases. The observer performing the ultrasound measurements was blinded to which diet each pony received, however it soon became clear which pony received which diet.
No hyperinsulinemia or hyperglycemia was found, based on basal glucose and insulin samples before and after the feeding period. Nevertheless, significant increases in glucose and insulin concentrations were found for the HE group in the 2nd year, indicating changes in glucose metabolism presumably associated with the increased fat deposits and BW. This finding is in agreement with the results of Frank et al. who found that basal insulin and glucose concentrations were not very sensitive markers of early insulin dysregulation in horses and changed only at advanced stages of insulin dysregulation (Frank et al., Reference Frank, Bailey, Geor, Durham and Johnson2010). The ponies used in this study were all very young (3 to 7 years). According to Frank et al. (Reference Frank, Bailey, Geor, Durham and Johnson2010) horses with equine metabolis syndrome often present clinical signs between 5 and 15 years of age. This could be a factor contributing to the relatively low insulin values found in these long-term overfed/obese ponies.
Although the number of horses used in the present study was limited to eight, the large differences between the two groups made the data powerful enough to evaluate the different parameters. Further research is necessary to evaluate which adipose tissue has the most important negative impacts on health. In conclusion, this study showed that BW, BCS and subcutaneous and retroperitoneal fat measurements are correlated both in normal weight and in obese ponies and increase during a high energy diet. Increases in adipose tissue occur in both retroperitoneal and subcutaneous deposits, with the largest increase occurring in the retroperitoneal area. The moderate increase of the subcutaneous fat depth in the different subcutaneous regions followed by the plateau phase seems to prove the existence of a limit to adipose tissue expandability in Shetland ponies, as reported in man.
Acknowledgments
The authors would like to thank Pavo for the semi-purified concentrate diet and Hans Vernooij and Jan van den Broek for their help with the statistical analysis. Funding for the project was provided by the FP7 Marie Curie International Training Network ‘EpiHealthNet’ (project number 317146). All experiments were approved by the Animal Welfare committee of the Faculty of Veterinary Medicine, Utrecht University, Utrecht, the Netherlands (ethical committee approval No. 2014.III.01.004).