I. INTRODUCTION
The efficiency and performance of thermoelectric energy conversion or cooling is related to the dimensionless figure of merit (ZT) of the thermoelectric (TE) materials, given by ZT = S2T/ρ κ, where T is the absolute temperature, S is the Seebeck coefficient or thermoelectric power, ρ is the electrical resistivity, and k is the thermal conductivity (Nolas et al., Reference Nolas, Sharp and Goldsmid2001). For high-temperature waste heat conversion applications, low-dimensional layered oxides have been found to have potential high efficiency. Examples of these oxides include “natural superlattice” oxides such as NaCo2O4 (Terasaki et al., Reference Terasaki, Sasago and Uchinokura1997), Ca3Co4O9 (Masset et al., Reference Masset, Michel, Maignan, Hervieu, Toulemonde, Studer and Raveau2000; Li et al., Reference Li, Funahashi, Matsubara, Yamada, Ueno and Sodeoka2001; Minami et al., Reference Minami, Itaka, Kawaji, Wang, Koinuma and Lippmaa2002; Grebille et al., Reference Grebille, Lambert, Bouree and Petricek2004; Otani et al., Reference Otani, Lowhorn, Schenck, Wong-Ng and Green2007; Wong-Ng et al., Reference Wong-Ng, Hu, Vaudin, He, Otani, Lowhorn and Li2007; Reference Wong-Ng, Liu, Martin, Thomas, Lowhorn and Otani2010), Bi2Sr2Co2Ox (Wang et al., Reference Wang, Venimadhav, Guo, Chen, Li, Soukiassian, Schlom, Pan, Wong-Ng, Vaudin, Cahill and Xi2009), (Bi.Pb)CuSeO (Wong-Ng et al., Reference Wong-Ng, Yan, Kaduk and Tang2016), and (Bi.A)CuSeO (A = Ba, Sr, and Ca) (Wong-Ng et al., Reference Wong-Ng, Yan, Kaduk and Tang2017). The search for oxide compounds with superior thermoelectric properties continues.
Perovskite materials such as La1−xA xCoO3 (A = Ca, Sr) (Sehlin et al., Reference Sehlin, Anderson and Sparlin1995; Wang et al., Reference Wang, Sui, Ren, Wang, Wang, Su and And Fan2010) and RCoO3 (Moon et al., Reference Moon, Masuda, Seo and Koumoto2001) have demonstrated large Seebeck coefficient and low resistivity. These compounds have been reported to have long-range magnetic ordering at low temperature, and is frustrated by the geometry of the crystalline lattice, a situation known as geometrical magnetic frustration (Henmi and Hinatsu, Reference Henmi and Hinatsu1999; Karunadasa et al., Reference Karunadasa, Huang, Ueland, Schiffer and Cava2003). Besides cobaltates, niobate compounds such as (Sr.Ba)6Nb10O30 have also been reported to possess good thermoelectric properties (Chan et al., Reference Chan, Bock, Guo, Trolier-McKinstry and Randall2017).
Sr2RNbO6 is a series of double-perovskite niobates that have potential for thermoelectric applications as well. Since X-ray diffraction is a non-destructive technique for phase identification, X-ray diffraction patterns are especially important for phase characterization. Therefore, the main goal of this investigation is to determine the crystal structure, crystal chemistry, and experimental powder X-ray diffraction patterns for the niobate series Sr2RNbO6 (R = Sm, Gd, Dy, Ho, Y, Tm, and Lu), and to make these patterns available in the Powder Diffraction File (PDF) (McMurdie et al., Reference McMurdie, Morris, Evans, Paretzkin, Wong-Ng, Ettlinger and Hubbard1986; Wong-Ng et al., Reference Wong-Ng, McMurdie, Hubbard and Mighell2001; PDF 2018).
II. EXPERIMENTAL DETAILS
A. Sample preparation
Samples were prepared in two groups (R = Gd, Ho, and Lu as the first group and R = Sm, Dy, Y, and Tm as the second group). All samples were prepared by heating a stoichiometric mixture of SrCO3, R 2O3, and Nb2O5 in air. Sm2O3 was first heat-treated at 550 °C overnight prior to use to ensure the absence of carbonates and hydroxides. Samples were weighed out, well-mixed and calcined overnight at 750 °C, 950 °C for 2 days, 1200 °C for 2 days, and finally at 1250 °C for another 2 days, with intermediate grindings. During each heat treatment, the samples were furnace cooled. The phase purity of the samples was established by powder X-ray diffraction. Patterns were taken at 300 K.
B. X-ray Rietveld refinements and powder reference patterns
For R = Gd, Ho, and Lu, powder patterns were collected from rotated 0.7 mm capillary specimens at the MR-CAT 11-ID beamline at the Advanced Photon Source (APS) at the Argonne National Laboratory, using a wavelength of 0.49516 Å. High-resolution synchrotron X-ray powder diffraction data were collected using beamline 11-BM at the APS, Argonne National Laboratory. Discrete detectors covered a final angular range from 0 to 50°, with data points collected every 0.001° in 2θ at a scan speed of 0.01° s–1. The instrumental optics of 11-BM incorporate two platinum-striped mirrors and a double-crystal Si (111) monochromator, where the second crystal has an adjustable sagittal bend (Wang et al., Reference Wang, Toby, Lee, Ribaud, Antao, Kurtz, Ramanathan, Von Dreele and Beno2008). The diffractometer is controlled via EPICS (Dalesio et al., Reference Dalesio, Hill, Kraimer, Lewis, Murray, Hunt, Watson, Clausen and Dalesio1994). A vertical Huber 480 goniometer positions 12 perfect Si (111) analyzers and 12 Oxford-Danfysik LaCl3 scintillators, with a spacing of 2° in 2θ (Lee et al., Reference Lee, Shu, Ramanathan, Preissner, Wang, Beno, Von Dreele, Ribaud, Kurtz, Antao, Jiao and Toby2008). Capillary samples are mounted by a robotic arm and spun at ≈90 Hz. Data are normalized to incident flux and collected while continually scanning the diffractometer 2θ arm. A mixture of National Institute of Standard and Technology standard reference materials, Si (SRM™ 640c) and Al2O3 (SRM™ 676), is used to calibrate the instrument, where the Si lattice constant determines the wavelength for each detector. Corrections are applied for detector sensitivity, 2θ offset, and small detector wavelength differences, before merging the data into a single set of intensities evenly spaced in 2θ. For R = Sm, Dy, Y, and Tm, the Sr2RNbO6 patterns were measured from flat plate specimens using CuKα radiation on a Scintag PAD V diffractometer equipped with an Ortec intrinsic Ge detector.
The Rietveld refinement technique (Rietveld, Reference Rietveld1969; Larson and von Dreele, Reference Larson and von Dreele2004) with the software suite GSAS (Larson and Von Dreele, Reference Larson and von Dreele2004) was used to determine the structure of Sr2RNbO6. The structure of the Sr2EuNbO6 phase (PDF 4-18-9033) (Huang et al., Reference Huang, Yan, Tien and Chen1991; PDF, 2018) was used as a model for refinement. Reference patterns were obtained with a Rietveld pattern decomposition technique. Using this technique, the reported peak positions were derived from the extracted integrated intensities, and positions calculated from the lattice parameters. When peaks are not resolved at the resolution function, the intensities are summed, and an intensity-weighted d-spacing is reported. They are also corrected for systematic errors both in d-spacing and intensity. In summary, these patterns represent ideal specimen patterns.
C. Bond valence sum (V b) calculations
The bond valence sum values, V b, for Sr, R, and Nb were calculated using the Brown–Altermatt empirical expression (Shannon, Reference Shannon1976; Brese and O'Keeffe, Reference Brese and O'Keeffe1991; Brown and Altermatt, Reference Brown and Altermatt1985), and the results are also listed in Table III. The V b of an atom i is defined as the sum of the bond valences v ij of all the bonds from atoms i to atoms j. The most commonly adopted empirical expression for the bond valence v ij as a function of the interatomic distance d ij is v ij = exp[(R 0–d ij)/B]. The parameter, B, is commonly taken to be a “universal” constant equal to 0.37 Å. The values for the reference distance, R 0: Sr–O 2.118, Nb–O 1.911, Sm–O 2.088, Gd–O 2.065, Dy–O 2.036, Ho–O 2.023, Y–O 2.014, Tm–O 2.000, Lu–O 1.971 (Brown and Altermatt, Reference Brown and Altermatt1985).
III. RESULTS AND DISCUSSION
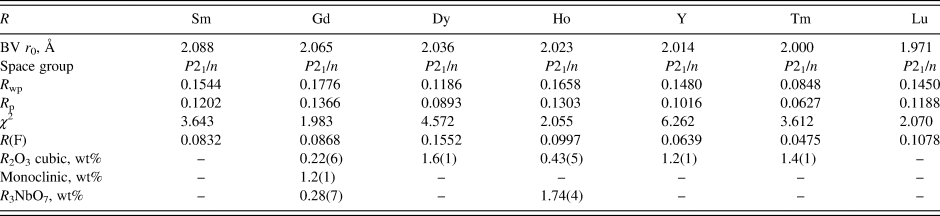
The structural details are summarized in Table I and in the supported information (cif files). The trends in lattice parameters (Table I) show that the seven Sr2RNbO6 compounds are isostructural, and crystallized in a distorted Ö2a × Ö2a × 2a perovskite superstructure, with a space group of P21/n.
Results of Rietveld refinements for Sr2RNbO6 (R = Sm, Gd, Dy, Ho, Y, Tm, and Lu).

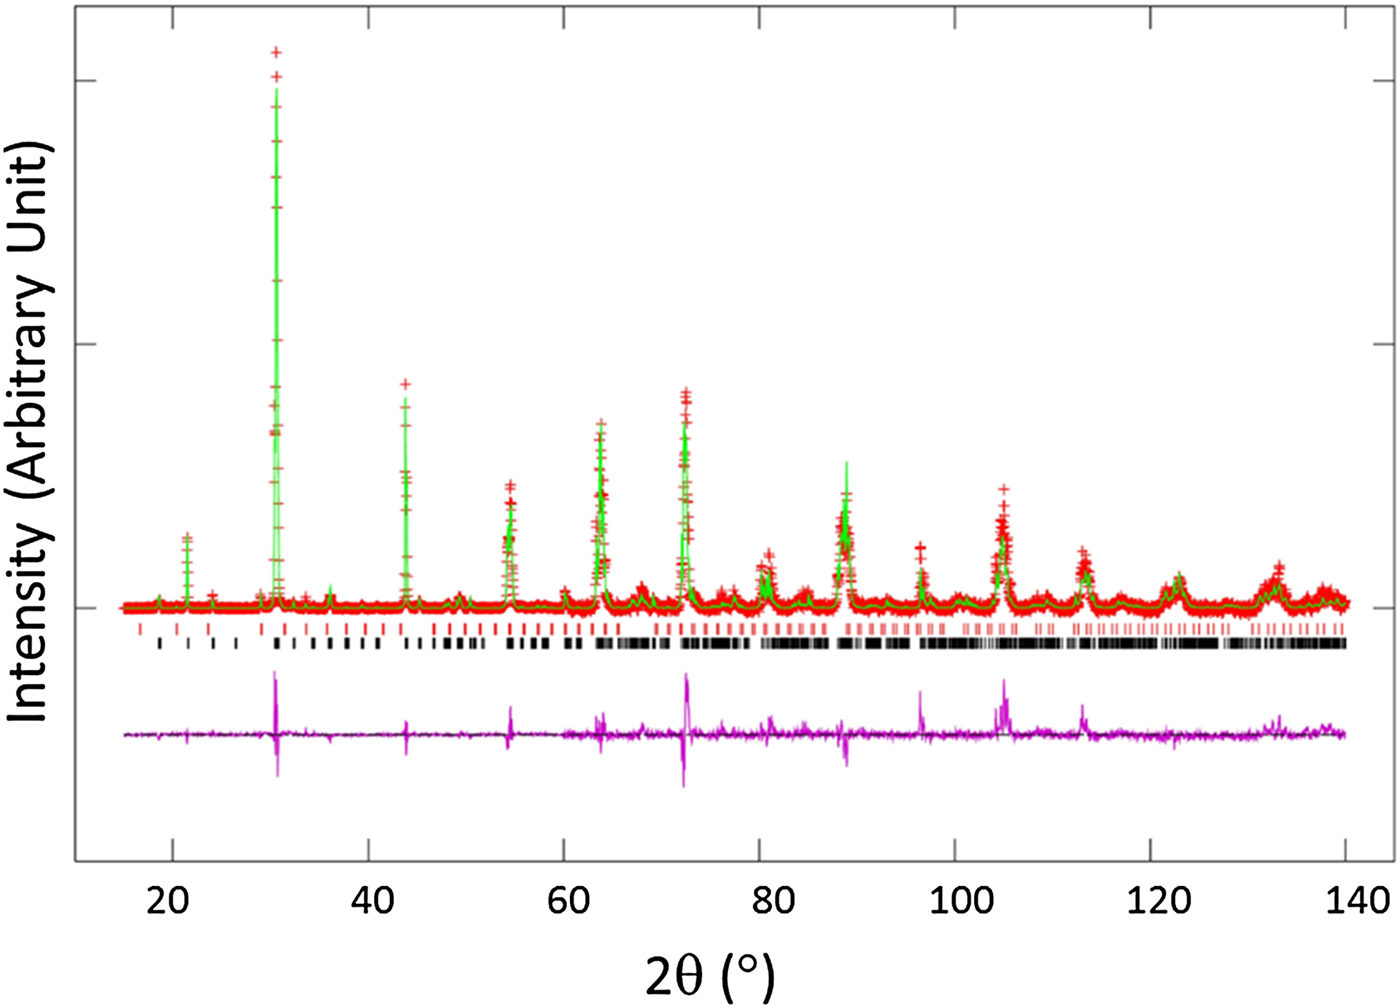
Table I also gives the refinement residuals for Sr2RNbO6 (R = Sm, Gd, Dy, Ho, Y, Tm, and Lu). Figure 1 provides the Rietveld refinement results for Sr2DyNbO6 as an example. The observed (crosses), calculated (solid line), and difference XRD patterns (bottom) for Sr2LuNbO6, as determined by the Rietveld analysis technique, are shown. The difference pattern is plotted at the same scale as the other patterns up to 60° 2θ. At higher 2θ angles, the scale has been magnified five times. The row of tick marks refers to the calculated peak positions. The refinement residuals mainly reflect variations in the counting times, and the presence of traces of additional impurities.
Observed (crosses), calculated (solid line), and difference XRD pattern (bottom) for Sr2DyNbO6 by Rietveld analysis technique. The observed data are indicated by crosses and the calculated profile is the solid line. The vertical lines below the profiles mark the positions of all possible Bragg reflections. The difference pattern is plotted at the same scale as the other calculated peak position.

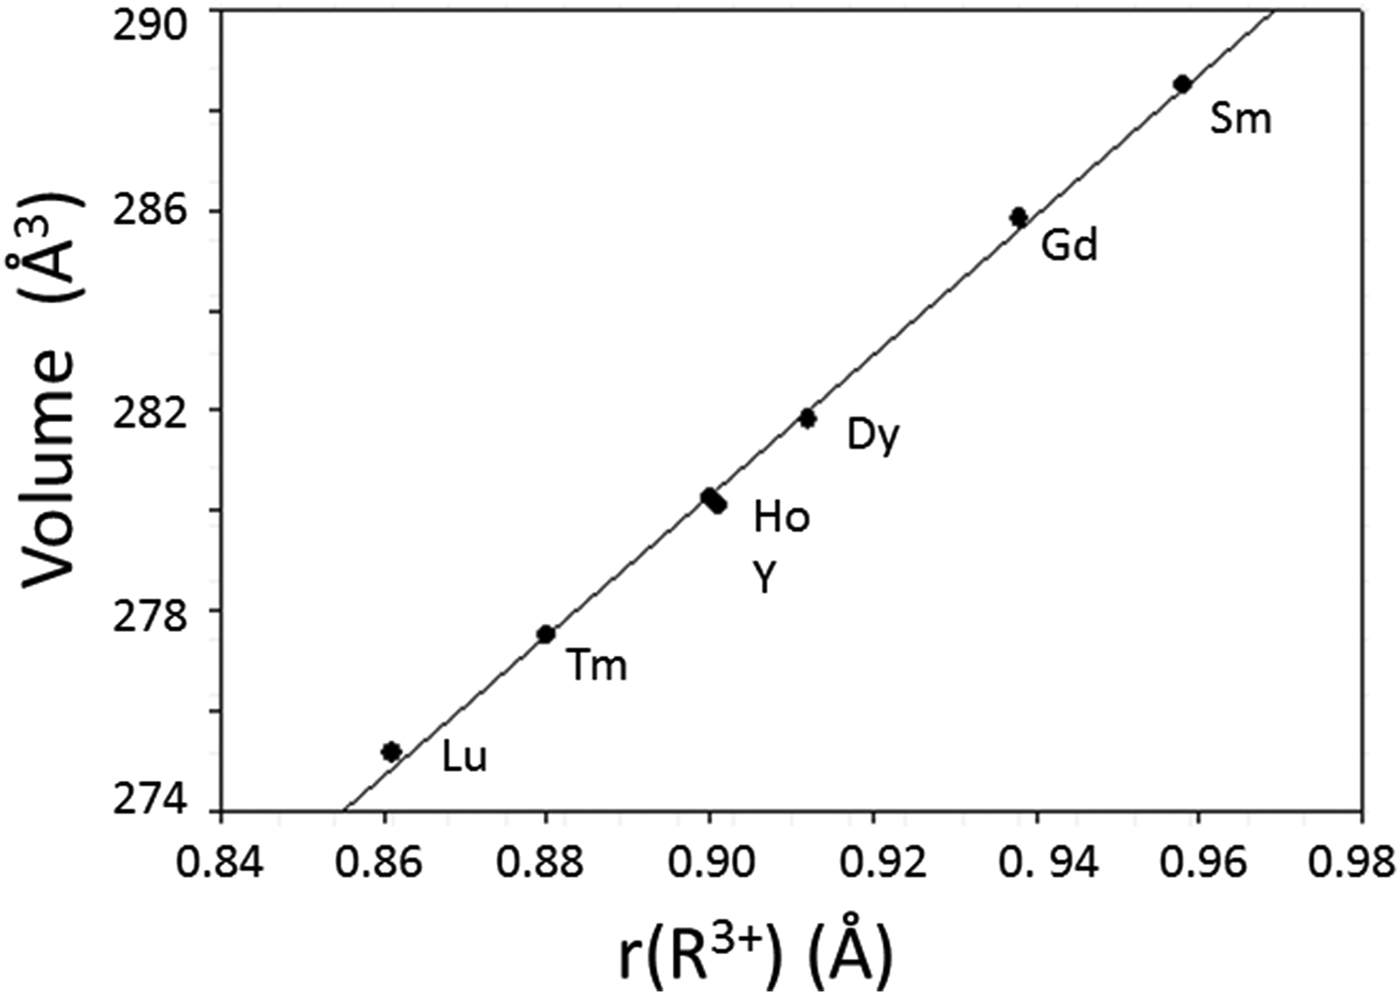
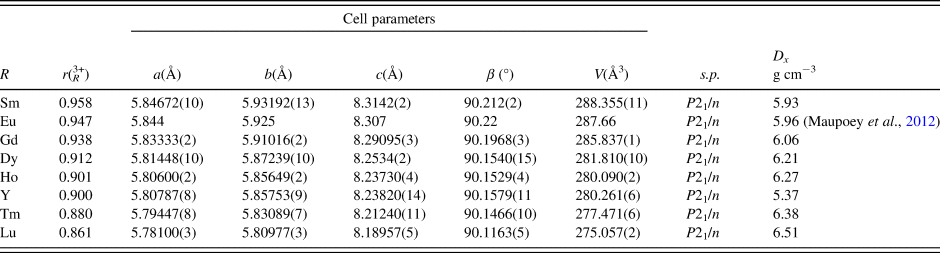
It is noted that the structure of larger size lanthanide members Sr2LaNbO6 (Trunov et al., Reference Trunov, Sirotinkin and Evdokimov1983; Huang et al., Reference Huang, Yan, Tien and Chen1991) and Sr2PrNbO6 (Trunov et al., Reference Trunov, Sirotinkin and Evdokimov1983) is cubic with space group Fm-3m. The structure transition from cubic to monoclinic P21/n for the smaller size Sr2RSbO6. Table II lists the lattice parameters and calculated density, D x, for the P21/c Sr2RSbO6. It is seen that the lattice parameters a, b, and c for the monoclinic structures all decrease from R = Sm to Lu [5.84672(10) to 5.78100(3) Å, b from 5.93192(13) to 5.80977(3) Å, c from 8.3142(2) to 8.18957(5) Å, and V decreases from 288.355(11) to 275.057(2) Å3], following the trend of “lanthanide contraction”. The calculated density values, D x, increases as the size of R decreases (5.927–6.508 g cm–3). Figure 2 gives the plot of the unit-cell volumes, V, of Sr2RNbO6 vs. Shannon ionic radius of R 3+ (r R). The unit-cell volume decreases across the lanthanide series from Sm to Lu, or with the decreasing size of the ionic radius (Shannon, Reference Shannon1976) (lanthanide contraction) of the metal ion at the octahedral site. This decreasing volume is a result of the decrease in all the a, b, and c parameters.
Plot of unit-cell volume of Sr2RNbO6 (R = Sm, Gd, Dy, Ho, Y, Tm, Yb, and Lu vs. r(R 3+) [where “r” is the Shannon ionic radii (1976)], space group P21/n.

Crystallographic data for Sr2RNbO6 (space group: P21/n) for R = Sm, Gd, Dy, Ho, Y, Tm, and Lu; r(R3+) is the Shannon ionic radius (1976) using VI coordination.

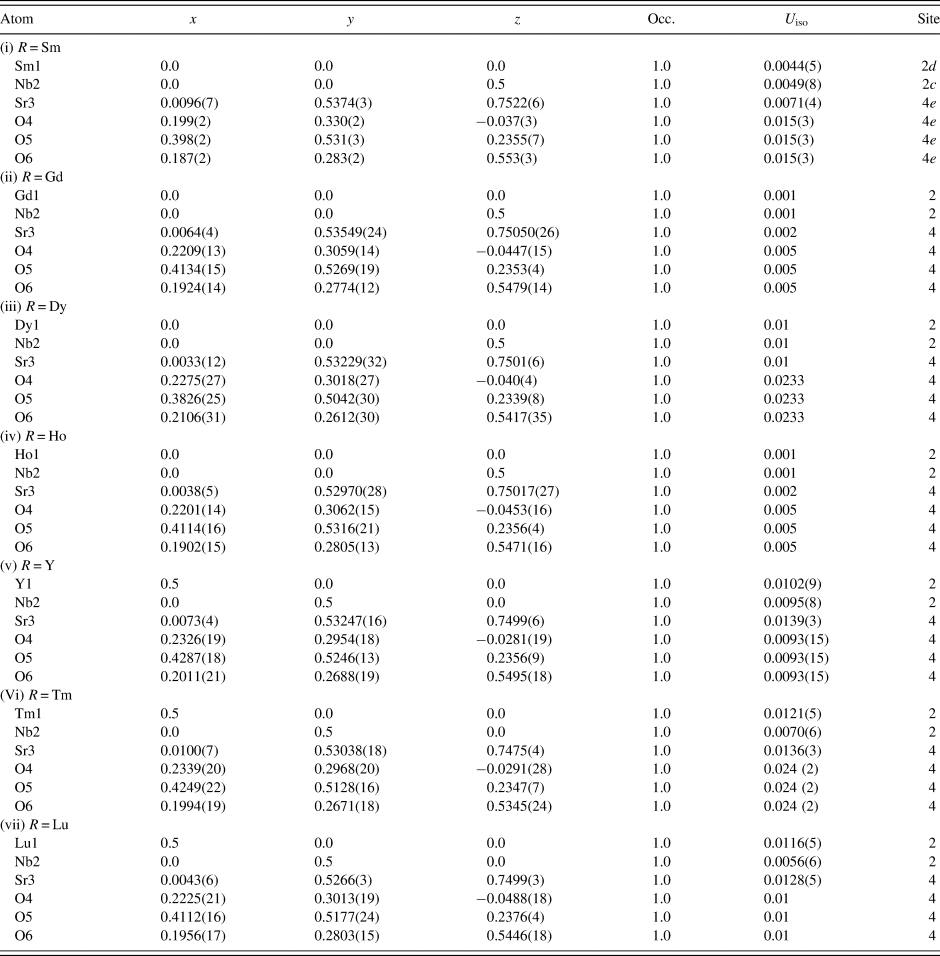
The atomic coordinates, displacement parameters for the structures of Sr2RNbO6 are given in Table III. The trivalent lanthanides and pentavalent antimony are found to be fully ordered in the double-perovskite arrangement of alternating octahedra sharing corner oxygens. Our results show agreement with the observation by Karunadasa et al. (Reference Karunadasa, Huang, Ueland, Schiffer and Cava2003) in which the R 3+ and Nb5+ are fully ordered in the double-perovskite structures, except for the R = Nd phase. The structure consists of corner-sharing alternate NbO6 and RO6 units in the form the zig-zag chains along the c-axis. Sr in general has a 12-coordination environment.
Atomic coordinates and isotropic displacement factors for Sr2RNbO6 (R = Sm, Gd, Dy, Ho, Y, Tm, and Lu). Values inside brackets are standard deviations (space group: monoclinic P21/n).

Table IV gives the bond distances of Sr–O, R–O, and Nb–O, and bond valence sum values (V b) of the cation sites. From R = Sm to R = Lu, Nb atoms in the octahedral sites, the V b values for the Nb sites are mostly <5.0 (except for R = Tm with a value of 5.17) and in general increases as the size of R 3+ decreases. The <5.0 value indicates the sites are under tensile stress, or the cages too large. The V b values for the Sr site in the Sr2LnSbO6 series are all around 2.0 (from 1.8 to 2.1). Note that V b values for all R sites are significantly >3.0 (except for the R = Tm compound), representing a large compressive stress or overbonding for the R sites (cages too small).
Interatomic distances and bond valence sums (V b) for Sr2RNbO6. Values inside brackets are standard deviations. The bond valence values, r 0 (Å) are 2.088 (Sm), 2.065 (Gd), 2.036 (Dy), 2.023 (Ho), 2.014 (Y), 2.000 (Tm), 1.971 (Lu), 2.118 (Sr), and 1.911 (Nb).

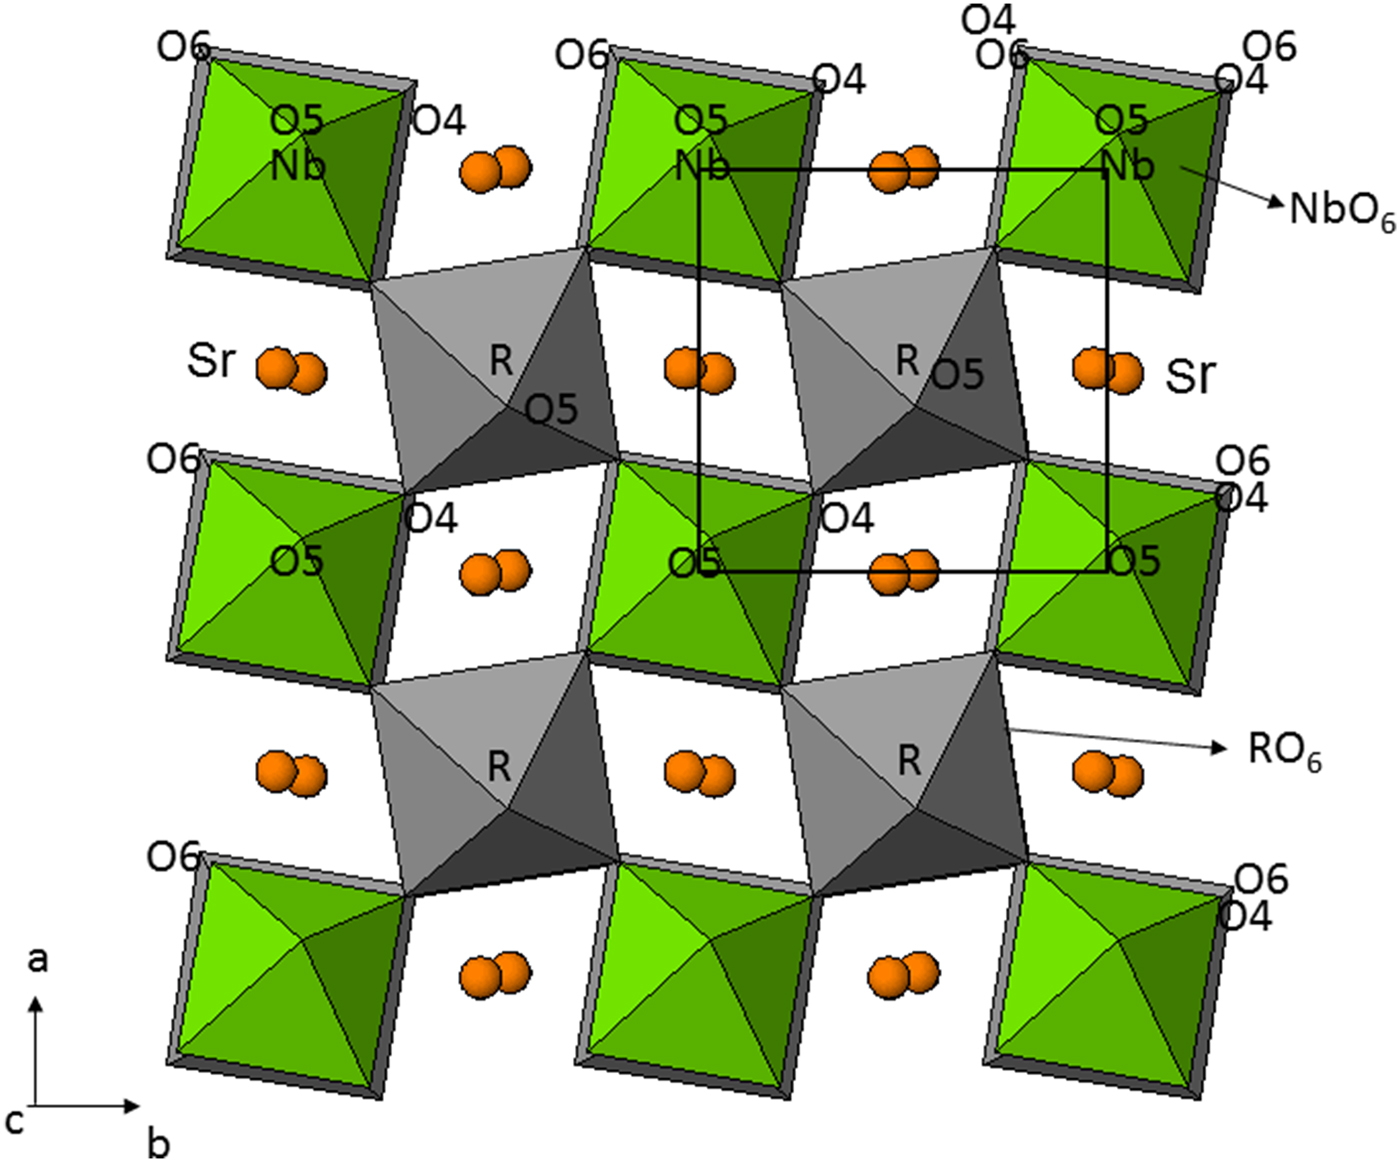
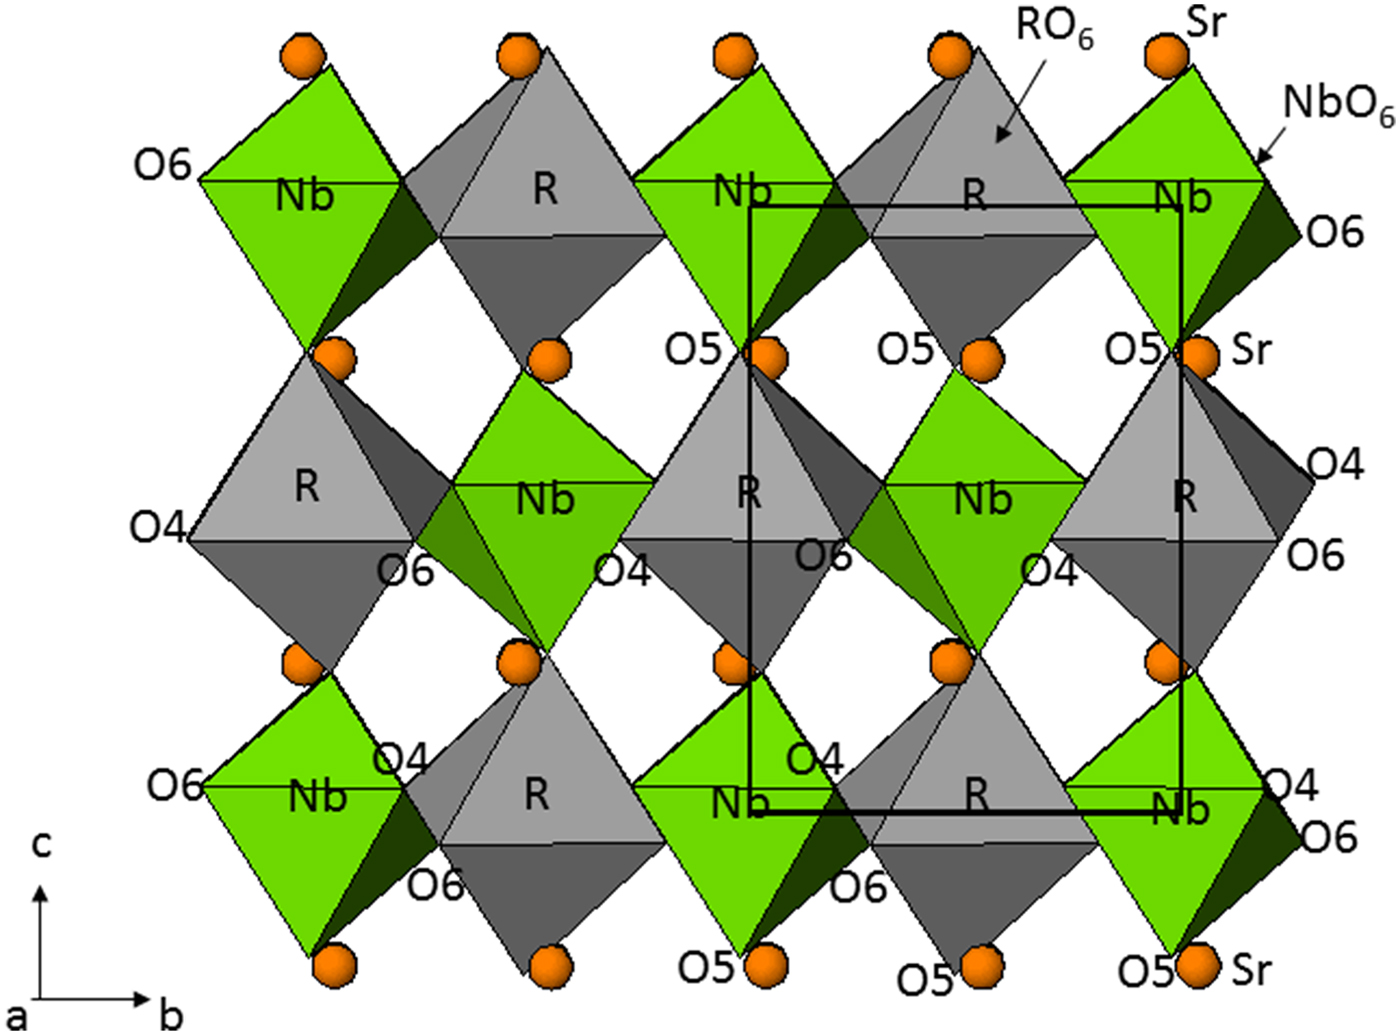
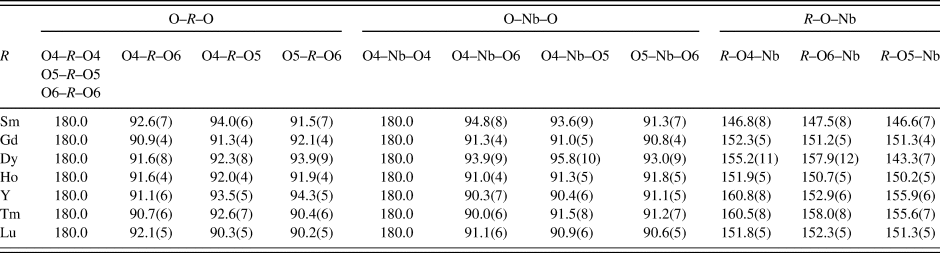
In the monoclinic Sr2RNbO6 series, there are three R–O–Nb angles (R–O4–Nb, R–O5–Nb, and R–O6–Nb) that are between different NbO6 and RO6 octahedral units (Table V). While the R–O6–Nb angle is a measure for the deviation from the ideal value of 180° along the c-axis, the R–O4–Nb and R–O5–Nb angle bending are related to the rotation of the octahedra with respect to the ab plane (Figures 3 and 4). These R–O–Nb angles all deviate rather significantly from 180° (approximately between 147 and 161°). The R–O4–Nb angles range from 146 to 161°; the R–O5–Nb angles range from 148 to 158°; R–O6–Nb angles range from 147 to 156°. One also notes that the R and Nb sites in the NbO6 and RO6 octahedra also have distorted environment, as evidenced from different R–O and Nb–O distances (Table IV), and different O–R–O and O–Nb–O bond angles (Table V). While the O4–R–O4 and O4–Nb–O4 angles are 180°, the remaining O–R–O and O–Nb–O angles all deviate from 90°.
Crystal structure of Sr2DyNbO6 at room temperature showing the unit-cell outline and the top view (viewing along c) of B-site octahedra.

Crystal structure of Sr2DyNbO6 at room temperature showing the unit-cell outline and the view along a.

Selected bond angles (°) for Sr2RNbO6. Values inside brackets are standard deviations.

A. Reference X-ray diffraction pattern
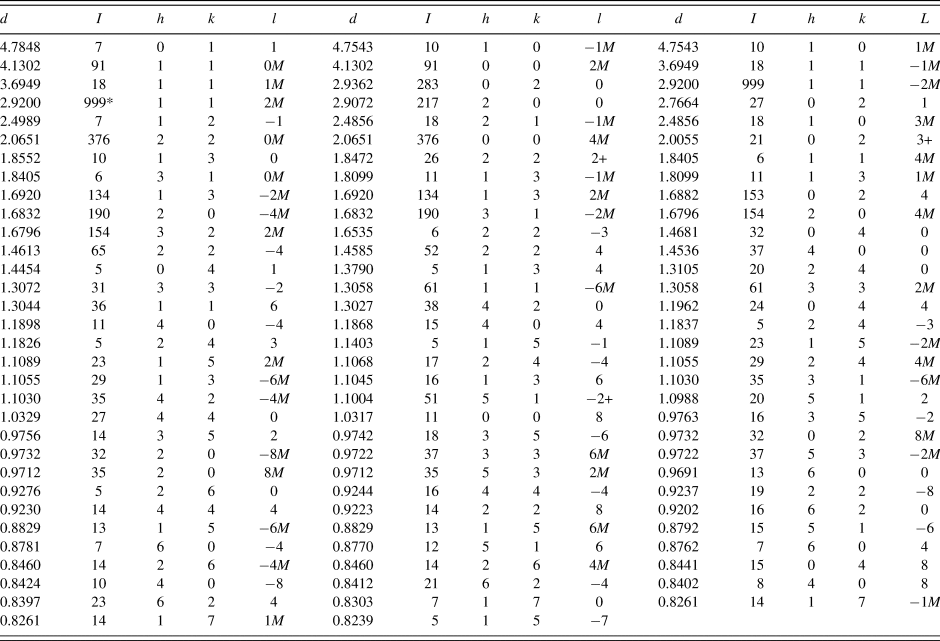
The powder X-ray diffraction pattern of Sr2DyNbO6 is given in Table VI as an example. In this pattern, the symbols “M” and “ + ” refer to peaks containing contributions from two and more than two reflections, respectively. The peak that has the strongest intensity in the entire pattern is assigned an intensity of 999 and other lines are scaled relative to this value. In general, the d-spacing values are calculated values from refined lattice parameters. The intensity values reported are integrated intensities (rather than peak heights) based on the corresponding profile parameters. For resolved overlapped peaks, intensity-weighted calculated d-spacing, along with the observed integrated intensity and the hkl indices of both peaks (for “M”), or the hkl indices of the strongest peak (for “ + ”) are used. For peaks that are not resolved at the instrumental resolution, the intensity-weighted average d-spacing and the summed integrated intensity value are used. In the case of a cluster, unconstrained profile fits often reveal the presence of multiple peaks, even when they are closer than the instrumental resolution. In this situation, both d-spacing and intensity values are reported independently. The reference patterns for Sr2RNbO6 have been submitted for inclusion in the PDF: Sr2SmNbO6 (00-063-0698); Sr2GdNbO6 (00-062-0323); Sr2DyNbO6 (00-062-0325); Sr2HoNbO6 (00-062-0324); Sr2YNbO6 (00-062-0297); Sr2TmNbO6 (00-062-0326); Sr2LuNbO6 (00-062-0300).
X-ray powder pattern for Sr2DyNbO6, P21/n, a = 5.81448(10) Å, b = 5.87239(10) Å, c = 8.2534(2) Å, β = 90.154(2)°. The symbols “M” and “+” refer to peaks containing contributions from two and more than two reflections, respectively.

The symbol * indicates the particular peak has the strongest intensity of the entire pattern and is designated a value of “999”.
IV. SUMMARY
Crystal structure and reference patterns of the double perovskites Sr2RNbO6 (R = Sm, Gd, Dy, Ho, Y, Tm, and Lu) series have been determined and published as part of the PDF. Among the series, the literature reported that the phase of R = La (cubic) and R = Pr (cubic) is different from the rest of the lanthanide members with smaller size of R. Sr2RNbO6 (R = Sm, Gd, Dy, Ho, Y, Tm, and Lu) adopt the monoclinic P21/n space group. The structure consists of corner-sharing alternate NbO6 and RO6 units in the form of the zig-zag chains along the c-axis. Sr in general has a 12-coordination environment. The deviation from ideal perovskite geometry has been discussed. Bond valence sum calculations indicated that all Nb adopt 5+ valence state in these compounds, except with large tensile stress (V b values mostly <5 except for the R = Tm member). Compressive stress has been found at the R 3+ site throughout the series (V b ranges from 3.2 to 3.6).
SUPPLEMENTARY MATERIAL
The supplementary material for this article can be found at https://doi.org/10.1017/S0885715618000593
ACKNOWLEDGEMENTS
Use of the Advanced Photon Source at Argonne National Laboratory was supported by the US Department of Energy, Office of Science, Office of Basic Energy Sciences, under Contract No. DE-AC02-06CH11357. The authors acknowledge the partial financial support from the ICDD Grants-in-Aid Program.