INTRODUCTION
Many studies have been conducted concerning rumen ecology and have reported possible approaches to increase rumen fermentation efficiency (Wora-anu et al. Reference Wora-anu, Wanapat, Wachirapakorn and Nontaso2007). A number of experiments have dealt with ruminants raised in temperate areas and fed on good quality roughage with high levels of concentrate supplementation (Wanapat Reference Wanapat2000). Ruminants raised in the tropics mostly depend on seasonal feed resources that are relatively low in nutritive value with high levels of structural carbohydrate and low levels of crude protein (CP) (Nguyen et al. Reference Nguyen, Wanapat, Khejornsart and Kongmun2012; Wanapat et al. Reference Wanapat, Pilajun, Kang, Setyaningsih and Setyawan2012). Rice straw is abundantly available from cultivated rice and farmers typically store it for use as ruminant feed (Cherdthong et al. Reference Cherdthong, Wanapat and Wachirapakorn2011). Hence, feeding rice straw with a concentrate mixture containing a high density of energy and protein would be potentially useful in order to increase its utilization (Wanapat Reference Wanapat1999).
The rumen has an important role and function in producing fermentation end-products for the biosynthetic processes of ruminants. It is essential that the rumen is healthy and able to establish an optimum environment in order to perform well with regard to rumen pH, microorganisms, substrates, fermentation end-products and microbial synthesis of volatile fatty acids (VFA) and protein (Wanapat Reference Wanapat2000). In ruminants fed temperate feeds, it has been shown that a diet comprising >0·60 concentrate dramatically decreased rumen pH and subsequently resulted in rumen acidosis (Slyter Reference Slyter1976; Brown et al. Reference Brown, Ponce and Pulikanti2006). Rumen pH was mostly affected by type of feed and roughage to concentrate ratio (R : C ratio), which consequently affected saliva secretion, rumination, VFA production and microbial population. In addition, a decrease in ruminal fibre digestion is caused by inhibiting the growth of cellulolytic bacteria when ruminal pH decreases to <6·0 (Stewart Reference Stewart1977; Slyter Reference Slyter1986).
Increasing the level of roughage in the diet could improve the cellulolytic bacterial population in the rumen. Fibrobacter succinogenes, Ruminococcus flavefaciens and R. albus are the most active cellulolytic bacterial species (Dehority Reference Dehority, Jung, Buxton, Hatfield and Ralph1993). Furthermore, Butyrivibrio fibrisolvens is another important species in the rumen population, particularly in animals fed on high roughage diets (Latham et al. Reference Latham, Sharpe and Sutton1971). In contrast, when concentrate is increased to >0·60 in the diet, Megasphaera elsdenii, a lactate-utilizing bacterium and producer of trans-10, cis-12 CLA, has been found to increase as the result of decreasing ruminal pH (Brown et al. Reference Brown, Ponce and Pulikanti2006). Therefore, the objective of the current experiment was to investigate the effect of the R : C ratio, using rice straw as basal roughage, on rumen pH, fermentation and microbial population in dairy-steer crossbreeds.
MATERIALS AND METHODS
Animals, treatments and experimental design
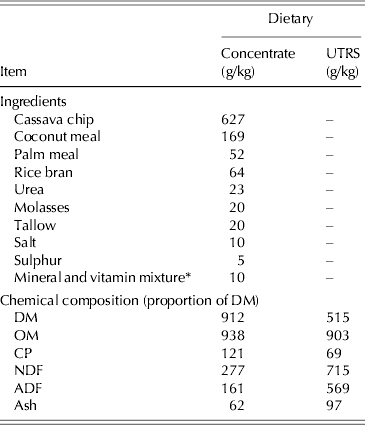
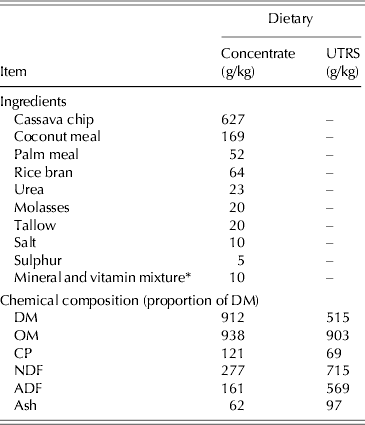
Four rumen-fistulated crossbred dairy steers (initial body weight (BW) of 170±20 kg, 16 months old) were randomly assigned to receive four ratios of R : C at 0·8 : 0·2, 0·6 : 0·4, 0·4 : 0·6 and 0·2 : 0·8 according to a 4×4 Latin square design. All steers received the diet according to respective R : C ratios at 0·025 of BW/d. Urea-treated (0·035) rice straw was used as a roughage source. Steers were housed individually and fed the experimental diets twice daily at 08·00 and 16·00 h. Clean fresh water and mineral blocks were available ad libitum. The experiment was conducted over four periods, each lasting for 21 days: the first 14 days were used for feed intake measurements and the remaining 7 days for total urine and faecal collection. Chemical compositions of concentrate and urea-treated rice straw are presented in Table 1. Urea-treated rice straw was prepared using 3·5 kg urea+100 kg water sprayed onto 100 kg of rice straw, which was then covered for 10 days before feeding directly to the animals (Wanapat et al. Reference Wanapat, Polyorach, Boonnop, Mapato and Cherdthong2009).
Ingredients and chemical composition of concentrate and urea-treated rice straw
UTRS: urea-treated rice straw.
* Each kg contains: vitamin A: 10 000 000 IU; vitamin E: 70 000 IU; vitamin D: 1 600 000 IU; Fe: 50 g; Zn: 40 g; Mn: 40 g; Co: 0·1 g; Cu: 10 g; Se: 0·1 g; I: 0·5 g.
Data collection and sampling procedures
Feeds were sampled and faecal samples were collected from the total collection of each individual steer on each treatment during the last 7 days of each period at the morning and afternoon feeding. Feed, refusals and faecal samples were dried at 60 °C, ground (1 mm screen using a Cyclotech Mill, Tecator) and analysed using the standard methods of AOAC (1995) for dry matter (DM), CP and ash, while neutral detergent fibre (NDF) and acid detergent fibre (ADF) were analysed according to Van Soest et al. (Reference Van Soest, Robertson and Lewis1991). Urinary samples were analysed for allantoin determined by high-performance liquid chromatography (HPLC) as described by Chen & Gomes (Reference Chen and Gomes1995).
At the end of each period, rumen fluid was collected at 0, 2, 4 and 6 h post-feeding. Approximately 200 ml of rumen fluid was collected at each time from the middle part of the rumen using a 60 ml hand syringe and pH was measured immediately using a portable pH meter (HANNA Instruments HI 8424 microcomputer, Singapore). Rumen fluid samples were then filtered through four layers of cheesecloth and divided into four portions. The first portion used for ammonia nitrogen (NH3-N) analysis, comprised 5 ml of 1 m H2SO4 and 50 ml of rumen fluid. It was centrifuged at 16 000 g for 15 min and the supernatant stored at −20 °C. Ruminal NH3-N concentrations were analysed using a Kjeltech Auto 1030 Analyzer (Bremmer & Keeney Reference Bremmer and Keeney1965) and VFA analysis was performed using HPLC (Samuel et al. Reference Samuel, Sagathewan, Thomus and Mathen1997). A second portion was fixed with 10% formalin solution in sterilized 0·9% saline solution. The total direct count of protozoa and fungal zoospores were made by the methods of Galyean (Reference Galyean1989) based on the use of a haemocytometer (Boeco, Hamburg, Germany). The third portion was used to culture groups of bacteria using a roll-tube technique (Hungate Reference Hungate, Norris and Ribbons1969) for identifying bacterial groups (cellulolytic, proteolytic, amylolytic and total viable count bacteria). The final portion was stored at −20 °C for DNA extraction.
A blood sample (c. 10 ml) was collected from the jugular vein at the same time as rumen fluid sampling into tubes containing 12 mg of ethylenediaminetetraacetic acid (EDTA), and plasma was separated by centrifugation at 500 g for 10 min at 4 °C and stored at −20 °C until analysis of blood urea nitrogen (BUN) according to Crocker (Reference Crocker1967).
Extraction of genomic DNA and real-time polymerase chain reaction (PCR)
Community DNA was extracted from 0·5 g of rumen content (fluid and digesta) by the repeated bead beating plus column (RBB+C) method (Yu & Morrison Reference Yu and Morrison2004). In brief, the RBB+C method employs two rounds of bead beating in the presence of sodium chloride (NaCl) and sodium dodecyl sulphate (SDS), followed by sequential ammonium acetate and isopropanal precipitations. The precipitated nucleic acids were then treated with RNase A and proteinase K, and the DNA was purified using columns from QIAGEN DNA Mini Kit (QIAGEN, Valencia, CA, USA), according to manufacturer's recommendations.
The targeted bacteria were total bacteria, the three predominant cellulolytic bacteria (F. succinogenes, R. flavefaciens and R. albus), B. fibrisolvens and M. elsdenii. The forward and reverse primers for total bacteria were 5′-CGG CAA CGA GCG CAA CCC-3′ and 5′-CCA TTG TAG CAC GTG TGT AGC C-3′, respectively. Those for F. succinogenes were 5′-GTT CGG AAT TAC TGG GCG TAA A-3′ and 5′-CGC CTG CCC CTG AAC TAT C-3′, respectively, and finally those for R. flavefaciens were 5′-CGA ACG GAG ATA ATT TGA GTT TAC TTA GG-3′ and 5′-CGG TCT CTG TAT GTT ATG AGG TAT TAC C-3′, respectively. All these primer sets were employed as described by Makkar & McSweeney (Reference Makkar and McSweeney2005). For R. albus primers, Ra1281f (5′-CCC TAA AAG CAG TCT TAG TTC G-3′) and Ra1439r (5′-CCT CCT TGC GGT TAG AAC A-3′) were employed as described by Koike & Kobayashi (Reference Koike and Kobayashi2001). For B. fibrisolvens primer, forward primers (5′-TAA CAT GAG AGT TTG ATC CTG GCT C-3′) and reverse primers (5′-CGT TAC TCA CCC GTC CGC-3′) were employed as described by Yang et al. (Reference Yang, Bu, Wang, Hu, Li, Wei, Zhou and Loor2009). For M. elsdenii, YJ-4 primers have been deposited in GenBank under accession number AY038996: forward primers were (5′-AAG GAG GGG CTT CGT CT-3′) and reverse primers (5′-GCC GTG TCT CAG TCC CAA TG-3′).
The conditions of the real-time PCR assays were as follows: for F. succinogenes, R. flavefaciens and total bacteria: 2 min at 50 °C for denaturation, 2 min at 95 °C for denaturing, 15 s at 95 °C for annealing and 1 min at 60 °C for extension (40 cycles) and a final extension period of 5 min at 72 °C; for R. albus: 9 min at 94 °C for denaturation, 30 s at 94 °C for denaturing, 30 s at 55 °C for annealing and 30 s at 72 °C for extension (40 cycles) and a final extension period of 10 min at 72 °C; for B. fibrisolvens: 9 min at 94 °C for denaturation, 30 s at 94 °C for denaturing, 30 s at 57 °C for annealing, 30 s at 72 °C for extension (40 cycle) and a final extension period of 5 min at 72 °C; and for M. elsdenii: 9 min at 94 °C for denaturation, 30 s at 94 °C for denaturing, 30 s at 57 °C for annealing, 30 s at 72 °C for extension (48 cycle) and a final extension period of 10 min at 72 °C. Seven sample-derived standards were prepared from the treatment pool set of community DNA. The regular PCR was used to generate sample-derived DNA standards for each real-time PCR assay. Then the PCR product was purified using a QIA quick PCR purification kit (QIAGEN, Inc., Valencia, CA) and quantified using a spectrophotometer. For each sample-derived standard, copy number concentration was calculated based on the length of the PCR product and the mass concentration. The target DNA was quantified by using serial 10-fold dilutions from 101 to 108 DNA copies of the previously quantified DNA standards.
Real-time PCR amplification and detection were performed in a Chromo 4™ system (Bio-Rad, USA). In brief, Biostools QuantiMix Easy SYG Kit was used for PCR amplification and samples were assayed in duplicate in a 20 μl reaction mixture containing 4–6 mm MgCl2, 10 μl of Mastermix (including; Taq DNA polymerase, reaction buffer, dNTP mixture, MgCl2 and SybrGreen), 2 μl of DNA template and 0·8 μl of each primer (10 μmol/μl).
Calculations and statistical analyses
The estimated energy intake was calculated from 1 kg of digestible organic matter (DOM)=15·9 MJ ME/kg (Kearl Reference Kearl1982). Methane (CH4) gas production was calculated by standard equations according to CH4=0·45(acetate)−0·275(propionate)+0·40(butyrate) (Moss et al. Reference Moss, Jouany and Newbold2000). The amount of microbial purines absorbed was calculated from purine derivative (PD) excretion based on the relationship derived by Chen & Gomes (Reference Chen and Gomes1995). The amount of microbial CP in g/d was calculated according to the following equation: microbial CP (g/d)=3·99×0·856×mmol PD excreted (Galo et al. Reference Galo, Emanuele, Sniffen, White and Knapp2003). The efficiency of microbial N synthesis (EMNS) was expressed as g microbial N/kg DOM apparently fermented in the rumen (DOMR). The DOMR was estimated as: DOMR=0·65×DOM intake where 0·65 assuming that 0·65 of DOM was fermented in the rumen (ARC 1990).
Data were analysed as a 4×4 Latin square design using the PROC MIXED procedure of SAS (1996). Data were analysed using the model Y ijk=μ +M i+Aj+Pk+εijk, where Y ijk=observation from treatment i, animal j and period k; μ, overall mean, M i=the mean effect of treatments (i=1–4); A j=the mean effect of animals (j=1–4); P k=the mean effect of periods (k=1–4) and ε ijk the residual error. Orthogonal polynomial contrasts (linear and quadratic) were used to estimate the effect of R : C ratio. Significant effects were identified at P<0·05.
RESULTS
Feed intake and apparent digestibility
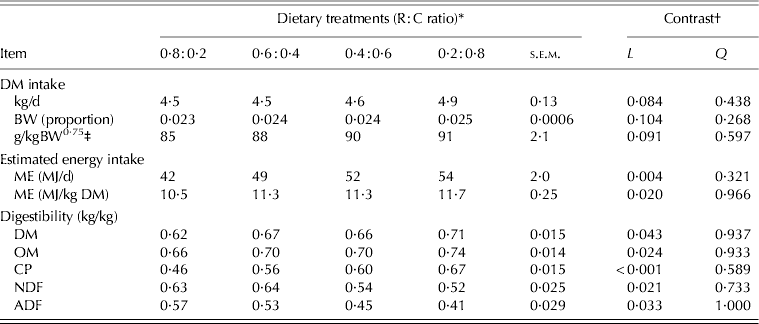
The effects of R : C ratio on feed intake and nutrient digestibility in dairy steers are presented in Table 2. Total dry matter intake (DMI) was not affected by R : C ratio. Increasing concentrate in the diet increased ME intake linearly in terms of MJ/d (P=0·004) and apparent nutrient digestibilities of DM, OM and CP (P=0·043, P=0·024 and P<0·001, respectively), whereas digestibilities of NDF and ADF in the total tract decreased linearly with increasing R : C ratio at 0·4 : 0·6 and 0·2 : 0·8 (P=0·021 and P=0·033, respectively).
Effect of roughage to concentrate ratio on feed intake, estimated energy intake and the coefficient of component digestibility in the total tract of dairy steers

* R : C ratio at 0·8 : 0·2, 0·6 : 0·4, 0·4 : 0·6 and 0·2 : 0·8.
† Linear and quadratic effects of R : C ratio at 0·8 : 0·2, 0·6 : 0·4, 0·4 : 0·6 and 0·2 : 0·8.
‡ g/kg BW0·75, gram per metabolic body weight.
Characteristics of rumen fermentation and blood metabolites
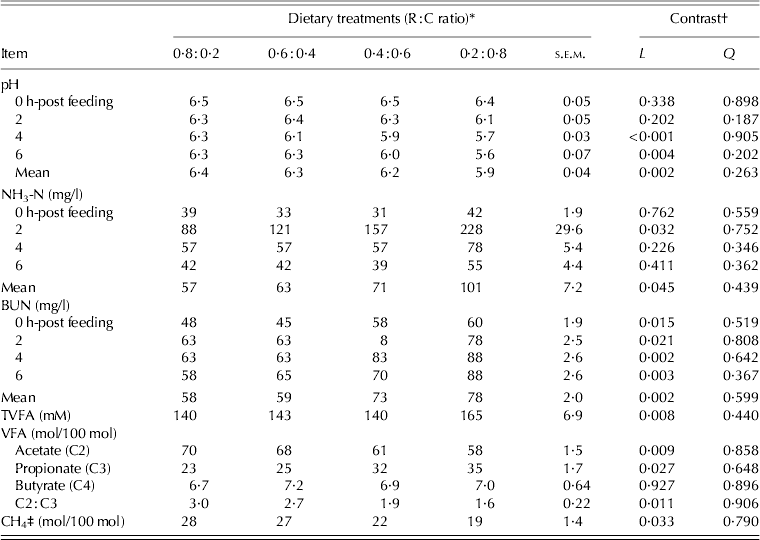
The effects of R : C ratio on rumen fermentation is presented in Table 3. Ruminal pH declined immediately after feeding, and dropped to 5·6 at 6 h post-feeding when steers were fed 0·80 concentrate in the diet. Means of ruminal pH decreased from 6·4 to 5·9 (P=0·002). However, means of ruminal NH3-N and BUN concentrations increased linearly when steers were fed with higher ratios of concentrate (P=0·049 and P=0·008, respectively). The total VFA concentration was greater in steers fed the R : C ratio at 0·2 : 0·8 (P=0·008). Substituting part of the roughage with concentrate resulted in a linear decrease in acetate (C2) (P=0·009) but linear increases (P=0·027) in propionate (C3) molar proportions, which led to a reduction in C2 : C3 (P=0·011). Furthermore, the calculated production of ruminal CH4 decreased linearly (P=0·033) when steers were fed with 0·60 and 0·80 concentrate in the diet.
Effect of roughage to concentrate ratio on rumen pH, NH3–N, BUN, VFA concentration and CH4 production in dairy steers
* R : C ratio at 0·8 : 0·2, 0·6 : 0·4, 0·4 : 0·6 and 0·2 : 0·8.
† Linear and quadratic effects of R : C ratio at 0·8 : 0·2, 0·6 : 0·4, 0·4 : 0·6 and 0·2 : 0·8.
‡ CH4 gas production was calculated.
Rumen microbial community
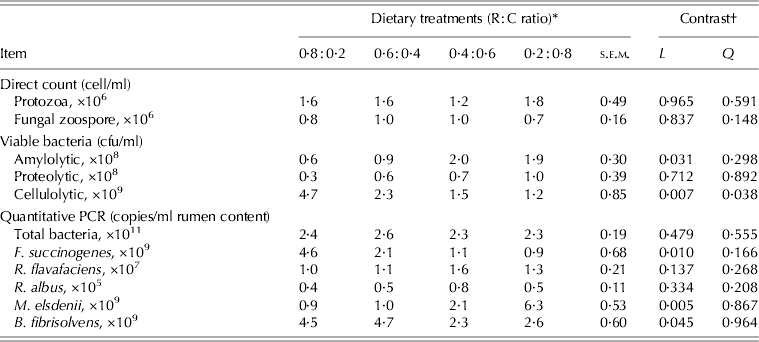
Table 4 presents information on the rumen microbial population as influenced by different R : C ratios. Ruminal protozoa, fungal zoospores and groups of bacteria including proteolytic bacteria were not affected by different R : C ratios. However, the amount of cellulolytic bacteria decreased linearly (P=0·031), while that of amylolytic bacteria increased linearly (P=0·031) with higher proportions of concentrate in the diet (0·60 and 0·80 concentrate). Real-time PCR for quantification of ruminal microbes with specific targets (total bacteria, R. albus, F. succinogenes, R. flavefaciens, M. elsdenii and B. fibrisolvens) are reported in Table 4. The population of total bacteria, R. flavefaciens and R. albus were similar among treatments, while the population of F. succinogenes decreased linearly (P=0·010) with decreasing levels of concentrate in the diet. In addition, levels of B. fibrisolvens decreased linearly (P=0·045), while those of M. elsdenii increased linearly (P=0·005) with higher proportions of concentrate in the diet.
Effect of roughage to concentrate ratio on ruminal microbes, viable bacteria and quantification of rumen bacteria by using real-time PCR in dairy steers
* R : C ratio at 0·8 : 0·2, 0·6 : 0·4, 0·4 : 0·6 and 0·2 : 0·8.
† Linear and quadratic effects of R : C ratio at 0·8 : 0·2, 0·6 : 0·4, 0·4 : 0·6 and 0·2 : 0·8.
Microbial protein synthesis
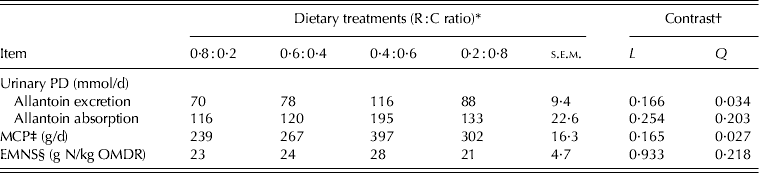
The effects of R : C ratio on the excretion of urinary PD and microbial CP synthesis in dairy steers are reported in Table 5. Allantoin excretion and microbial CP synthesis increased quadratically with increasing proportions of concentrate in the diet (P=0·034 and P=0·027, respectively), while allantoin absorption and EMNS were similar among treatments.
Effect of roughage to concentrate ratio on excretion of urinary PD, microbial CP supply and EMNS in dairy steers
* R : C ratio at 0·8 : 0·2, 0·6 : 0·4, 0·4 : 0·6 and 0·2 : 0·8.
† Linear and quadratic effects of R : C ratio at 0·8 : 0·2, 0·6 : 0·4, 0·4 : 0·6 and 0·2 : 0·8.
‡ MCP, microbial crude protein synthesis.
§ EMNS, efficiency of microbial N synthesis, g of N/kg of OMDR, OM digested in the rumen.
DISCUSSION
Excessively low rumen pH can be a problem in animals consuming a diet with high proportions of concentrate, when acid production exceeds the buffering capacity of the rumen; in particular, fibre digestion can be compromised at pH 6 or less (Mould & Ørskov Reference Mould and Ørskov1983). In the current study, ruminal pH declined after feeding and dropped to 5·9 and 5·7 at 4 h post-feeding and mean ruminal pH decreased to 6·2 and 5·9 when concentrate comprised 0·60 and 0·80 of the diet. Hence, digestibility of NDF and ADF was reduced in both diets. Slyter et al. (Reference Slyter, Oltjen, Kern and Blank1970) reported that a decline in ruminal fluid pH was found when high concentrate diets were fed. A possible explanation for this is that high concentrate diets were associated with decreases in rumination and salivation, consequently, the buffering capacity was shown to be reduced, which was coupled with rapid microbial degradation of soluble carbohydrates and a reduction in fibre digestion, resulting in a decline of ruminal pH (Balch Reference Balch1971; Tripathi et al. Reference Tripathi, Santra, Chaturvedi and Karim2004). Mould et al. (Reference Mould, Ørskov and Mann1983) suggested that pH was a major determinant in the reduction of fibre digestion at a pH around 6·0. The reduction in fibre digestion at low pH results from the reduction in the cellulolytic bacterial population and it has been attributed to a reduction in the ability of cellulolytic bacteria to attach to feed particles (Cheng et al. Reference Cheng, Fay, Howarth and Costerton1980; Calsamiglia et al. Reference Calsamiglia, Cardozo, Ferret and Bach2008). In the present study, the cellulolytic bacterial population was decreased, but amylolytic bacteria exhibited a more gradual increase as the proportion of concentrate in the diet was increased. Similarly, Cherdthong et al. (Reference Cherdthong, Wanapat, Kongmun, Pilajun and Khejornsart2010) reported that cellulolytic bacteria decreased when the diet comprised 0·50 and 0·75 concentrate. The growth of ruminal cellulolytic bacteria is inhibited at low pH. Stewart (Reference Stewart1977) and Russell & Wilson (Reference Russell and Wilson1996) reported that three predominant cellulolytic bacteria (F. succinogenes, R. flavefaciens and R. albus) do not grow at pH below 6·0. However, based on the present study, the levels of three cellulolytic bacteria did not change when the mean pH ranged from 5·9 to 6·4: it is possible that they remained adhered to, and viable on, digesta particles at somewhat lower pH and could perhaps re-initiate growth rapidly upon a return to a more favourable pH later in the feeding cycle (Mouriño et al. Reference Mourino, Akkarawongsa and Weimer2001; Palmonari et al. Reference Palmonari, Stevenson, Mertens, Cruywagen and Weimer2010). Moreover, F. succinogenes was found to be the most predominant of the three species (2·2×109 copies/ml), followed by R. flavefaciens and R. albus (1·3×107 and 0·6×105 copies/ml, respectively). This was in agreement with Michalet-Doreau et al. (Reference Michalet-Doreau, Fernandez, Peyron, Millet and Fonty2001), who found that the relative population size of F. succinogenes was always greater than that of Ruminococcus in the rumen of sheep fed an alfalfa hay diet.
Concentrations of lactate-utilizing bacteria were relatively constant up to diets comprising 0·60 concentrate (Prins et al. Reference Prins, Lankhorst, Van Der Meer and Van Nevel1975; Mackie et al. Reference Mackie, Gilchrist, Robberts, Hannah and Schwartz1978), while lactate-utilizing bacteria increased dramatically when diets comprising 0·80 concentrate were fed (Olumeyan et al. Reference Olumeyan, Nagaraja, Miller, Frey and Boyer1986). In the present study, ruminal pH declined from 6·4 to 5·7 at 4 h post-feeding when the diet comprised 0·80 concentrate. Hence, the population of B. fibrisolvens decreased, whereas that of M. elsdenii generally increased, and did so more rapidly with increased feeding of concentrate. Similarly, Brown et al. (Reference Brown, Ponce and Pulikanti2006) reported that M. elsdenii population levels increased when feeding >0·60 concentrate in the diet. The increase in M. elsdenii population is a mechanism of maintaining ruminal pH by utilizing the increase in lactic acid production in the rumen (Fernando et al. Reference Fernando, Purvis, Najar, Sukharnikov, Krehbiel, Nagaraja, Roe and Desilva2010). Klieve et al. (Reference Klieve, Hennessy, Ouwerkerk, Forster, Mackie and Attwood2003) also found that the population of M. elsdenii increased while B. fibrisolvens gradually decreased during adaptation to high levels of concentrate in the diet: B. fibrisolvens was reported to be the species undertaking complete ruminal biohydrogenation and was the most important predominant ruminal bacteria to produce cis-9, trans-11 CLA. Furthermore, it has been found that feeding steers with 0·90 grain supplementation resulted in an increased M. elsdenii population, with a resultant increase in the production of trans-10, cis-12 CLA (Kim et al. Reference Kim, Liu, Rychlik and Russell2002).
Rumen NH3-N concentrations varied in response to feeding, especially at the peaks occurring at 2 h post-feeding. This was consistent with previous findings (Gustafsson & Palmquist Reference Gustafsson and Palmquist1993; Moorby et al. Reference Moorby, Dewhurst, Evans and Danelón2006). Rumen NH3-N concentration averaged 73 mg/l for four diets, a level slightly above the concentration of 50 mg/l suggested by Satter & Slyter (Reference Satter and Slyter1974) to be an optimum level to maximize microbial CP synthesis. As the proportion of concentrate in the diet increased, the amount of N truly digested in the rumen increased, which is likely to be the main reason for enhancement of rumen NH3-N concentrations (Moorby et al. Reference Moorby, Dewhurst, Evans and Danelón2006). In the current study, increasing the R : C ratio from 0·8 : 0·2 to 0·2 : 0·8 in the diet of steers increased rumen NH3-N concentration. Similarly, Mayne & Gordon (Reference Mayne and Gordon1984) reported that rumen NH3-N concentrations increased significantly with a decreasing R : C ratio as the CP concentration in the diet increased. However, other previous findings did not show an effect on ruminal NH3-N concentration by increasing dietary concentrate level in steers and goats fed alfalfa hay as a roughage source (Rotger et al. Reference Rotger, Ferret, Calsamiglia and Manteca2006; Cantalapiedra-Hijar et al. Reference Cantalapiedra-Hijar, Yáñez-Ruiz, Martín-García and Molina-Alcaide2009). Factors which may explain this difference are the different roughage source and type of protein in the diet (true protein and non-protein nitrogen), supply of fermentable energy and efficiency of microbial protein synthesis.
Microbial CP synthesis in the rumen provides the majority of protein supplied to the small intestine of ruminants, accounting for 0·50–0·80 of total absorbable protein (Firkins et al. Reference Firkins, Yu and Morrison2007). In the present study, microbial CP synthesis increased when the diet comprised 0·60 concentrate. However, reductions in the rate of microbial CP synthesis were seen as the concentrate level was increased to 0·80 in the diet. Ruminal microbial CP synthesis depends mainly on an adequate supply of carbohydrates as an energy source for the synthesis of peptide bonds (Bach et al. Reference Bach, Calsamiglia and Stern2005). It has been found that microbial CP synthesis tends to increase when rapidly fermentable carbohydrate is supplemented with concentrate at <0·30 of the total diet, but decreases when the supplementation is >0·70 concentrate in the diet (Huber & Kung Reference Huber and Kung1981). In the current study, microbial CP synthesis decreased when steers received R : C ratio of 0·2 : 0·8 which could be due to a rapid rate of non-structural carbohydrate degradation, resulting in uncoupled microbial growth. The microbial CP flows from the rumen as calculated from PD excretion using the equation of Chen & Gomes (Reference Chen and Gomes1995) were 239, 267, 397 and 302 when the R : C ratio were at 0·8 : 0·2, 0·6 : 0·4, 0·4 : 0·6 and 0·2 : 0·8 in the diet, respectively.
Total VFA concentrations in all treatments ranged from 139·9 to 164·5 mm and were similar to those reported by Poungchompu et al. (Reference Poungchompu, Wanapat, Wachirapakorn, Wanapat and Cherdthong2009). The proportions of individual VFA were within the normal range when high concentrate diets were fed to ruminants (Cherdthong et al. Reference Cherdthong, Wanapat, Kongmun, Pilajun and Khejornsart2010; Anantasook & Wanapat Reference Anantasook and Wanapat2012). The expected increase in total VFA concentration with high levels of concentrate in the diet was observed. Likewise, Anantasook et al. (Reference Anantasook, Wanapat and Cherdthong2013) found that proportion of concentrate in the diet had an effect on total VFA concentration in the rumen of steers. In contrast, other authors have reported that total VFA concentration was unaffected by high levels of concentrate in the diet (Cerrillo et al. Reference Cerrillo, Russell and Crump1999; Cantalapiedra-Hijar et al. Reference Cantalapiedra-Hijar, Yáñez-Ruiz, Martín-García and Molina-Alcaide2009). Plausible reasons which may have attributed to this difference could be due to the fibre content in the concentrate, which resulted in different VFA concentration regardless of the concentrate level in the diet. The molar proportion of acetic acid decreased with higher levels of concentrate in the diet, whereas the proportion of propionic acid increased. Increasing molar proportions of propionic acid in the rumen is frequently found where roughage is supplemented with concentrate (Moorby et al. Reference Moorby, Dewhurst, Evans and Danelón2006; Poungchompu et al. Reference Poungchompu, Wanapat, Wachirapakorn, Wanapat and Cherdthong2009; Cherdthong et al. Reference Cherdthong, Wanapat, Kongmun, Pilajun and Khejornsart2010). The relationship between the C2 : C3 and diet has been explained by the metabolic characteristics of fibre-digesting and starch-digesting bacteria. Acetate formation is due mainly to structural carbohydrate fermentation by cellulolytic bacteria, whereas the fermentation of non-structural carbohydrate is degraded by amylolytic bacteria, leading to a relatively higher production of propionate (Opsi et al. Reference Opsi, Fortina, Tassone, Bodas and López2012). In the current study, this high propionate production, low C2 : C3 and CH4 production was caused by a minimum pH (5·7 and 5·9) at 4 h post-feeding when steers received R : C ratio of 0·4 : 0·6 and 0·2 : 0·8, respectively. At this pH, populations of cellulolytic bacteria were reduced, while those of amylolytic bacteria were increased; as a consequence, the production of propionate increased (Rotger et al. Reference Rotger, Ferret, Calsamiglia and Manteca2005).The results from the present study were similar to those of Nagaraja et al. (Reference Nagaraja, Towne and Beharka1992), who reported that cattle fed 0·85 concentrate in the diet had lower ruminal pH, a lower molar ratio of C2 : C3 and a tendency for greater numbers of amylolytic bacteria. Lee et al. (Reference Lee, Tweed, Dewhurst and Scollan2006) found that steers fed diets comprising 0·80 concentrate had decreased ruminal pH, increased VFA concentrations and decreased C2 : C3 than those fed 0·20 and 0·40 concentrate in the diet. The molar proportion of acetate decreased with higher levels of concentrate in the diet, particularly at 0·80 concentrate, whereas the proportions of propionate and butyrate were increased in vitro (Anantasook et al. Reference Anantasook, Wanapat and Cherdthong2013). Hydrogen produced during this process can be accommodated by methane formation, whereas the greater flux rates and lower pH with high-concentrate feeding promote electron disposal by forming propionate and lactate from pyruvate rather than acetate (Russell Reference Russell1998). It has been indicated that inhibition of hydrogen used by methanogenic archaea itself may account for up to 0·25 of the change in acetate to propionate ratio (Brown et al. Reference Brown, Ponce and Pulikanti2006).
The feed costs of the four diets tended to increase as the proportion of concentrate in the diet increased, with values of 0·37, 0·49, 0·63 and 0·80 GBP/hd/d for R : C ratios of 0·8 : 0·2, 0·6 : 0·4, 0·4 : 0·6 and 0·2 : 0·8, respectively. Nevertheless, the ratios of R : C in ruminants that would maximize the profit generally depend on the available nutrient content of each, relative prices, fermentation end-products and the performance. In the current trial, diets comprising 0·60 concentrate were profitable, coupled with maximal efficiency of rumen fermentation and feed utilization.
CONCLUSION
The current study indicated that R : C ratio at 0·4 : 0·6 resulted in increased energy intake, healthy rumen (rumen pH and ecology), VFA production especially propionic acid, microbial protein synthesis and reduced methane production in dairy steers fed on urea-treated rice straw as a roughage source.
The authors would like to express their most sincere thanks to Tropical Feed Resources Research and Development Centre (TROFREC), Khon Kaen University and Graduate School of Khon Kaen University for providing financial support for the research and the use of the research facilities. The authors also wish to acknowledge Agricultural Biotechnology Research Centre, Northeast Agricultural Research and Development Centre, Faculty of Agriculture, Khon Kaen University for real-time PCR analysis and for the use of high performance liquid chromatography.