We previously observed in a Dutch birth cohort that diabetes diagnosed in late middle age was associated with a marker derived from the fingerprints on four digits.Reference Kahn, Graff, Stein and Lumey 1 Our dermatoglyphic marker compared the mean fingertip ridge counts on the two first digits (thumbs) with the mean fingertip ridge counts on the two fifth digits (little fingers) – a continuous variable we called ‘Md15’. This arithmetic difference in ridge counts likely describes a size contrast between the fetal thumb and fetal little finger, and evidence from rodents suggests that the fetal size contrast between digits one and five may reflect the early gestational activity of a hedgehog signaling protein.Reference Benazet and Zeller 2 We also showed that Md15 varied with some seasonal feature of the Dutch environment, but we were not able to specify the nature of this seasonal, environmental factor.Reference Kahn, Graff and Stein 3 As human fingerprints are established by the gestational age of 19 weeks,Reference Babler 4 our findings indicated that Md15 in the offspring reflected developmental factors or circumstances occurring before the midpoint of the mother’s pregnancy.
If adult diabetes were to be associated with an environmental factor in early gestation, identification of a mechanism that might explain this prenatal influence on metabolism in later life would be valuable. Embryological observations in rodents have found that hedgehog signaling proteins also influence the development, growth and stability of fetal pancreatic β cells.Reference King, Guasti and Laufer 5 – Reference Lau and Hebrok 7 As hedgehog signaling proteins might have parallel involvement with both finger morphology and β-cell development, we hypothesized that fingerprint Md15 in the Dutch offspring would be associated specifically with their adult β-cell function. In the setting of decreased insulin sensitivity, a reduction in β-cell function may lead to type 2 diabetes.Reference Kahn, Zraika, Utzschneider and Hull 8 – Reference Lorenzo, Wagenknecht and D’Agostino 10 The β-cell function is not commonly estimated, however, in clinical or in epidemiological practice. A permanent fingerprint marker associated with adult β-cell function could easily provide accessible information to diabetes researchers interested in how early fetal environments may lead specifically to insufficient production or release of insulin in later life.
The fetal environment may also contribute to type 2 diabetes through mechanisms related to maternal hyperglycemia, an etiologic pathway that is probably independent of the genes shared by mother and offspring.Reference Dabelea, Hanson and Lindsay 11 , Reference Pettitt, Lawrence and Beyer 12 Although our study depended on the excellent prenatal records available for our Dutch birth cohort, we had no data on mothers’ prenatal glucose concentrations; glucose assays were not ordinarily documented during maternity care provided in that era. However, an offspring’s exposure to some degree of gestational hyperglycemia may be inferred from the mother’s later acquisition of a diabetes diagnosis.Reference Carr, Newton and Utzschneider 13 , Reference Golden, Bennett and Baptist-Roberts 14 In order to broaden our exploration of the prenatal environmental influences on offspring glucose regulation, we accepted a maternal history of diabetes, irrespective of mother’s age at diagnosis, as a dichotomous indicator that an offspring was exposed to prenatal hyperglycemia (not necessarily ‘diabetes’) of an unspecified degree.
Method
Population and setting
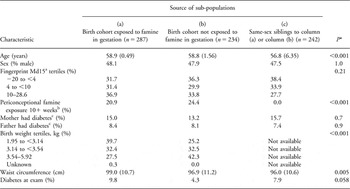
The Dutch Hunger Winter Families Study was designed initially to examine how maternal under-nutrition during the Winter Famine of 1944–1945 affected the subsequent life course of the exposed offspring. The study identified for follow-up 3307 live-born, singleton Dutch births occurring during 1943–1947. Archived maternity records came from the University Hospital in Leiden and midwifery training schools in Amsterdam and Rotterdam. With the assistance of population registers, we found current addresses in the Netherlands for 2300 (70%) of the identified clinic births. Nine percent of live-borns had died, 8% had left the country, 4% could not be traced for administrative reasons and the remaining 9% were not found despite repeated attempts. During 2003–2005, we invited those located, together with a same-sex sibling whenever possible, for a telephonic interview and a clinical examination at Leiden University Medical Center. Previous reports have described how we, thereby, assembled a clinical study population of 971 adults (359 cohort offspring exposed to gestational famine, 299 cohort offspring unexposed to gestational famine and 313 same-sex siblings of the examined birth cohort).Reference Kahn, Graff, Stein and Lumey 1 , Reference Lumey, Stein and Kahn 15 Five of these siblings were subsequently recognized to have possibly been famine-exposed, and therefore they have been excluded from this analysis. After further exclusion of persons with previously diagnosed diabetes (n = 62; i.e. participants attempting to modify their physiology through oral medication, insulin use or behavioral changes), those who did not provide data on fasting glucose and insulin concentrations (n = 21) and those with inadequate fingerprint ridge-count information (n = 120), our analytic sample for this report included 763 participants (Table 1).
Characteristics of the examined Dutch study population (n = 763) traced from a birth cohort or recruited as same-sex siblings of the participating birth-cohort members

Values presented in columns (a), (b) and (c) are either means (s.d.) or %.
*ANOVA or χ 2test, as appropriate for comparison between subpopulations.
aMean fingertip ridge count on two first digits (thumbs) minus the mean fingertip ridge count on two fifth digits (little fingers).
bExposed as an ovum, sperm cell or embryo to severe undernutrition for at least 10 weeks in the interval extending from 10 weeks before to 10 weeks after mother’s last menstrual period.
cAs reported by adult offspring, parent was diagnosed with diabetes at any time in her/his life.
Study protocols were approved by human subjects committees of Columbia University and the collaborating Dutch institutions. All participants in the clinical exam provided verbal consent at the start of their telephonic interviews and written informed consent at the start of their examination visit.
Clinical assessment
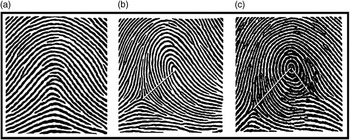
Fingertip ridge counts were obtained from ink-and-paper, rolled fingerprints. In accordance with standard dermatoglyphic practice, the ridge count for fingertips with a loop pattern equaled the number of ridges (range 1 to approximately 40) that intersected or touched a straight line drawn from the core of the loop to the delta (‘triradius’) point located on the radial or ulnar aspect of the finger; fingers with an arch pattern were assigned a ridge count of zero.Reference Penrose 16 , Reference Loesch 17 For fingertips with whorls or double loops, we applied a summary ridge-count formula that included half-unit values for those ridges located between the core and a second delta point or between multiple coresReference Kahn, Graff and Stein 3 (see Fig. 1 for fingerprint examples). All ridge counting was performed by a research assistant who was blinded to the diabetic and famine exposure status of the participants. For each participant, we calculated a mean summary ridge count for digit one (thumbs) and for digit five (little fingers) by averaging the two summary ridge-count values from the right and left hands. For participants who lacked a summary ridge count for a finger from one hand or the other (primarily because of lack of ridge clarity), the mean ridge count was calculated using a substituted ridge-count value derived from the homologous finger on the opposite hand. These substitutions were assigned according to the empirical, right–left relationships shown by our analysis of 547 thumb pairs and 472 little-finger pairs with clearly discerned ridge counts.Reference Kahn, Graff and Stein 3
Examples of common fingerprint patterns and the determination of summary ridge counts (RCs). Panel (a): A minority of fingertips reveals an ‘arch’ pattern with neither a core nor a delta point (e.g. RC = 0, suggests a very small volar pad). Panel (b): Most fingertips show a ‘loop’ pattern containing one core and one delta point (e.g. RC = 13, an average volar pad). Panel (c): Also fairly common is the ‘whorl’ pattern with one core and two delta points (e.g. summary RC = 21 [i.e. 17+( × 8)], a large volar pad) and the ‘double loop’ pattern with two cores and two delta points (not shown).

Within the traced-birth cohort, prenatal exposures to famine were identified by comparing the adjudicated date of the mother’s last menstrual period with the 24-week calendar interval during which food rations in western Holland remained below 900 kcal/day. This interval of severe under-nutrition lasted from 26 November 1944 to 12 May 1945. A gestational famine exposure (exposed in utero for at least 10 weeks following the mother’s last menstrual date) was assigned to offspring whose mother’s last period came between 2 May 1944 and 4 March 1945.Reference Lumey, Stein and Kahn 15 , Reference Stein, Kahn and Rundle 18 A periconceptional famine exposure (mother lived in the famine interval for the entire 10 weeks before her last menstrual date or the entire 10 weeks after her last menstrual date) was assigned to offspring whose mother’s last period came between 26 November 1944 and 12 May 1945.
A birth weight for all but one participant in the traced-birth cohort was obtained from archived delivery records. For clinic participants recruited as unexposed, same-sex siblings of the birth cohort, we had no documented information about birth weight or mother’s last menstrual date.
A history of diagnosed diabetes at any time in the life of the mother or father was obtained by a scripted interview of each participant. A standing waist circumference was measured in duplicate at the level of the iliac crests where they intersected the midaxillary line.
Laboratory assessment
Basal insulin sensitivity and β-cell function were estimated with homeostatic model assessments (‘HOMA’) based on fasting insulin and glucose concentrations. Insulin was measured from promptly separated, frozen serum with an immunoradiometric assay (Biosource, Nivelles, Belgium). The interassay coefficients of variation ranged from 6.1% to 6.5%. The lowest detectable amount was 3 mU/L. Glucose was assayed in promptly separated serum by the hexokinase reaction on a Modular P800 (Roche, Boehringer Mannheim, Germany); the interassay coefficient of variation was 1.3–1.8%.
Insulin sensitivity was calculated by the quantitative insulin sensitivity check index (‘QUICKI’) with the formula

,where I0 is fasting insulin (μU/ml) and G0 is fasting glucose (mg/dl). QUICKI is a dimensionless index without units.Reference Chen, Sullivan and Quon 19 Basal β-cell function was calculated by the original HOMA expression

,where I0 is fasting insulin (μU/ml) and Gsi0 is fasting glucose (mmol/l).Reference Matthews, Hosker and Rudenski 20 The distribution of HOMA-b is skewed to the right, and therefore its log transformation (LnHOMA-b) is preferable for use in linear regression models. We diagnosed diabetes (previously unrecognized) based on the results of a 2-h oral glucose tolerance test after overnight fasting. 21
For alternative analyses based on fasting insulin and glucose concentrations, we also performed our analyses using the updated HOMA models (‘HOMA2’) that take account of variations in hepatic and peripheral glucose resistance, increases in the insulin secretion curve for high concentrations of plasma glucose and the contribution of circulating proinsulin.Reference Levy, Matthews and Hermans 22 , Reference Wallace, Levy and Matthews 23 These HOMA2 models consist of nonlinear, empirical equations that preclude an exact algebraic expression. We therefore used model-derived values of HOMA2-%S (log-transformed, analogous to QUICKI) and HOMA2-%B (log-transformed, analogous to LnHOMA-b) that were downloaded over the internet from the Oxford Diabetes Trials Unit (http://www.dtu.ox.ac.uk/index.php?maindoc=/homa/).
Statistical analysis
Descriptive statistics were prepared with SAS software (version 9.2; SAS Institute, Cary, NC, USA). Multivariable regression analyses requiring correction for sibling pairs used a link function in the REGRESS procedure of SAS-callable SUDAAN software (Release 10; Research Triangle Institute, Research Triangle Park, NC, USA) with variances estimated by the Taylor series method. Our multivariable models were all adjusted for age (continuous), sex and exposures to gestational and periconceptional famine. We used predicted marginal values for plotting estimates of QUICKI and LnHOMA-b associated with the categorical independent variables Md15 (in tertiles) and mother’s history of diabetes (dichotomous). We considered results to be significant if P < 0.05.
Results
Our examined sample of 365 men and 398 women born in the Netherlands was primarily of older middle age (mean 58.2 years, s.d. 3.8). Their mean dermatoglyphic summary ridge count from two thumbs was 21.5 (s.d. 8.8) and from two little fingers was 15.0 (s.d. 5.9). The mean Md15 for men was 7.5 (s.d. 7.8) and for women it was 5.6 (s.d. 6.7).
Based on our criterion of 10+ weeks of maternal under-nutrition, 227 (29.8%) of these examined participants were exposed to gestational famine alone, 57 (7.5%) were exposed to periconceptional famine alone, 60 (7.9%) were exposed to both gestational and periconceptional famine and 419 (54.9%) had no prenatal famine exposure. Unrecognized diabetes was found in 35 men and 22 women. The mean waist circumference for all men was 99.8 cm (s.d. 9.7) and for all women it was 95.2 cm (s.d. 11.5). These and other selected characteristics are summarized in Table 1 with stratification according to whether the participants were from the birth cohort exposed to gestational famine, the birth cohort unexposed to gestational famine or from the group recruited as same-sex siblings to the birth cohort.
Our two outcome variables of interest were well suited for regression analysis in that their values closely approached the normal distribution. Estimated basal β-cell function (LnHOMA-b) had a mean of 4.818 (s.d. 0.600) and a median of 4.813. Estimated basal insulin sensitivity (QUICKI) had a mean of 0.3357 (s.d. 0.0307) and a median of 0.3358.
In bivariate correlations, Md15 was not associated (P > 0.05) with LnHOMA-b (r = −0.07) or with QUICKI (r = +0.03). Having a mother with a history of diabetes was not associated with LnHOMA-b (difference = +0.05; 95% CI −0.07, +0.17), but was associated with reduced QUICKI (difference = −0.011; 95% CI −0.017, −0.005). This adverse effect of maternal diabetes on QUICKI was significant, however, only for women (difference = −0.017; 95% CI −0.125, −0.009), but not for men (difference = −0.004; 95% CI −0.013, +0.005). Birth weight, available for only 520 participants, was not associated with LnHOMA-b (r = +0.02), QUICKI (r = +0.07) or Md15 (r = +0.05).
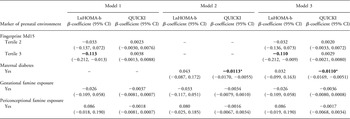
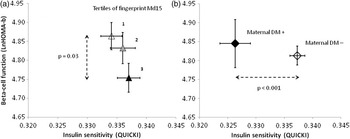
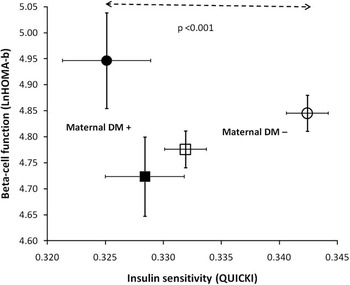
In multivariable regression models that incorporated adjustments for offspring age, sex and famine exposures, the ascending tertiles of fingerprint Md15 were associated with a stepwise reduction of LnHOMA-b (P = 0.03 for Md15 tertile 3 v. 1), but Md15 had no significant relation to QUICKI (Table 2; model 1). A history of maternal diabetes was associated with reduced QUICKI (P < 0.001) but not with LnHOMA-b (model 2). Including both Md15 and a maternal history of diabetes in the same model did not materially change these results (model 3; Fig. 2). If we omitted the terms for famine exposure from our models, the effects of Md15 and maternal diabetic history on the dependent variables were essentially unchanged (data not shown).
Alternative linear regression models for outcomes of basal β-cell function (LnHOMA-b) or insulin sensitivity (QUICKI). All models included 763 participants and were corrected for sibling pairs and adjusted for age (continuous), sex and famine exposures

Coefficients are in bold where P < 0.05.
*P < 0.001.
Displays of estimated influences on basal β-cell function (LnHOMA-b, vertical axis) and insulin sensitivity (QUICKI, horizontal axis) for adults of both sexes. Participants who are located relatively low on these plots (reduced β-cell function corrected for insulin sensitivity) or relatively to the left on the plot (reduced insulin sensitivity corrected for β-cell function) are less capable of insulin-mediated glucose disposition. Panel (a) identifies participants by tertiles of fingerprint Md15. Panel (b) identifies participants by mother’s history of diabetes. These multiply adjusted estimates come from regression Model 3 (see Table 2); bars indicate the standard errors of the estimates.

Formal testing confirmed an interaction between sex and maternal diabetes for the multivariable model of QUICKI. In sex-specific multivariable models, maternal diabetes was associated strongly with QUICKI for the women (β-coefficient = −0.0173; 95% CI −0.0255, −0.0090, P < 0.001), but not for the men (β-coefficient = −0.0035; 95% CI −0.0112, +0.0042, P = 0.4; Fig. 3). We found no significant interaction between sex and Md15 for the model of LnHOMA-b; the β-coefficient of Md15 tertile 3 was −0.093 for men and −0.133 for women.
Sex-specific estimates, multiply adjusted, demonstrating that having a positive history of maternal diabetes (solid markers), compared with a negative history of maternal diabetes (open markers), was associated with a greater deficit in insulin sensitivity for women (P < 0.001) but not for men. This plot also shows that men (square markers) in this sample had less β-cell function than women (circle markers), as shown by their lower position on the graph. Men also had less insulin sensitivity, as shown by their more leftward position, than women. Bars indicate the standard errors of the estimates.

Further adjustment for offspring waist circumference (continuous variable) in model 3 (n = 763) resulted in modestly attenuated decrements for β-cell function (Md15 tertile 2 β-coefficient = −0.024; Md15 tertile 3 β-coefficient = −0.088, P = 0.08) and for insulin sensitivity (maternal diabetes β-coefficient = −0.0073, P = 0.01). In sex-specific analyses, the waist-circumference adjustment resulted in similar relative decrements of insulin sensitivity for women and for men (data not shown). Adjustment for body mass index (continuous variable) instead of waist circumference likewise resulted in modestly attenuated decrements for β-cell function (Md15 tertile 2 β-coefficient = −0.026; Md15 tertile 3 β-coefficient = −0.092, P = 0.07) and for insulin sensitivity (maternal diabetes β-coefficient = −0.0085, P = 0.003). A history of diabetes in the father was not associated with either dependent variable (with or without adjustments for offspring obesity), and therefore we did not include paternal diabetes in any of our models.
Removing 57 participants with unrecognized diabetes from the multivariable analysis (model 3 without adjustment for waist circumference or BMI, n = 706) resulted in attenuated decrements for β-cell function (Md15 tertile 2 β-coefficient = −0.026, P = 0.62; Md15 tertile 3 β-coefficient = −0.059, P = 0.24), but the three-level pattern of stepwise reduction in β-cell function was preserved (without statistical significance). In contrast, our analysis restricted to persons with newly diagnosed diabetes (model 3, n = 57) indicated that diabetic cases with the highest tertile of Md15 had a substantial (>1 s.d.) reduction in β-cell function compared with those in the lowest tertile (Md15 tertile 2 β-coefficient = −0.127, P = 0.67; Md15 tertile 3 β-coefficient = −0.733, P = 0.002).
We also reviewed the effect of birth weight on these analyses after removing the 243 participants for whom no birth weight was documented (model 3, n = 520). Inclusion of birth weight tertiles in the model did not attenuate the association of Md15 tertiles with β-cell function (Md15 tertile 2 β-coefficient = −0.060; Md15 tertile 3 β-coefficient = −0.127, P = 0.03); birth weight tertiles themselves were not associated with β-cell function (data not shown). However, inclusion of birth weight tertiles resulted in the attenuation of the decrement for insulin sensitivity (maternal diabetes β-coefficient = −0.0076; P = 0.03), whereas increased birth weight had a positive effect on insulin sensitivity (birth weight tertile 2 β-coefficient = +0.0059, P = 0.06; birth weight tertile 3 β-coefficient = +0.0065, P = 0.04).
Use of estimates of LnHOMA2-%S (instead of QUICKI) and LnHOMA2-%B (instead of LnHOMA-b) did not alter the estimates appreciably.
Discussion
Variations in the prenatal environment have rarely been documented in human studies of offspring glucose regulation. The data reported here include two individual-level markers that can be plausibly associated with the participants’ early prenatal circumstances. Fingerprint Md15 is associated with unknown factors corresponding with the calendar seasons of the Dutch environment,Reference Kahn, Graff and Stein 3 and a maternal diagnosis of diabetes (irrespective of mother’s age at diagnosis) can be related by epidemiologic inference to some degree of relative hyperglycemia in the offspring’s fetal environment.Reference Carr, Newton and Utzschneider 13 , Reference Golden, Bennett and Baptist-Roberts 14 Analyzed in combination with estimates of adult β-cell function and insulin sensitivity, these individual-level markers suggest novel insights into alternative mechanisms by which the human fetal environment might contribute to the risk of diabetes in postnatal life.
On account of our underlying interest in maternal undernutrition, our data also include ecological markers related to the Dutch Winter Famine of 1944–1945, an episode in which a large population of pregnant women experienced severe caloric deprivation.Reference Lumey and Van Poppel 24 – Reference Roseboom, van der Meulen and Ravelli 26 Since nearly half of our analytic cohort was exposed to famine either gestationally or periconceptionally (Table 1), we have reported our findings with adjustments for this unusual historical circumstance (Table 2). The specific physiologic effects of ecological famine exposure in this group were relatively weak, however, as our analysis excluded all examined participants who had been previously diagnosed with diabetes.
Diminished β-cell function is an important cause of progression to type 2 diabetes.Reference Kahn, Zraika, Utzschneider and Hull 8 – Reference Lorenzo, Wagenknecht and D’Agostino 10 We found within our entire analyzed cohort that adult β-cell function was significantly reduced among study participants who had increased values of fingerprint Md15; the loss of β-cell function with increased Md15 was especially severe within the subset of 57 participants who were newly diagnosed with diabetes. The ridge count developed on each fingertip likely reflects the magnitude of buckling stress on the dermis as that finger’s temporary volar pads shrink between gestational weeks 12 and 18.Reference Kucken and Newell 27 On any specific fingertip, the shrinkage of a large volar pad would result in a high ridge count, whereas the shrinkage of a small volar pad would result in a low ridge count. Rodent experiments indicate that the relative size of each digit, especially the contrast between the anterior and posterior aspects of the fetal forelimb, is guided by both temporal and localized variations in hedgehog signaling proteins.Reference Benazet and Zeller 2
In the human context, fingerprints are permanently fixed before the middle of gestation,Reference Babler 4 and therefore the Md15 marker (describing the early fetal size contrast between digits one and five) must reflect developmental influences on the early fetus, embryo or possibly the preconceptional ovum or sperm cell. Development of the endocrine pancreas also begins before the middle of gestation, and hedgehog proteins contribute in complex ways to the growth and preservation of pancreatic β cells.Reference King, Guasti and Laufer 5 – Reference Lau and Hebrok 7 It is biologically plausible, therefore, that early developmental markers found on fingertips will be related to variations in early β-cell mass or function.
Genetic loci identified in association with β-cell function are more common than loci associated with insulin sensitivity,Reference Florez 28 and we cannot exclude the possibility that genes could be the primary determinants of Md15. Although there may be genetic determinants of some dermatoglyphic patterns or of total ridge counts obtained from all 10 fingertips, a genome-wide linkage scan has not supported the existence of genetic influences in the ridge counts specific to the thumb and little finger.Reference Medland, Loesch and Mdzewski 29 In an earlier report from the Dutch Hunger Winter Families Study, we showed that Md15 in the offspring was associated with seasonal variation in the month of conception.Reference Kahn, Graff and Stein 3 Fingerprint Md15 was highest for conceptions in August and lowest for conceptions in February. Thus, unless genetic variation exerts seasonal effects on reproductive activity or success, it is most likely that fingerprint Md15 has its origins in the prenatal environment rather than genetic polymorphisms. We do not know specifically what prenatal environmental factors play a role in determining Md15 or β-cell function in later life, but the seasonal nature of this influence suggests directions for future research. We note with interest that large studies from two countries in the northern hemisphere have reported consistent effects of the calendar birth month on diabetes likelihood. Diabetes of type 1 or type 2 was most common among those born in late spring (conceptions approximately in August) and lowest among those born in late fall (conceptions approximately in February).Reference Vaiserman, Carstensen and Voitenko 30 – Reference Vaiserman, Khalangot and Carstensen 32 A smaller study from New Zealand suggests that type 1 diabetes risk in the southern hemisphere was highest for births in September–November (spring) and lowest for births in April–June (fall).Reference Willis, Scott and Darlow 33
In this study sample, restricted to participants with no previous diagnosis of diabetes, we did not find consistent evidence of how adult β-cell function might be affected by famine exposure during gestation or in the periconceptional period (Table 2). However, non-significant trends suggested that the effect of maternal under-nutrition during gestation may have been negative on β-cell function, and that the decrement in LnHOMA-b was enhanced by about 27% (change in the β-coefficient from −0.026 to −0.033) when we eliminated the adjustment for fingerprint Md15 (model 2 in Table 2). As our study participants exposed gestationally to famine had relatively lower birth weights (Table 1), an effect attributable to third-trimester under-nutrition,Reference Stein, Zybert, van de Bor and Lumey 34 the small decrement we observed in LnHOMA-b is compatible with a Danish clinical study that found reduced glucose-stimulated insulin secretion in young men of low birth weight compared with those with upper-normal birth weights.Reference Jensen, Storgaard and Dela 35
We also found that an earlier, periconceptional exposure to famine may have had an opposite (positive) effect on β-cell function (Table 2). By our definition, the periconceptional time window includes 12 weeks before fertilization or 8 weeks following fertilization. These are biological intervals that likely include unique opportunities for epigenetic modification to the independent ova and spermatocytes as well to the early zygote. These contrasting influences of gestational and periconceptional famine on adult β-cell function are compatible with a previous report from the Dutch wartime experience, in which 18 adults in Amsterdam exposed to famine during mid-gestation had a reduced glucose disposition index (i.e. insulin secretion while taking insulin sensitivity into account), but 18 others exposed during early gestation did not.Reference de Rooij, Painter and Phillips 36 Larger study samples may be more informative regarding the association between famine exposure in specific developmental time windows and β-cell function in adulthood.
Reduced insulin sensitivity, a major factor contributing to diabetes in the modern obesogenic environment, appears not to be associated with increased values of Md15 (Table 2 and Fig. 2). We found, however, that an offspring’s insulin sensitivity was reduced among those who reported that their mothers had diabetes at some time in their lives. Perhaps this association illustrates that reduced insulin sensitivity may be transmitted from a parent to its offspring through a mode that is heritable (genetic) and not environmental. On the other hand, fathers also contribute genes to their offspring, but we found paternal diabetes not to be associated with reduced insulin sensitivity. Analyses of very large cohorts have similarly shown that a history of maternal diabetes was more strongly associated with the risk of type 2 diabetes than a history of paternal diabetes.Reference Kahn, Cheng, Thompson, Imperatore and Gregg 37 , Reference van ‘t Riet, Dekker and Sun 38 As with most population-derived cohorts, the prevalence of reported paternal diabetes in our analytic sample was substantially less than the prevalence of maternal diabetes (Table 1), and therefore our power to detect any association with paternal diabetes was reduced. Perhaps a gene can have opposite effects on the risk of diabetes if its origin is paternal rather than maternal.Reference Kong, Steinthorsdottir and Masson 39 Apart from this imprinting phenomenon, genetic variants associated with reduced insulin sensitivity may be fewer in number, less prevalent or have more modest effects on the insulin sensitivity phenotype.Reference Florez 28
It remains plausible that maternal diabetes reported by these middle-aged offspring indicates their prenatal exposure to relative hyperglycemia, and that this environmental exposure (rather than a genetic polymorphism) may have resulted in a loss of sensitivity to adult insulin. Fetal exposure to maternal diabetes has been associated with increased abdominal circumference in the third trimester along with reduction of the fetal ratio of leg-to-arm length in late gestation.Reference Lampl and Jeanty 40 A study of offspring at age 16 years has shown similarly that those born to mothers with gestational diabetes had an increased waist circumference; these investigators also noted a reduced homeostatic model assessment of insulin sensitivity among these adolescents, but their HOMA estimate did not consider the simultaneous estimate of β-cell function.Reference Vaarasmaki, Pouta and Elliot 41 Although our study participants may not have been exposed in utero to the environment of full-blown gestational diabetes, it is likely that the offspring whose mothers eventually acquired a diabetes diagnosis were exposed prenatally to intermediate degrees of gestational hyperglycemia. Recent reports show that an increase in neonatal adiposity associated with increased (but non-diabetic) degrees of glycemia in the firstReference Riskin-Mashiah, Younes, Damti and Auslander 42 or second 43 pregnancy trimesters, and the children of mothers with prenatal glycosuria (but not diabetes) have an increased waist circumference.Reference Lawlor, Fraser and Lindsay 44 Considering that gestational hyperglycemia at various levels has been associated with increased waist circumference in fetuses and offspring children, it is not surprising that when we adjusted our models for adult waist circumference, the estimated impact of maternal diabetes on QUICKI was modestly reduced (a change in the β-coefficient from −0.0110 to −0.0073, a drop of about 34%). The impact on QUICKI, however, remained statistically significant. Why this effect of maternal diabetes on QUICKI was greater in women than in men is unknown, but this interaction with sex may primarily be an artifact related to survivorship bias. Such a bias would occur if the men who experienced the most severe loss of insulin sensitivity (in connection with hyperglycemia in utero) have already been removed from this population sample because of their premature cardiometabolic disease.
Our finding that birth weight was positively associated with improved insulin sensitivity confirms several previous reports.Reference McKeigue, Lithell and Leon 45 – Reference Monrad, Grunnet and Rasmussen 47 Birth weight may be viewed, however, as a complex consequence of various factors – some of them environmental – that contribute effects during different time windows before birth.Reference Stein, Zybert, van de Bor and Lumey 34 , Reference Gillman 48 , Reference Wells 49 In our model that was adjusted for birth weight tertiles, the adverse effect of maternal diabetes on insulin sensitivity was reduced by about 31% (change in the β-coefficient from −0.0110 to −0.076). This suggests, perhaps, that the contribution of maternal glycemia toward heavier infants may have some long-term metabolic benefits along with its well-described adverse effects.
The analyses and inferences presented here may not be applicable to all human experience because our observations came from a homogeneous population of northern Europeans, some of whom were gestated under stressful physiological circumstances about 65 years ago. The exposure markers we identified – fingerprint Md15 and maternal diabetes history – could, however, be easily obtained in any group of adults. Confirmatory studies in other populations should be relatively easy to perform, and similar associations with insulin sensitivity or β-cell function using ‘clamp’ or other dynamic methods might support practical applications of these simple, inexpensive markers. In a clinical or epidemiological context, the exposure markers could possibly help identify specific defects in the control of adult glucose metabolism, select candidates for intensified prevention efforts or guide the choice of initial therapy following the onset of overt hyperglycemia.Reference Staten, Stern, Miller, Steffes and Campbell 50 , Reference Smith, Nathan and Arslanian 51 As fingerprint Md15 is available in childhood, this marker might also serve to identify young persons at risk of diminished β-cell function even before hyperglycemia occurs. From the perspective of developmental biology, confirming an association between fingerprint Md15 and insulin secretion may help focus the search for environmental factors that bear on fetal pancreatic growth and stabilization. The outcomes of such environmental studies might lead to prenatal strategies for optimizing β-cell function in adult life.
Acknowledgments
Drs Mariaelisa Graff and Yiling J. Cheng provided valuable technical assistance. Grant support was provided by the National Institutes of Health (HL067914 to LHL). The findings and conclusions in this report are those of the authors and do not necessarily represent the official position of the Centers for Disease Control and Prevention.
Statement of Interest
None.