We suggest a new theoretical framework that goes beyond extant dichotomous, typological, and continuous measure of dictatorship and democracy. While both typologies and continua are useful for varying research questions, we argue that extant regime measures miss critical variation in terms of executives' bases of power, by leadership appointment and dismissal. We argue that conceptually as well as empirically this variation is to a large extent independent of extant regime types/continua and in that sense, our theoretical framework cuts across them. We capture that variation by five dimensions, and show empirically that they are to varying degrees independent of extant regime measures. In addition, we show how the framework and the measures of it can shed new light on situations where the widely used selectorate theory’s predictions are wrong, and generate a set of novel hypothesis from those excursions.
The distinction between autocracies and democracies is probably the most widespread existing categorization of regimes. Yet since it glosses over vital variation in the underlying structure of regime types, the field has produced finer-grained typologies parsing different types of democracies and autocracies. For example, students of democracy often distinguish between presidential and parliamentary democracies,Footnote 1 commonly also allowing for the hybrid type of “semi-presidentialism.”Footnote 2 These precisions demonstrate that the ways in which chief executives are appointed to and dismissed from power (whether through direct elections or through the requirement of the legislature’s confidence) have important repercussions for political dynamics, economic performance, and even the survival of democracy.
Correspondingly, scholars observe that “different kinds of authoritarianism differ from each other as much as they differ from democracy,”Footnote 3 and accordingly distinguish alternatively between single-party, military, and personalist dictatorships;Footnote 4 civilian, military, and monarchical dictatorships;Footnote 5 closed dictatorships, hegemonic and competitive electoral authoritarian regimes;Footnote 6 or monarchical, military, single-party, multiparty, and no-party autocracies.Footnote 7 Again, distinctions between pathways to and dismissal from executive power are found consequential across a range of important outcomes, such as longevity, probability of democratic transitions, economic development, and prowess to civil war.Footnote 8
We argue that, regardless of whether one holds the view that the difference between democracy and dictatorship is a difference in kind or degree,Footnote 9 an unresolved issue is that both of these literatures ignore the other side of the crossroads. Is it really the case that authoritarian bases of executive power in terms of accession and dismissal are never relevant when analyzing democratic regimes, and footings typically found in democracies are never relevant for understanding autocracies? We argue that they are.
Consider, for example, Cheibub’sFootnote 10 theory of why presidential democracies are less long-lived than parliamentary. According to Cheibub, this is not because these democracies are presidential per se but because of a “military–presidential nexus” leading to presidentialism replacing military regimes. Yet, even if Cheibub’sFootnote 11 approach is based on a crisp distinction between democracy and dictatorship, the theory assumes that the military continues to be a political actor in democracies since this is key to explaining why presidential democracies superseding military dictatorships are less long-lived. We thus need to include authoritarian bases for executive power when analyzing democracies.
Seen from the other side of the divide, consider an autocracy dressed up like a democracy.Footnote 12 Also known as “hybrid regimes,”Footnote 13 “electoral authoritarianism,”Footnote 14 or “competitive authoritarian regimes,”Footnote 15 they allow for multiple parties to compete in seemingly democratic elections, but are due to different types of illicit tactics far from the democratic regime end of the continuum. Having many of the trappings of democracy, the extent to which hybrid regimes are of the presidential or the parliamentary type is surprisingly underexplored—not to mention the extent to which this matters for political dynamics, regime change, or survival. With notably few exceptions,Footnote 16 this question has never been seriously examined.
Our purpose is to address this problem by submitting a new theoretical framework that is relevant for the regimes writ large. We accomplish this by theorizing five bases of executive power, by appointment and dismissal: hereditary, military, ruling party, direct election, and confidence. We argue that these five dimensions are conceptually distinct—making it possible to measure them separately—and demonstrate empirically that a regime in a particular country and point in time may exhibit more than one basis for appointment or dismissal simultaneously. Hence, we do not propose another regime typology, but a theoretical framework of key regime dimensions that may be more or less present simultaneously in various polities at different points in time.Footnote 17 Drawing on data from the Varieties of Democracy project,Footnote 18 we provide theoretically justified measures of these five dimensions that are available for a global sample of 192 countries from 1789–2016. We compare and contrast these five continuous dimensions to extant typological approaches and demonstrate that the five dimensions provide a more encompassing understanding of the bases of executive power across regimes. Finally, we present three exploratory probes into three outcomes of interest—repression, corruption, and the survival of individual heads of state and government—showing that the well-established selectorate theoryFootnote 19 fails to account for important empirical outcomes. With the new framework we instead generate a novel set of hypotheses demonstrating the theoretical value added.
A Theoretical Framework: Five Bases of Executive Power, by Appointment and Dismissal
Our theoretical framework rests on two assumptions. First, we presume there are sovereign or semi-sovereign political units in need of some form of governmental structure functionally differentiated from the surrounding society.Footnote 20 Second, we assume that governments of these units are headed by an executive performing two central functions: (a) representing the state unit in relation to other state units; and (b) acting as the chief officer of the executive branch of government, typically by presiding over a cabinet responsible for the day-to-day governing. If these two functions, which we call the head of state (HOS) and the head of government (HOG) respectively, are performed by the same person the executive is unitary. The executive is nominally dual if the two functions are carried out by two different persons,Footnote 21 but taking the relative power of the HOS vis-à-vis the HOG into account, nominally dual systems may be unitary in practice.
Given these assumptions, we submit that five bases of executive power (or de facto dimensions of leadership selection) jointly account for most significant variation of executives not captured in extant typologies/interval regime measures. Across the five dimensions, we hold as a general dictum that appointment rules should be given equal status to dismissal rules,Footnote 22 although for measurement purposes we cannot always incorporate both aspects. In the following, we theorize the distinguishing features of each dimension in the framework, treated here in their “ideal-type” condition.
Hereditary Dimension
Hereditary succession is invoked when lineage or bloodline is a basis for accession to executive power. The clearest instance is inheritance of the throne in monarchies, such as through primogeniture (from father to son) or agnatic seniority (from brother to eldest brother).Footnote 23 But a decision within a royal family, as is typically practiced in today’s Gulf monarchies, also scores high on the hereditary dimension as long as bloodline to the former chief executive is the basis for the succession order.Footnote 24 The historically quite common practice of electing kings (in the Holy Roman Empire, for example) highlights the fact that monarchies are not necessarily based on hereditary succession.Footnote 25
By definition, hereditary succession implies tenure for life, even if in practice a monarch can step down and hand over to the successor before actually passing away. At first glance this would seem to imply that the hereditary dimension only applies to the appointment, not the dismissal, of the executive. What should matter for the behavior of the holder of executive office, however, is whether he or she expects ex ante to be replaced by hereditary succession after having deceased.Footnote 26 In effect, hereditary succession is thus more important as a dismissal than as an appointment rule. This also affects how we treat contemporary examples of de facto hereditary succession from father to son, such as the Alievs in Azerbaijan or the al-Assads in Syria,Footnote 27 where the basis of bloodline is not invoked explicitly and hence cannot be assumed to form the expectation for the future. Accordingly, these cases do not score high on the dimension of hereditary succession.Footnote 28
The Military Dimension
This dimension comes into play to the extent that appointment or the dismissal of the executive is based on the threat or actual use of force.Footnote 29 The most obvious example of this in action is a military coup d’état. The military is archetypally controlling the vast majority of the monopoly of violence bestowing the state with internal sovereignty. It is typically directly or indirectly involved in any successful coup whether a violent takeover staged by the military itself, or headed by a civilian (or a group of civilians) with some level of tacit approval of the military.Footnote 30
Executive appointment can also be based on a threat of force highlighting the fact that the military, the security apparatus, or other actors with high capacity to use of force can to varying degrees rule behind the scenes, occasionally controlling seemingly peaceful and regular alternations of civilians at the helm of the executive.Footnote 31 One might even argue that “violence is an ever-present and ultimate arbiter of conflicts in authoritarian politics”,Footnote 32 and from that deduce that any other basis of power for leadership appointment and dismissal could always be overruled (or always need to be undergirded) by force. Yet that would arguably be overstretching it. A substantial number of peaceful leadership successions in the world occur without an engaged consent by the military, security agencies, or other such institutions, even in autocratic regimes.Footnote 33 In order to score on the military dimension, we therefore impose that the military as an institution must either (a) be directly involved in the staging of a coup or (b) to some degree actively control the appointment or dismissal of the executive.
Ruling Party Dimension
The ruling, or single-party, dimension applies to the extent that appointment or dismissal of the executive is to some degree influenced by the rank-and-file of a (de facto) single or dominant political party, defined as “an organization that pursues a goal of placing its avowed representatives in government positions”.Footnote 34 It is important to note this does not require internal party democracy. To the contrary, this dimension materialized in its extreme is the Leninist democratic-centralist party in which higher ranks de facto control lower levels of the organization, and where all other parties are banned. Yet as the case of South Africa makes clear, a de facto dominant party is compatible with multiparty elections, universal suffrage, and even modestly clean elections. While obviously incompatible with full democracy, executive appointment and dismissal can thus be characterized by the ruling party dimension to varying degrees across regimes.
The typical appointment procedure captured by the ruling party dimension is based on the tacit approval by a congress of party members, or a select group of party minions at the top level.Footnote 35 The criterion of direct appointment is important, however. This distances the dimension from settings in which nominations of candidates by a party leadership is confirmed by the electorate. Barring term limits, direct appointment in this dimension also implies powers of dismissal. If the party can appoint the incumbent’s successor without restraint, by implication it can also dismiss the incumbent.
Direct Election Dimension
This dimension captures the extent to which the executive’s basis of power is dependent on being directly elected by the population, or indirectly if the intermediate electoral college performs a mechanical function by weighing votes differently across constituencies, such as in the United States.Footnote 36 Second, the “by the population” requirement precludes (direct) election by an intermediate body, as in many medieval electoral monarchies for example. Finally, we define “elections” minimally and require nothing in terms of the share of the population that is entitled to vote, nor in terms of the competitiveness or fairness of the election process. Thus this dimensions is also applicable across the regime spectrum.
Since very few presidents get elected for life,Footnote 37 one could argue that appointment through direct election implies an expectation of continued appointment through direct election, and that there is therefore also the possibility of dismissal through direct election. However, since extremely few states in the world practices executive recall elections at the national level,Footnote 38 we maintain that the direct election dimension in practice only applies to executive appointment.
Confidence Dimension
This dimension applies to the extent that the executive’s survival in office rests on the confidence of a legislature. The confidence requirement can be institutionalized in several different ways. One version is the investiture vote cast when a cabinet is appointed. Another is the vote of no confidence by a legislative majority (or plurality) forcing the executive to step down. Some systems also allow for a motion from the floor of the legislature or initiatives of the government itself leading to removal from office.Footnote 39 Although constitutive in definitions of parliamentarism typically associated only with democracies,Footnote 40 it can also be found to varying degrees as a de facto basis for executive power in other regimes as long as they have legislatures.
The key characteristic captured by this fifth dimension when it is fully developed is thus that a legislature has power to dismiss the executive, should it wish to do so. Implicit approval by the legislature in the appointment of the executive is not enough, unless it is accompanied by the unequivocal power to dismiss. This excludes the standard impeachment procedure, which by definition implies only a conditional power to dismiss the executive, for example on grounds of serious crime. Symmetric to the dimension of direct election, the nature of procedure through which the legislature itself is elected is irrelevant to the definition. The legislature may thus be elected in single- or multiparty, competitive or sham elections, or be appointed. Again, there is no necessary relationship to extant regime types or continua.
When this dimension is fully realized, the prototypical executive subject to confidence is dual, and the vote of (no) confidence applies to a head of government who is not simultaneously head of state. But this dimension may apply also to unified executives.Footnote 41 This brings “semi-presidentialism” to the fore, typically defined as some combination of a directly elected head of state (“president”) and a head of government (“prime minister/premier”) ruling on the basis of confidence.Footnote 42 This also exemplifies that more than one dimension usually applies to a varying degree in specific regimes, and clearly delineating the bases for executive power by appointment and dismissal, as in the present framework, precisely allows for identifying such dispensations.
The Residual
There are some rare bases for appointment and dismissal not captured by this theoretical framework. Switzerland, for example, has a unique executive that, apart from being collective, can be characterized as the negation of all of the five bases captured by the dimensions above. The Swiss Federal Council is certainly not hereditary; it is not imposed by the threatened or actual use of force by the military; it does not emanate from the echelons of a ruling party; it is not directly elected by popular vote; and it cannot be voted out of office by a vote of censure or no confidence by the legislature.Footnote 43 Instead, the Swiss “grand coalition” is formed by the four largest parties in the bicameral legislature with the presidency strictly rotating on a year-to-year basis.Footnote 44 We shall treat the Swiss system as sui generis together with a mixed bag of a few other uniquely devised executives and “institutionless polities”Footnote 45 where none of the five dimensions apply, such as Nazi Germany and Mussolini’s Italy, and thus refrain from theorizing this (small group) further.Footnote 46
Data and Measurement
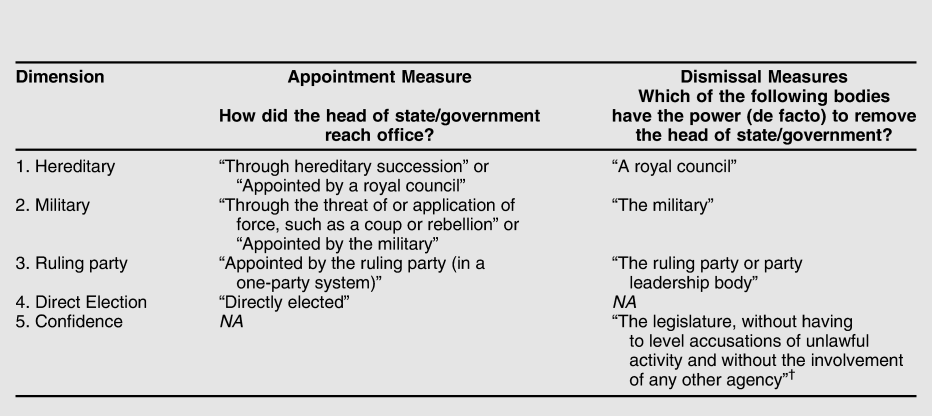
To operationalize the theoretical framework of five dimensions, we rely on data from Varieties of Democracy (V-Dem). The V-Dem dataset (v7.1) covers 178 country units (sovereign or semi-sovereign territories) from 1900 to 2016,Footnote 47 but by also including the historical V-Dem dataset we incorporate data on 81 units from 1789.Footnote 48 Table 1 provides an overview of the indicators (questions and response categories) used to measure each dimension. As advised earlier, the direct election dimension is meaningfully measured only through appointment, whereas the confidence dimension only applies to dismissal. The three remaining dimensions have measures of both appointment and dismissal. To allow both sides of the dimensions to come into play, we then use the average of the two. All measures are scaled to range from 0 to 1.Footnote 49 In nominally dual systems, where the head of state and the head of government are not the same individual, V-Dem provides data separately for the HOS and the HOG. The dataset includes information, including names and titles, of 3,937 individual HOSs and 2,874 HOGs (as well as for 196 leaders who have served as both HOS and HOG). We determine the relative power of the HOS vis-a-vis the HOG by comparing the two executives’ power over the appointment and dismissal of cabinet ministers (refer to the online appendix A for details on question wording). We then aggregate across the two executives by taking the average weighted by their relative powers over cabinet formation and dismissal.
Measuring the five dimensions.

† Refer to online appendix A on the variables v2exremhsp/v2exremhog for the exact question wording for the confidence measure.
The dimensions can be simultaneously manifest to varying degrees at any particular time in a political unit. In principle, one could imagine an executive with a directly elected monarch that could be deposed alternatively by the royal house, the military, a ruling party, and through a vote of no confidence in the legislature, although this extreme is nowhere to be found in practice. As shown in online appendix D, empirical patterns confirm that the dimensions are only modestly negatively correlated, and that executives typically score to some degree on several of them. The hereditary dimension is negatively correlated with the others in the range of –.16 (with the military) to –.26 (with the confidence dimension). Other than that, correlations are indisputably weak with the next strongest correlation between the direct election and confidence dimensions at –.09. Thus, the dimensions are both conceptually distinct, and by and large empirically independent of each other.
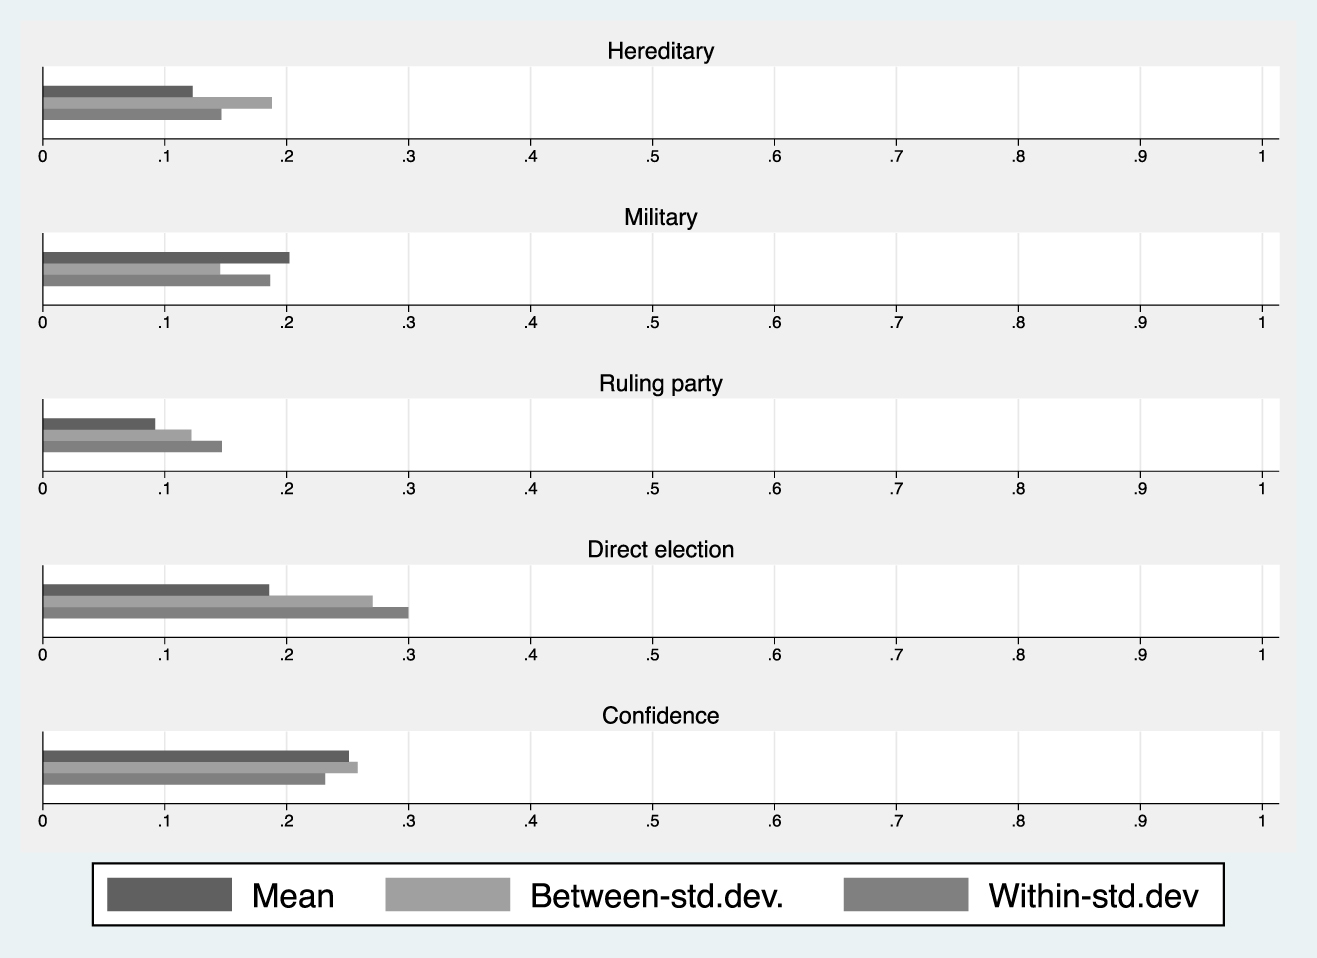
In Figure 1, we present summary statistics for the five measures from 1789–2016.Footnote 50 The separate horizontal bar graphs for each displays their mean, between-, and within-country variation, respectively. In terms of prevalence across the last two centuries, the ruling party dimension has been the least present basis for executive power by appointment and dismissal, by a small margin trumped by the hereditary dimension. The military and direct election dimensions have both been more prominent, while perhaps somewhat surprisingly, the most prevalent dimension has been the confidence requirement. These overall averages mask huge amounts of variation both within and among countries, however. Particularly noteworthy is the variation within countries, which for all dimensions except the hereditary is on par with or larger than the between-country variation. There is thus ample variability to explore with these measures also when country-fixed effects are taken into account.
Descriptive statistics of five regime dimensions
Note: Number of observations: 23,439; number of countries: 192; average number of years per country: 122.

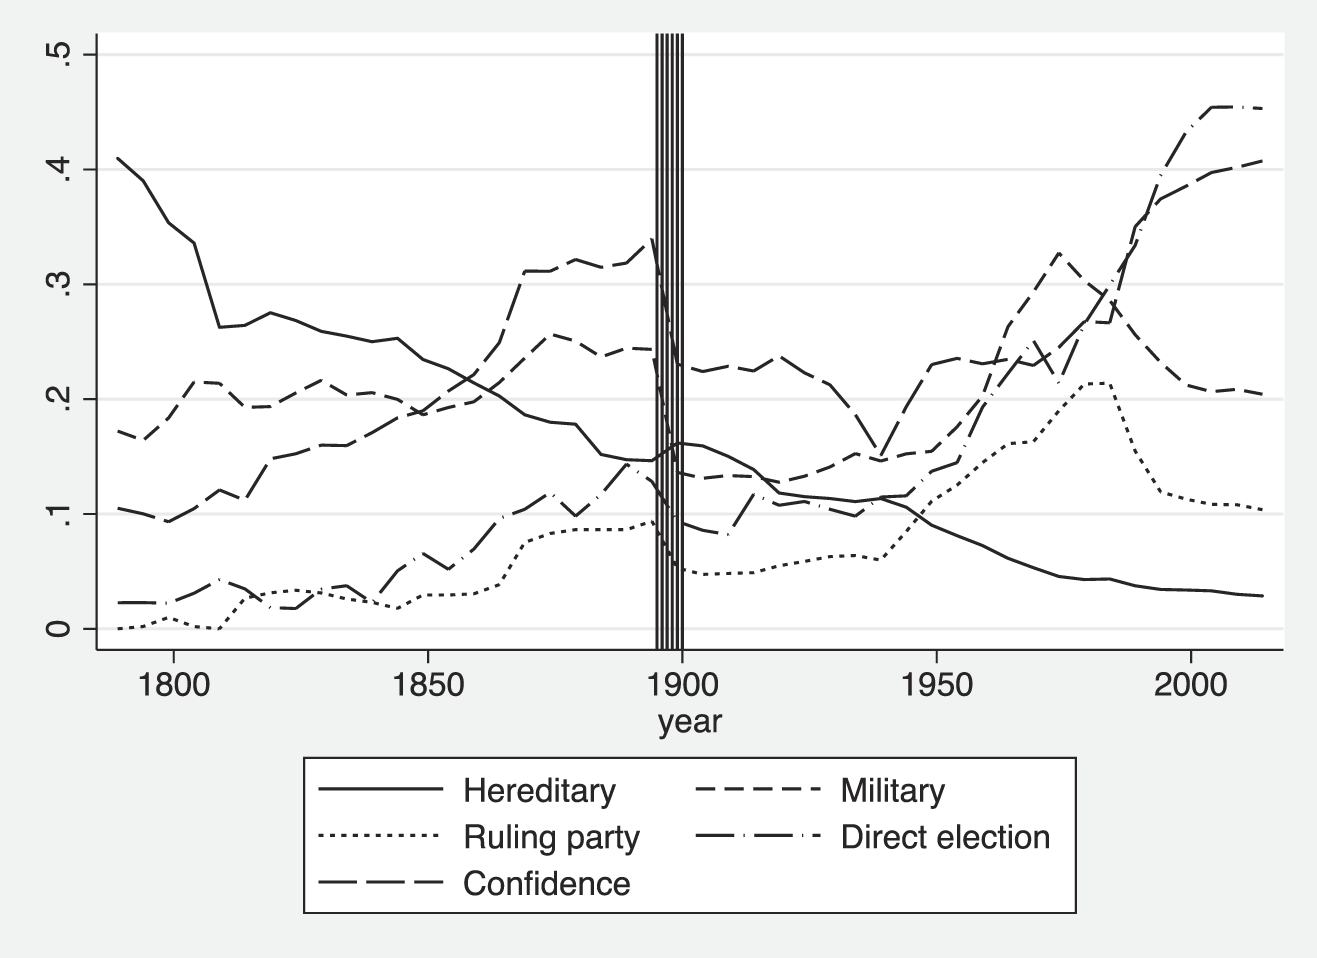
Figure 2 displays the global development since the French revolution (smoothed by 5-year averages). Since V-Dem covers a much larger sample of countries from the beginning of the twentieth century than the historical V-Dem sample in the nineteenth century, the graph is split at the year 1900. Levels should thus only be compared before or after that split, but the general trends are not sensitive to this. As should be expected, there has been a decline in the prevalence of hereditary succession, and a steady uptake in executives scoring higher on direct election and the confidence requirement, particularly in the last decades. Direct election is today the most prevalent of all dimensions. Both the military and ruling party dimensions as bases of executive power have been in decline over the last decades. Naturally, such trends hide significant spatial variation across the world. As shown in online appendix E, the military dimension has been most present in the Americas and Africa, whereas hereditary rule has dominated in Europe and Asia. Similarly, direct election is more prevalent in the Americas, the confidence requirement in Europe. Party rule displays no clear pattern of regional variation.
Global trends, 1789–2016
Note: Lines display global means aggregated at 5-year intervals; the vertical lines at 1895–1900 mark where the historical V-Dem country sample shifts to the contemporary V-Dem country sample.

Comparison with Extant Regime Typologies
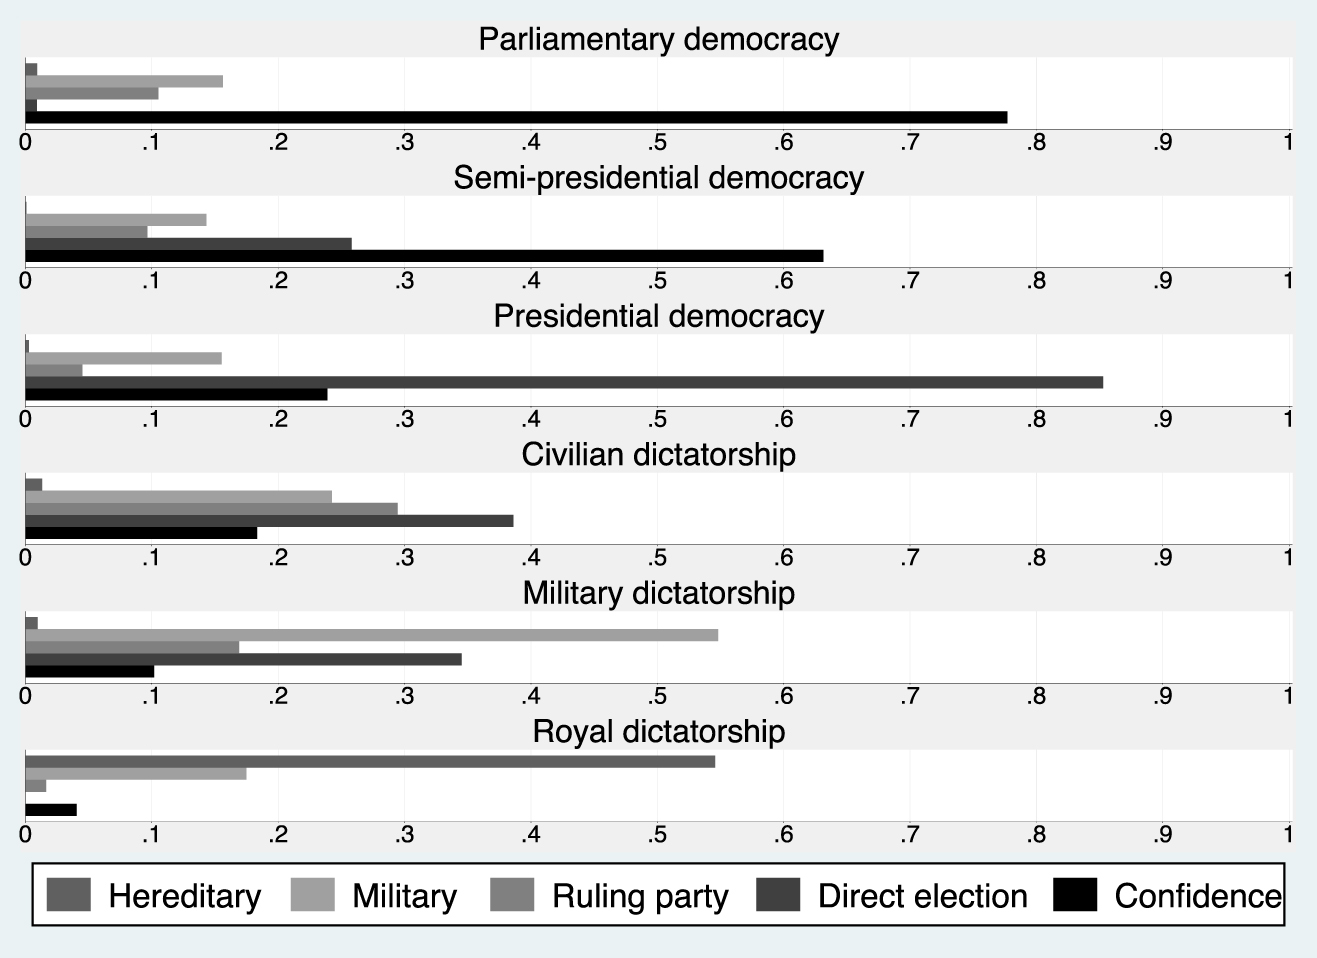
We now turn to an exploration of how our dimensional measures compare to extant regime typologies. In Figure 3, we map our five dimensions onto the six categories of Cheibub, Gandhi, and Vreeland,Footnote 51 which is the classification scheme closest in spirit to ours. The general patterns mostly confirm that our regime dimensions are picking up what they are expected to: the confidence dimension is strongest in parliamentary democracies, direct election in presidential democracies, the military dimension in military dictatorships, and hereditary succession in monarchies. The patterns also show that semi-presidential democracies are dominated by the combination of direct election and the confidence requirement, as expected, interestingly with the latter being most prevalent. The ruling party dimension is also most prevalent in civilian dictatorships, but this category is even more marked by the presence of direct election.
Comparison to Cheibub, Gandhi and Vreeland, 1946–2008
Note: No of observations: 8,071; no of countries: 170; average no of years per country: 47.

A comparison with the Geddes, Wright, and FrankFootnote 52 typology (refer to online appendix F) supports the same general conclusion, with the addition that personalist regimes, not surprisingly, rely on a mixture of military force and direct elections. These patterns speak to the congruent validity of our measures.Footnote 53
Critically, these comparisons also expose important differences that speak to the added value of the theoretical framework suggested here. Notably, there is still important variation in the prevalence of our dimensions within each of the extant regime categories. This demonstrates the tendency among extant typologies to collapse multiple, conceptually different dimensions of both authoritarian and democratic politics into mutually exclusive categories.Footnote 54 We can now reveal hitherto unexplored patterns depicted in Figure 3, such as the military presence in all three types of democracies, or the co-existence of military rule, ruling party dominance, direct elections, and confidence requirements in “civilian dictatorships” or “party regimes.”Footnote 55
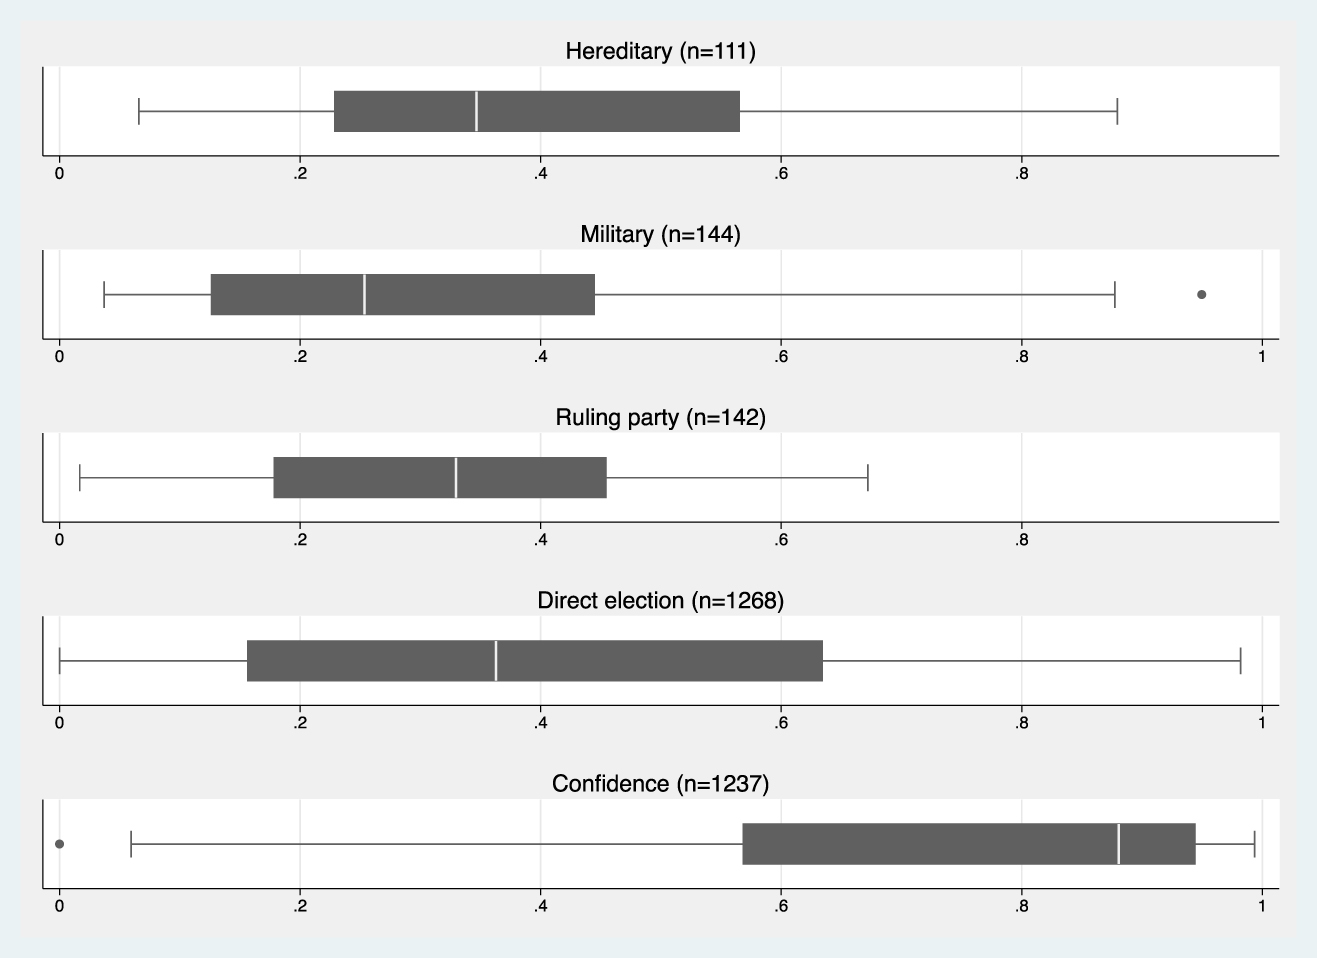
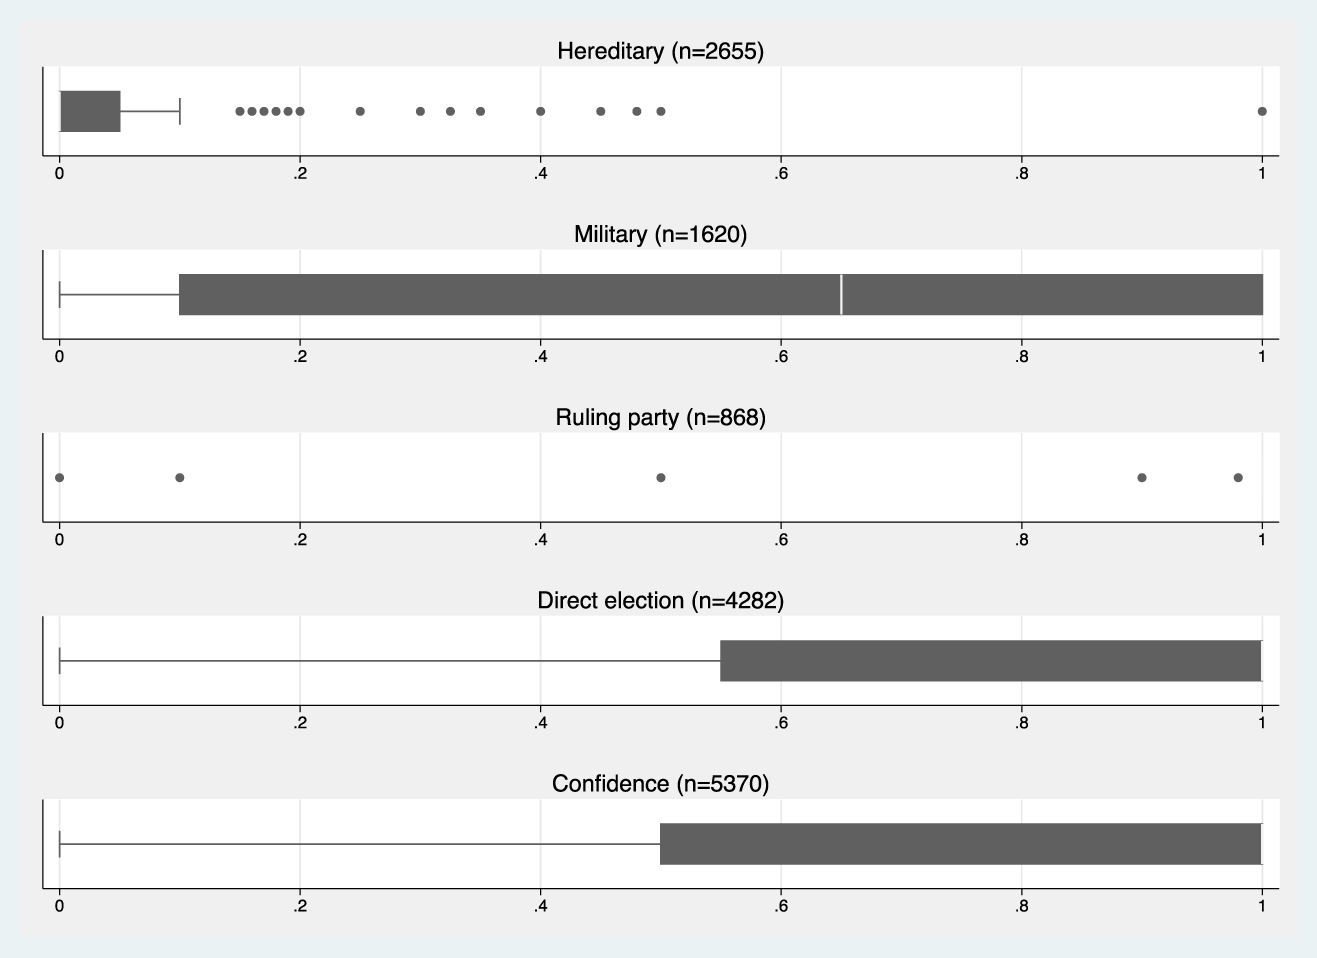
Second, and by implication, our five dimensions of the bases of executive power by appointment and dismissal are present on both sides of the crisp divide between democracies and dictatorships that part of the literature depends on. As is further illustrated in figures 4 and 5, this also applies across the regime continua that adherents of continuous approaches prefer. These box plots show how two core aspects of electoral democracy, or “polyarchy”,Footnote 56 vary within and between observations covered by our five regime dimensions. For purposes of expositional clarity we rely here on dichotomized versions of our five dimensional measures, only taking executive appointment into account, which means we are effectively underestimating the extent to which our measures cover overlapping segments of the democracy-dictatorship continuum. Figure 4 shows how elections, to the extent they are at all held, are generally less free and fair when executives are appointed through military force. Less self-evident, however, is that elections under directly elected executives are about as marred by fraud when hereditary succession dominates as when executives are elected according to the ruling-party mechanism. Even more importantly, there is great variation in election integrity under the presence of each of our dimensions, and large overlap in how free and fair elections are across them. The only elections that really stand out in terms of freedom and fairness are the ones held under an executive subject to the confidence requirement. With this major exception, the measures we propose here thus evidently captures important variation in dimensions of bases of power of executives in both more authoritarian and more democratic settings.
Free and fair elections, 1789–2016
Note: To allow dichotomous classifications the first four dimensions have here been measured by appointment only, the confidence requirement after collapsing the ordinal scale at the category “yes” (1<); n refers to the number of elections covered by each dimension when set to 1. The shaded boxes depict the 25th and 75th percentile of the each variables distribution, the vertical white stripe inside boxes the median, the whiskers the upper and lower adjacent values (extending two thirds the width of each box). Observations marked with a dot are extreme values.

Extension of the suffrage, 1789–2016
Note: See note under Figure 4; n however here refers to the number of country years covered for each dimension when set to 1. The reason that no box appears for ruling party is that both its median and 25th percentile is at 1.

With respect to suffrage, showed in Figure 5, the overlap is less pronounced with executives appointed through hereditary succession typically residing over very restricted electorates, whereas party rule almost without exception implies universal suffrage (hence, the “box” here is outside the range of the figure to the right). As the broad boxes for the other three dimensions show, however, one cannot assume that certain regime dimensions are predestined to coincide with the democratic principle of full participation (suffrage). The military principle dimension illustrates this most clearly, with suffrage extensions ranging from the very limited to universal, but the range is almost the same within regimes ruled by executives relying more on the confidence requirement as those where the direct election dimension is strong.
As a final point distinguishing our measures from extant typologies, the length of our time-series is unprecedented: approximately four times longer than that of Cheibub, Gandhi and VreelandFootnote 57 and Geddes, Wright, and Frank,Footnote 58 and about twice as long as that of Archigos.Footnote 59 Research on issues such as how leaders select policy, the effect on their survival and on other outcomes of interest, can now be explored going all the way back to the late eighteenth century.
Exploratory Probes
We now turn to some systematic probes of the five dimensions' value added by approaching the determinants of repression, rent-seeking or corruption, and leadership survival. These have been chosen in order to present different important policy outcomes across democratic and authoritarian regimes where some reasonable theoretical expectations can be drawn from the widely accepted selectorate theory of Bueno de Mesquita et al.Footnote 60 This theory relies on only two regime dimensions: the size of the selectorate (S) and the size of the winning coalition (W). But the authors also argue that “all nominal regime types” can be mapped onto this two-dimensional space. In effect they argue that both monarchies and military regimes have both a small S and a small W; that single-party regimes have a large S and small W; that presidential regimes have a large S and a W at around .5; and that parliamentary regimes have a similarly large S but a W of less than .5.Footnote 61 We do not measure such distinct, mutually exclusive, regime types but instead dimensions of the power-base of executives in terms of both appointment and dismissal that can (in principle) be present simultaneously to varying degrees. Yet we can derive expectations from selectorate theory on how our measures should perform in explaining the three outcomes of interest. This also leads to identification of some empirical anomalies that cannot be easily resolved with the selectorate theory, generating a set of new hypotheses congruent with descriptive analysis of global data covering 228 years in these probes. This also arguably demonstrates the theoretical importance and potential of the theoretical framework proposed here.
To maximize the number of valid observations, and since the analyses that follow should mainly be seen as exploratory probes, the outcome measures are also taken from the V-Dem data, but (with the partial exception of corruption) from other than the executives survey.Footnote 62 We systematically control for three auxiliary conditions: whether the executive is unified or nominally dual; the measure of the relative power of the HOS vis-à-vis the HOG; and the presence of foreign rule.Footnote 63 To handle the potential overlap between the confidence dimension and the “assembly-independent” regimes such as SwitzerlandFootnote 64 constituting most of the residual, we also control for a measure of whether the executive was appointed by the legislature, or whether the legislature’s approval was necessary for the appointment of the executive. Finally, we control for the two key aspects of democracy used in the earlier analysis to show that the dimensions cuts across democracy and autocracy: the extension of the suffrage and the fairness of elections. We thus control for both inclusion and contestation, in Dahl’sFootnote 65 famous diction. Unless noted otherwise, tests are based on time series of up to 228 years within 192 political units.
Repression
Following Bueno de Mesquita et al.Footnote 66, the smaller W (winning coalition), in particular in relation to S (size of the selectorate), the less executives can rely on the loyalty of their supporters, and the more they must coerce their acquiescence. “In summary”, write Bueno de Mesquita et al.
systems with a small winning coalition and a large selectorate encourage oppression, both in intensity and magnitude. Such systems present a greater incentive to challenge the leader, a greater incentive for the leader to hang onto power by all possible means, a greater possibility to recruit those who will carry out the threats, and greater credibility because of the longer tenure of their leaders.Footnote 67
Since, as noted previously, the ruling party dimension should correspond to the smallest W in relation to S, it should be expected to have the strongest (positive) effect on repression. Executives relying to a greater degree on the hereditary succession or the military dimensions, by contrast, have both a small W and S, and should thus use less repression than when the ruling party dimension dominates, yet more than rulers who are directly elected or rely more on the confidence dimension. Finally, since W is typically larger for directly elected executives who have to win a majority of votes, than for executives dependent on confidence associated with minority governments,Footnote 68 selectorate theory predicts the direct election dimension to result in less repression compared to the confidence dimension.
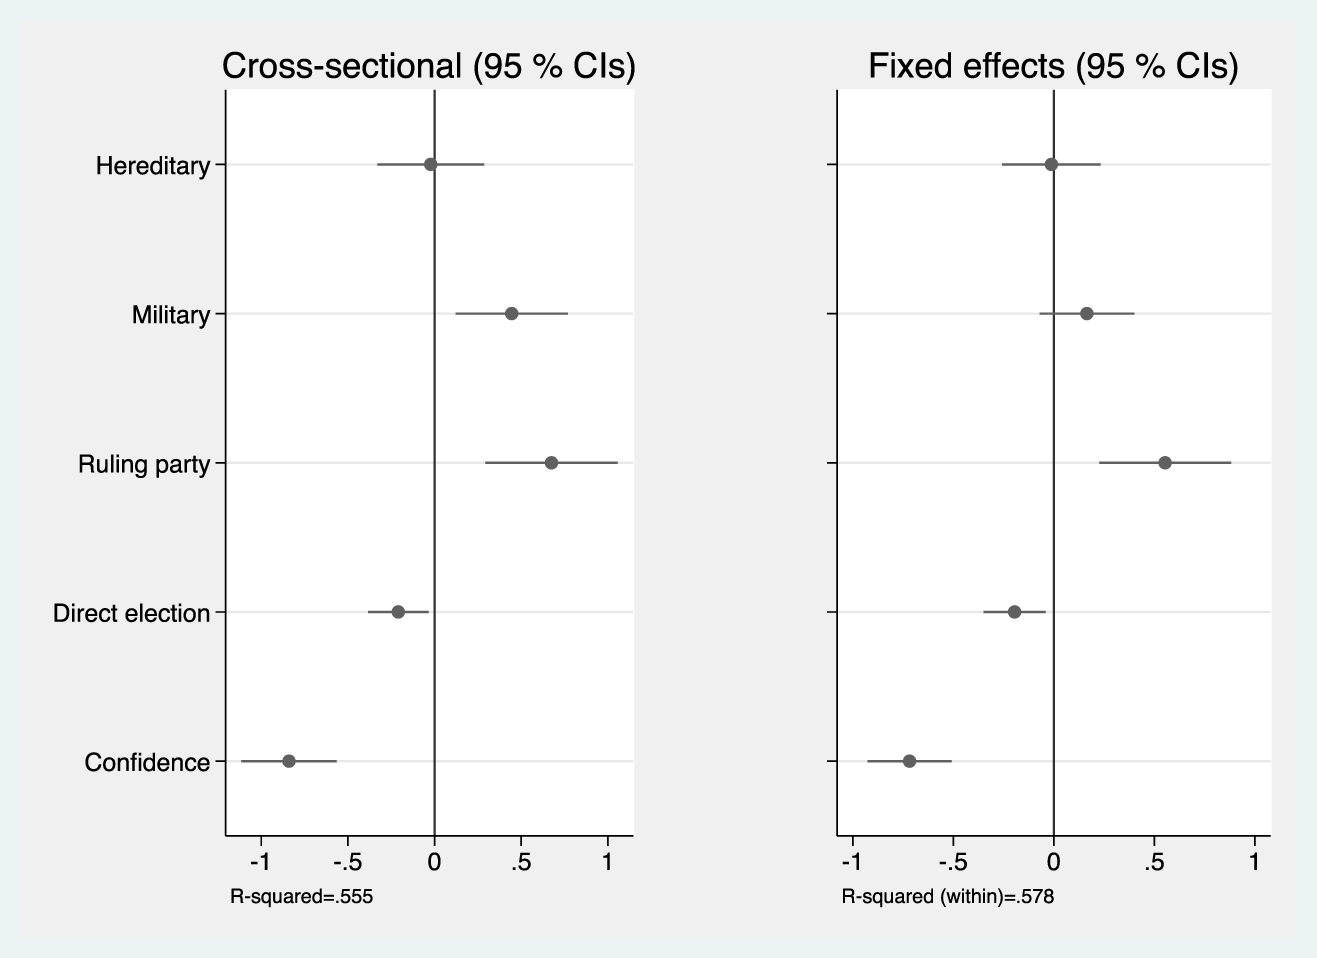
Figure 6 presents results from two basic specifications (the complete results are found in online appendix H). First, a simple cross-country regression pooling across all years and country units, with robust standard errors clustered on the latter, shows the descriptive relationships to repression.Footnote 69 The second panel has country- and year-fixed effects added. Although still another descriptive summary of differences between the dimensions, this test thus puts emphasis on within-country variation over time (while also controlling for the possibility of co-trending in the dimensions and the outcome).
Levels of repression, 1789–2016
Note: Regression coefficients, without (left-hand panel) and including (right-hand) country- and year-fixed effects, with controls as discussed in the text above. No of observations: 22,782; no of countries: 192.

The selectorate theory prediction that executives dominated by a ruling party are more repressive is supported by the data in both panels. While neither the military nor the hereditary dimension are statistically significantly related to the use of repression (when country-fixed effects are applied), the relative size of the coefficients among the three are in accordance with selectorate theory. What this theory fails to predict, however, is the less repressive nature of executives scoring high on the confidence compared to the direct elections dimension. Note that levels of “democracy” does not explain this difference since both the extension of the suffrage and freedom and fairness of elections are used as controls. This presents a puzzle, but one that we suggest opens up for formulating a new hypothesis. There is an extensive literatureFootnote 70 on differences between the winner-takes-all logic of directly elected executives (typically presidential systems) and the consensus-building logic encouraging compromise in the legislature to ascertain a legislative majority in systems dominated by the confidence dimension (typically parliamentary systems). The costs of losing a direct election with 50 percent minus one vote are exceedingly high. The incumbent holding executive office as well as all political appointees, associated staff, and political allies risk losing everything they have in terms of influence and gains from office. Even the slightest threat to the hold on to power (not only the extreme situation of a one-vote difference) thus should present strong incentives to use repressive tactics to avert this hazard. Even if the person holding executive office may not be so inclined, strong pressures should come from all those dependent on that person staying in office.
In a regime where the confidence dimension scores high, the incentives from gains and losses in the legislature should be much less dramatic. Legislative majorities can typically be achieved by several constellations and, via the committee system with iterative deliberation over multiple issue-areas, most groups/parties can usually sustain some status, influence, and other gains. Even in authoritarian settings, the bargaining and relative gains potential of legislatures has been shown to be used as an alternative to repression.Footnote 71 Hence, in contrast to the prediction from the established selectorate theory, we hypothesize that the need to repress rivals is diminished in systems dominated by the confidence requirement compared to the direct election dimension.
Corruption
Turning next to rent-seeking or corruption,Footnote 72 selectorate theory predicts that executives founded by small winning coalitions (W) will have fewer incentives to reduce corruption, and might even endorse corruption as a way of rewarding supporters, particularly when S is large. By implication, when the power basis of an executive score high on the ruling party dimension, it should be more corrupt than when relying more on hereditary succession or the military. Moreover, those scoring high on the confidence requirement should also be expected to be more corrupt than directly elected executives.Footnote 73
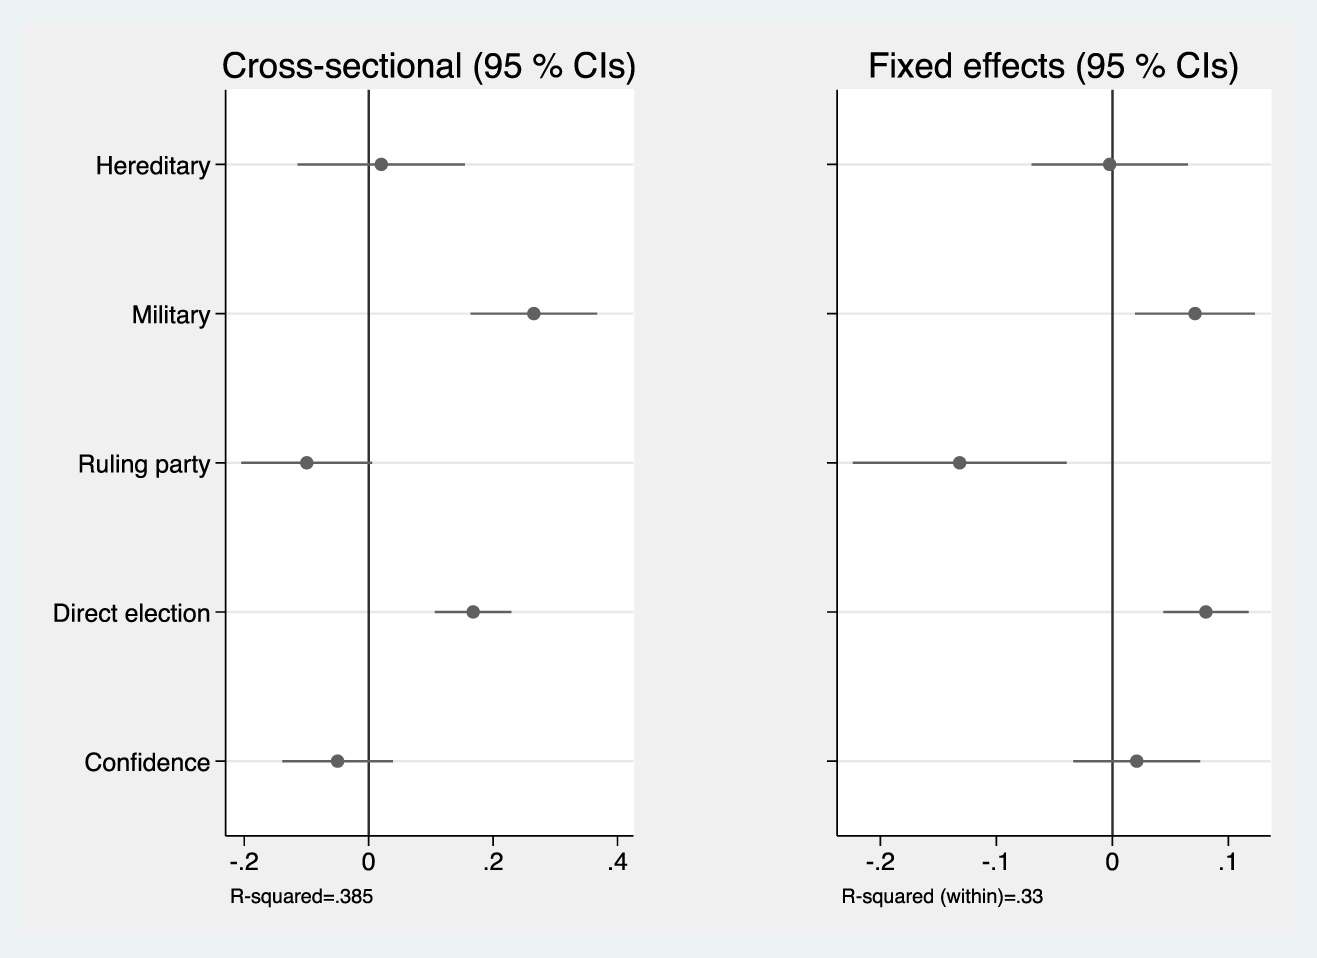
The results in Figure 7 run counter to selectorate theory predictions. While executives heavily dependent on the military have small winning coalitions and also appear to be more corrupt on average, according to Bueno de Mesquita et al.Footnote 74 they have larger W relative to S than executives more dependent on the ruling party dimension, yet the latter are significantly less corrupt on average (when country-fixed effects are applied). Selectorate theory can neither explain why executives scoring high on the hereditary dimension do not have a similar effect on corruption to those scoring high on the military dimension when they have a similar W/S ratio. Finally, and again contrary to expectations generated by the established selectorate theory, executives where the direct election dimension is prevailing display a significant positive influence on corruption, whereas executives relying more on confidence are neither more nor less corrupt on average. In conclusion, the perhaps most established theory seems to fail the test on almost all accounts.
Levels of corruption, 1789–2016
Note: Same as for Fig. 6 above. No of observations: 22,549; no of countries: 192.

Amongst others, Charron and LapuenteFootnote 75 suggest an intuition for the anomaly regarding executives more dependent on the military: these are typically short-lived (discussed later). Another consistent findingFootnote 76 is that one of the strongest predictors of military coups is the past number of coups in that country. Hence, it seems reasonable to hypothesize that executives scoring high on the military dimension would necessarily lead to shorter time-horizons than both their single-party and hereditary counterparts. Therefore their motivations to loot and amass as much wealth as possible in the short-term by corrupt acts are greater. The short duration and the fact that executives more dependent on the military are frequently overthrown by actors from within their own ranks also suggests a lack of the kind of loyalty that can be mustered using a guiding ideology that ruling party executives often can provide, or a foundational myth that lineage traditions usually have. This provides intuition for another hypothesis: that executives have strong incentives to allow others in “the selectorate” to be corrupt as a way of buying the loyalty they need, when they depend more on military force to stay in power.
Regarding the failure of selectorate theory to predict the higher levels of corruption in systems where the direct-election dimension dominates, a plausible intuition comes from Gerring et al.’sFootnote 77 conjecture that in the absence of a directly elected president, legislatures function as coordination devices that can thus help actors solve the collection-action problem of corruption.Footnote 78 The literature on presidential versus parliamentary systems (referred to in the earlier introduction) also provides additional intuitions about differences in incentives and possibilities for corruption. The differences in opportunities stem from the dominance of the directly elected executive, with vast influence over most issue-areas, that often comes with a large number of political appointees who are personally dependent on being in favor with the executive. The incentives stem from the same fact, making the directly elected executive more incentivized to accept corruption among those who are loyal, to avoid the high-stake risk of losing everything. Following the reasoning presented about the nature of winner-takes-all distinct to executives scoring very high on the direct election dimension (and in some ways reminiscent of executives dependent on the military) thus leads us to hypothesize that both incentives and opportunities for corruption should be greater in these executives than in the ones dominated by the confidence dimension. This is another building block in future theory-building that our probes based on the theoretical framework of executive appointment and dismissal provides.
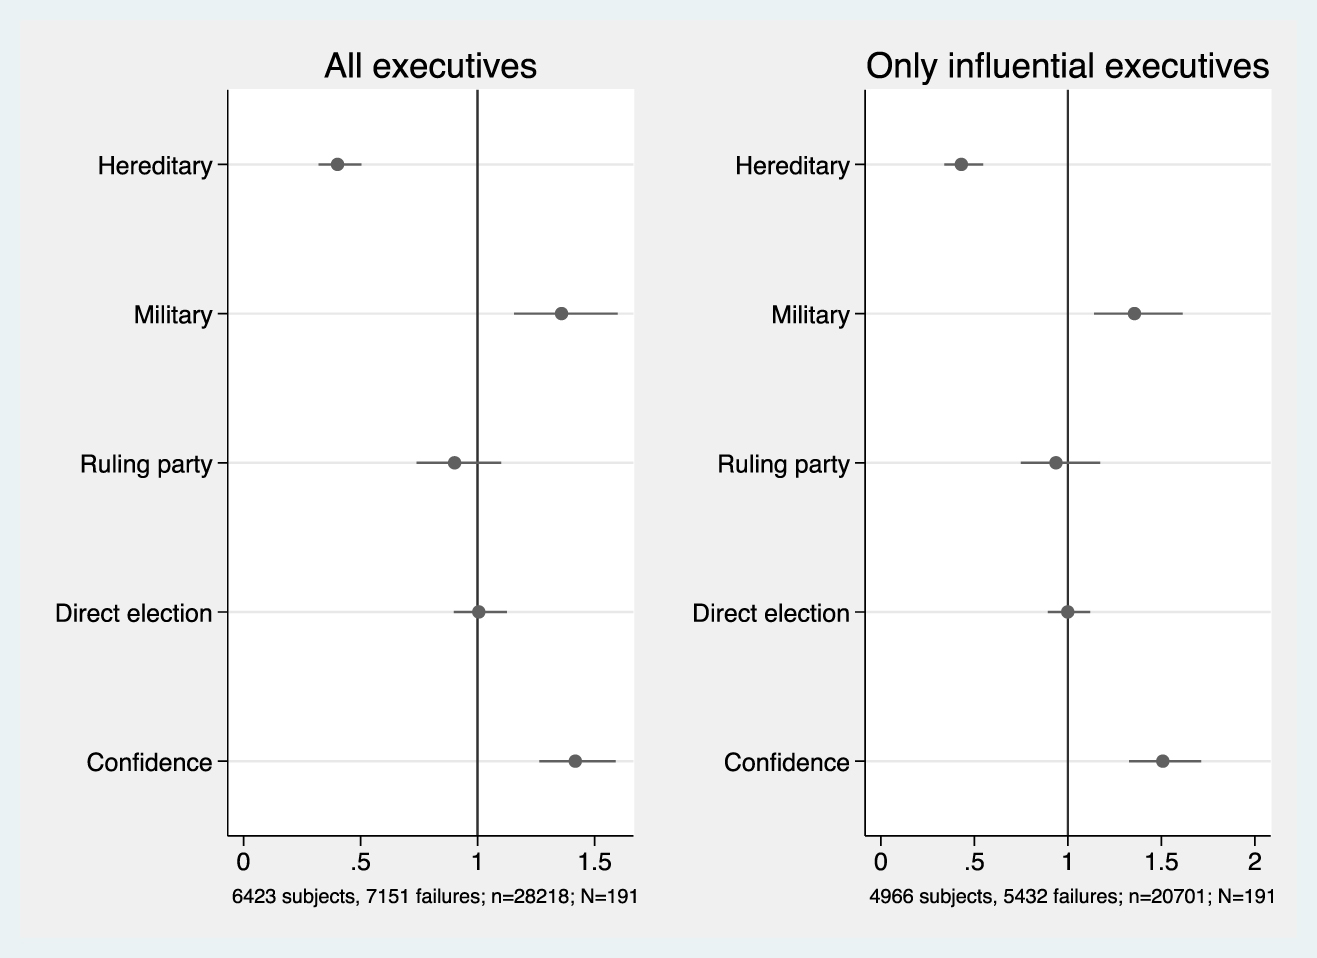
Survival
As a final exploratory probe we turn to the survival of executives in office. Figure 8 presents the results of two Cox proportional hazards models, one including all executives, the other excluding executives with no power over the appointment or dismissal of cabinet ministers. Since the individual executive is the unit of interest in this analysis, HOSs and HOGs are entered separately, but by also taking into account whether the executive is nominally dual and the relative powers of HOSs and HOGs, we also control for that feature of the data.Footnote 79 As an additional check on country-specific sources of variance, standard errors are cluster by country.

Selectorate theory predicts that executives with small W should enjoy longer tenure,Footnote 80 but this holds only for the hereditary dimension that seems to be associated with the most long-tenured executives by far. Executives scoring higher on the military dimension as a basis for power, by contrast, are significantly less durable on average despite predictions from selectorate theory. Contrary to previous studies,Footnote 81 we do not find that scoring high on the strong party-rule dimension makes executives more secure in their seat. Rather, scoring higher on party rule as the basis for appointment and dismissal has no significant influence on survival in office. The latter turns out to be a function of the unprecedented length of time the new data covers. Restricting the sample to the twentieth century only, akin to previous studies, the hazard ratio for ruling party executives is significantly lower than 1 (implying longer duration of rule; refer to online appendix table H2, model 3). We therefor hypothesize that longevity is not related to the size of W, but in the case of executives strong on the hereditary dimension it is rather a function of the comparative advantage this system enjoys in terms of solving the problem of leadership succession.Footnote 82
Building on the intuition and extant findings about executives where the military mostly decide appointment and dismissal, we hypothesize that the nature of the underlying logic where force is the main arbitrator is also the reason for instability. The more the force has been used efficaciously to assert executive power, the more likely it should be to reoccur, in an almost self-reinforcing manner. Thus, the reasoning here regarding differences stemming from the hereditary and military dimensions produces a set of predictions different from selectorate theory, but that are congruent with the descriptive data at hand.Footnote 83
Conclusion
We provide a new theoretical framework of five dimensions for appointing and dismissing the executive that cut across the democracy-autocracy regime spectrum: first, the hereditary dimension, where the executive is appointed for life-long service based on bloodline; second, the military dimension, where either the executive is directly appointed by the military, or where the survival of the executive is actively controlled by the military through the actual or threatened use of force; third, the ruling party dimension, where the executive directly emerges from or can be dismissed by the rank-and-file of a party organization; fourth, the directly elected dimension, where the executive is directly and popularly elected; and fifth, the confidence dimension, where executive dismissal is based on the confidence of the legislature.
We propose novel measures of these five dimensions based on de facto procedures for appointing and on tacit powers to dismiss the executive, for a global sample of 192 countries 1789–2016. We demonstrate how the five measure each capture variation across the democracy-autocracy spectrum, as well as more nuanced variation within the mutually exclusive categories of extant regime typologies such as Cheibub, Ghandi, and VreelandFootnote 84 and Geddes, Wright, and FrantzFootnote 85.
Finally, we demonstrate that while controlling for some auxiliary characteristics and, most importantly, the extension of the suffrage and fairness of elections, these measures explain a substantial portion of cross-country and within-country over-time variation in the level of repression, rent-seeking or corruption, and leadership survival. The well-established selectorate theoryFootnote 86 does not fare well in in predicting these outcomes, and we use the discrepancies to generate a set of new hypotheses as a foundation for better theory.
As a final set of remarks, we would like to highlight some of our data’s main limitations. First, as should be clear by now, we are not offering another regime typology. Students interested in crisp start and end dates of regimes, the nature of their support groups in a more sociological sense, and what the causes and consequences are of regime transitions should thus look elsewhere for data. That said, the appointment measures we employ are more typological in nature, since they are coded in mutually exclusive categories. They can thus be usefully employed in combination with or as a way of validating other categorical regime measures. Second, as implied by the analyses presented here, one should be careful in drawing conclusions from our dimensions while controlling for the full set of democratic institutions implied by, for example, Dahl’sFootnote 87 famous concept of polyarchy. When thinking about Dahl’s different institutional guarantees,Footnote 88 one should in particular be careful with combining the one called “elected offices” with our dimensions of direct election and the confidence requirement, since they are of course intrinsically related. There is also, by nature, a very strong relationship between our dimension of ruling party and the polyarchy component of “associational autonomy,” since such autonomy is very much restricted in most single-party regimes. Third, and finally, although our measures in principle allow for within-leader variation so that both appointment and dismissal rules can vary across the term of any single HOS or HOG, there can be a built-in tendency in our data to underestimate such variation. The reason for this is that our information was collected with reference to specific leaders, named separately for the country experts and coders. If conspicuous events, such as constitutional changes, elections, or coups (including autogolpes), occurred that in effect changed the appointment or dismissal rule during a leader’s term, that should be reflected in our data. But other more subtle changes in informal rules and practices, by contrast, might have flown under the radar of our country experts and coders. These limitations notwithstanding, we believe there are several potential uses for these new measures.
Supplementary Materials
Appendix A. List of V-Dem variables and/or indices used
Appendix B. List of countries
Appendix C. Country examples
Appendix D. Pairwise comparisons of regime dimensions
Appendix E. Regime dimensions across four global regions
Appendix F. Comparison to Geddes, Wright, and Franz, 1946–2010
Appendix G. Comparison to Archigos, 1840–2015
Appendix H. Full regression tables
To view supplementary material for this article, please visit https://doi.org/10.1017/S1537592718002098