1 Introduction
The turbulent flow of particle suspensions is a complicated problem in fluid mechanics because both turbulence and the behaviour of particles in suspensions are not completely understood and the combination of the two raises new significant challenges (Balachandar & Eaton Reference Balachandar and Eaton2010; Prosperetti Reference Prosperetti2015). Despite its complexity, this flow serves many natural and practical applications from pyroclastic and sedimentation flows to fluidised beds, hopper dredgers and slurry transports (Eckstein, Bailey & Shapiro Reference Eckstein, Bailey and Shapiro1977). In this work, we employ direct numerical simulations to study turbulent particulate channel flow where the particles have two different sizes, i.e. binary mixtures. The fully resolved simulation of the dispersion of thousands of rigid particles in a turbulent flow enables us to gain new understanding of the microphysics of the problem, developing theories and predicting the complex behaviour of the system, (Campbell Reference Campbell1990; Lucci, Ferrante & Elghobashi Reference Lucci, Ferrante and Elghobashi2010).
The interactions between the particles and fluid depend strongly on the characteristics of both the disperse and the continuous phases. If the volume fraction of the particles is larger than a certain threshold, e.g.
 $10^{-3}$
according to the analysis in Elghobashi (Reference Elghobashi1994), full interactions between the two phases take place, leading to the so-called four-way coupling regime. This condition is typical in many industrial processes such as crystallisation and fluidised beds. To study numerically the fully coupled regime of a suspension the classical point-particle models, based on Maxey and Riley’s model (Maxey & Riley Reference Maxey and Riley1983), are no longer valid and direct numerical simulations resolving the flow around each individual particle should be employed. The same holds when the particle size is larger than the smallest scale in the flow, even for dilute suspensions.
As regards suspensions of finite-sized particles, most of the previous studies are conducted at zero or low inertia with the main focus on the rheological aspects of the flow, in particular the particle distribution, effective viscosity and normal stress differences (see Hampton et al.
Reference Hampton, Mammoli, Graham, Tetlow and Altobelli1997; Stickel & Powell Reference Stickel and Powell2005; Brown & Jaeger Reference Brown and Jaeger2009; Morris Reference Morris2009; Yeo & Maxey Reference Yeo and Maxey2011, Reference Yeo and Maxey2013). When inertia at the particle scale is large enough, the symmetry of the flow around the particles is broken and this affects the rheological behaviour of the suspension (Kulkarni & Morris Reference Kulkarni and Morris2008; Picano et al.
Reference Picano, Breugem, Mitra and Brandt2013; Haddadi & Morris Reference Haddadi and Morris2014). Given the range of applications, suspensions flowing in the inertial regime have been studied for a long time, starting from the seminal work of Bagnold (Reference Bagnold1954) who performed experiments with suspensions of rigid particles between two cylindrical drums. Bagnold defines two regimes at low and high shear rates, the macro-viscous and grain inertia regimes, where the effective viscosity of the suspension, measured by the wall shear stress, varies linearly and quadratically with shear rate, respectively. Several decades later, Matas, Morris & Guazzelli (Reference Matas, Morris and Guazzelli2003) conducted experiments on suspensions of finite-sized particles in a pipe and reported the critical threshold for the transition from the laminar to the turbulent regime as a function of the particle size and volume fraction. Most importantly, these authors observe that the critical threshold first decreases and then increases with the volume fraction of the dispersed phase when the particles are large enough with respect to the pipe diameter. The transition promotion is attributed to the disturbances induced by the particles as well as to the breakdown of the flow coherent structures (see Loisel et al.
Reference Loisel, Abbas, Masbernat and Climent2013; Lashgari, Picano & Brandt Reference Lashgari, Picano and Brandt2015). The simulations in Lashgari et al. (Reference Lashgari, Picano, Breugem and Brandt2014) aimed to reproduce the experiments in Matas et al. (Reference Matas, Morris and Guazzelli2003); these allow the authors to introduce three different regimes: laminar, turbulent and inertial shear thickening for channel flow laden with finite-sized neutrally buoyant particles when varying the Reynolds number,
 $Re$
, and the particle volume fraction,
 $\unicode[STIX]{x1D6F7}$
. These regimes are identified considering the different contribution of the viscous, Reynolds and particle stresses to the stress budget of the two phase flow. The regimes are characterised by different mechanisms governing the particle dynamics and present different dispersion features (see Lashgari et al.
Reference Lashgari, Picano, Breugem and Brandt2016).
The recent advancement of computational resources and the improvement of the numerical algorithms have allowed the scientific community to address turbulent flows laden with thousands of finite-sized particles. In this respect, the early work of Ten Cate et al. (Reference Ten Cate, Derksen, Portela and Van Den Akker2004) employs a lattice-Boltzmann scheme to simulate the motion of finite-sized particles in an isotropic turbulent flow. These authors show that the kinetic energy and energy dissipation at wavelengths close to the particle size increase. This finding has been confirmed experimentally by Bellani et al. (Reference Bellani, Byron, Collignon, Meyer and Variano2012) for both spherical and non-spherical particles. We use here the immersed boundary method, which was first adopted by Uhlmann (Reference Uhlmann2005) to simulate flow of rigid particles in suspension. Uhlmann (Reference Uhlmann2008) simulated thousands of finite-sized particles at moderately high particle Reynolds number in a vertical turbulent channel flow mimicking the flow in a fluidised bed. In this study, the appearance of large structures in the flow is related to the instabilities induced by the particles while an apparent segregation of the particles is not observed. Later, the same numerical approach has been employed to simulate flow in other configurations such as turbulent particulate flow in an open channel and sedimentation (Kidanemariam et al. Reference Kidanemariam, Chan-Braun, Doychev and Uhlmann2013; Fornari, Picano & Brandt Reference Fornari, Picano and Brandt2016b ).
As regards turbulent channel flow laden with finite-sized particles, Picano, Breugem & Brandt (Reference Picano, Breugem and Brandt2015) study the flow of neutrally buoyant particles at volume fractions up to
 $20\,\%$
. They report that the particles alter the near-wall dynamics by increasing the spacing of the streaks and reducing their velocity contrast. More importantly, the log region in the mean fluid velocity profile changes considerably in the presence of the particles. Despite the monotonic increase in the overall drag with the particle concentration, these authors report a reduction of the turbulence activity at high volume fractions. Recently, Fornari et al. (Reference Fornari, Formenti, Picano and Brandt2016a
) extended this first study considering dense suspensions with different particle-to-fluid density ratios,
 $R$
, up to
 $1000$
, yet neglecting settling. This study shows that the excluded volume effect, i.e. the particle volume fraction, determines the turbulence statistics, while the particle-to-fluid inertia has negligible effect when
 $R<10$
. In addition, it is shown that strong particle shear-induced migration to the channel centreline occurs for the case of
 $R=10$
and the particle dynamics decouples from the fluid at
 $R=1000$
, but not vice versa.
Theoretical analysis of the multi-scale dynamics of the unladen turbulent channel flow in the framework of the so-called ‘law of the wall’ results in a reasonable prediction of the wall shear stress as a function of bulk Reynolds number; a commonly used approximate relation for the friction Reynolds number is
 $Re_{\unicode[STIX]{x1D70F}}=0.09(Re_{b})^{0.88}$
(Pope Reference Pope2000). Being able to extend this law to the turbulent particulate channel flow is desirable to avoid the massive numerical and experimental investigations needed to understand the characteristics of the flow in different conditions. Recently Costa et al. (Reference Costa, Picano, Brandt and Breugem2016) proposed a new theoretical framework to estimate the bulk behaviour, overall drag and mean velocity profile of turbulent channel flow laden with mono-disperse neutrally buoyant rigid particles. These authors show that the channel can be divided into a near-wall region where the particles form an evident layer and the rest of the channel where the particle distribution is homogenised. The thickness of the near-wall region is modelled as a function of particle size and volume fraction. As we will show here, the proposed model contributes directly to the understanding of the behaviour of the wall friction in a bi-disperse turbulent suspension as well, when properly accounting for the particle size distribution.
In almost all of the studies mentioned above, either in the laminar or turbulent regime, the particle phase is mono-disperse, i.e. particles have the same size. This assumption is not valid in many applications where suspensions contain a wide range of particle sizes. Polydispersity introduces additional non-uniformity in the flow that may affect the particle dynamics as well as turbulent flow dynamics (Marchioro, Tanksley & Prosperetti Reference Marchioro, Tanksley and Prosperetti2000). Hence, the aim of the present study is to assess similarities and differences between mono-disperse and bi-disperse turbulent suspensions. As a first step, we therefore consider the simpler case of binary mixtures and perform simulations of turbulent channel flow of bi-disperse particle suspensions at fixed bulk Reynolds number,
 $Re_{b}=5600$
, and total volume fraction,
 $\unicode[STIX]{x1D6F7}=0.2$
. At this concentration, the effect of the particle-induced stress on the momentum transfer across the channel becomes important, as shown by Picano et al. (Reference Picano, Breugem and Brandt2015). We vary the ratio between the relative volume fraction of small and large particles. We focus on the analysis of the bulk behaviour of the suspension flow and on the particle dynamics providing local concentration, dispersion and collisions to compare with the studies by Picano et al. (Reference Picano, Breugem and Brandt2015), Lashgari et al. (Reference Lashgari, Picano, Breugem and Brandt2016). This work can be seen as a step forward in exploring the wide parameters space of particulate flows in the journey towards the more realistic simulations of suspensions (Prosperetti Reference Prosperetti2015).
The paper is organised as follows. We discuss the governing equations and numerical method in § 2, whereas the flow configuration and simulation specifications are reported in § 3. The results of the simulations are presented in § 4 with conclusions and final remarks discussed in § 5. Results pertaining binary mixtures in the laminar regime are reported in the appendix and used as a reference when discussing the results for the turbulent flow.
2 Governing equations and numerical method
We study a turbulent channel flow laden with a binary suspension of finite-sized particles where the carrier phase is a Newtonian and incompressible fluid and the solid phase is constituted by rigid, neutrally buoyant spheres. The fluid flow is governed by Navier–Stokes and continuity equations,
 $$\begin{eqnarray}\displaystyle \unicode[STIX]{x1D70C}\left(\frac{\unicode[STIX]{x2202}\boldsymbol{u}}{\unicode[STIX]{x2202}t}+\boldsymbol{u}\boldsymbol{\cdot }\unicode[STIX]{x1D735}\boldsymbol{u}\right)=-\unicode[STIX]{x1D735}P+\unicode[STIX]{x1D707}\unicode[STIX]{x1D6FB}^{2}\boldsymbol{u}+\unicode[STIX]{x1D70C}\boldsymbol{f},\quad \unicode[STIX]{x1D735}\boldsymbol{\cdot }\boldsymbol{u}=0, & & \displaystyle\end{eqnarray}$$
where
 $\unicode[STIX]{x1D707}$
and
 $P$
indicate the fluid dynamic viscosity and pressure and
 $\unicode[STIX]{x1D70C}$
is the density of both fluid and particles. The coordinate system and velocity components are denoted by
 $\boldsymbol{X}=(x,y,z)$
and
 $\boldsymbol{u}=(u,v,w)$
corresponding to streamwise, wall-normal and spanwise directions. A localised force
 $\boldsymbol{f}$
is added on the right-hand side of the Navier–Stokes equation to treat the presence of finite-sized particles by means of an immersed boundary method. The motion of the particles is governed by the Newton–Euler equations,
 $$\begin{eqnarray}\displaystyle \left.\begin{array}{@{}c@{}}\displaystyle m^{p}\frac{\text{d}\boldsymbol{U}_{c}^{p}}{\text{d}t}=\oint _{\unicode[STIX]{x2202}V_{p}}[-P\boldsymbol{I}+\unicode[STIX]{x1D707}(\unicode[STIX]{x1D735}\boldsymbol{u}+\unicode[STIX]{x1D735}\boldsymbol{u}^{\text{T}})]\boldsymbol{\cdot }\boldsymbol{n}\text{d}S+\boldsymbol{F}_{c},\\ \displaystyle I^{p}\frac{\text{d}\pmb{\unicode[STIX]{x1D6FA}}_{c}^{p}}{\text{d}t}=\oint _{\unicode[STIX]{x2202}V_{p}}\boldsymbol{r}\times \left\{[-P\boldsymbol{I}+\unicode[STIX]{x1D707}(\unicode[STIX]{x1D735}\boldsymbol{u}+\unicode[STIX]{x1D735}\boldsymbol{u}^{\text{T}})]\boldsymbol{\cdot }\boldsymbol{n}\right\}\,\text{d}S+\boldsymbol{T}_{c},\end{array}\right\} & & \displaystyle\end{eqnarray}$$
where the mass, moment inertia, centroid velocity and angular velocity of the particle
 $p$
are denoted by
 $m^{p}$
and
 $I^{p}$
,
 $\boldsymbol{U}_{c}^{p}$
and
 $\pmb{\unicode[STIX]{x1D6FA}}_{c}^{p}$
, respectively. The surface of the particles and unit normal vector are denoted by
 $\unicode[STIX]{x2202}V_{p}$
and
 $\boldsymbol{n}$
, whereas the vector connecting the centre to the surface of the particles is indicated by
 $\boldsymbol{r}$
. The first term on the right-hand side of these equations represents the net force/moment on the particle
 $p$
resulting from the surrounding flow. The second term,
 $\boldsymbol{F}_{c}$
and
 $\boldsymbol{T}_{c}$
, represent the force and torque resulting from short-range interactions, lubrication and collisions. The interface condition is introduced to enforce the fluid velocity at each point on the particle surface to be equal to the particle velocity at that point,
 $\boldsymbol{u}(\boldsymbol{X})=\boldsymbol{U}^{p}(\boldsymbol{X})=\boldsymbol{U}_{c}^{p}+\pmb{\unicode[STIX]{x1D6FA}}_{c}^{p}\times \boldsymbol{r}$
. The immersed boundary method (IBM) with direct forcing developed by Uhlmann (Reference Uhlmann2005) and modified by Breugem (Reference Breugem2012) is employed to integrate the particle motion and satisfy the interface condition by the forcing
 $\boldsymbol{f}$
in the vicinity of each particle surface.
The fluid flow dynamics is solved by discretising the incompressible Navier–Stokes equations with a second-order finite difference method on a staggered grid. The solver is based on the discrete forcing method to simulate neutrally buoyant particles with second-order spatial accuracy (Mittal & Iaccarino Reference Mittal and Iaccarino2005; Breugem Reference Breugem2012). Two sets of grid points are considered: an Eulerian fixed and equispaced three-dimensional mesh and a set of Lagrangian points uniformly distributed on the surface of each particle. The Eulerian and Lagrangian grid points communicate to compute the immersed boundary (IB) forcing and ensure the no-slip and no-penetration boundary conditions on the surface of the particles. The IB force is then applied on both fluid and solid phases to evolve velocities and positions.
When the gap width between two particles (or particle–wall) becomes less than a threshold value,
 $\unicode[STIX]{x1D716}$
, the IBM underestimates the actual lubrication force. Therefore, a resolution-dependent lubrication correction is included at small
 $\unicode[STIX]{x1D716}$
as a function of the gap width. This correction is kept constant below a second threshold to represent the surface roughness. When
 $\unicode[STIX]{x1D716}\leqslant 0$
, a collision takes place; in this case, the lubrication correction is turned off and a collision force is activated (see the appendix of Lambert et al.
Reference Lambert, Picano, Breugem and Brandt2013, for more details). The collision force is computed based on the particle relative velocity and overlap. We use here the soft-sphere collision model described in the recent work by Costa et al. (Reference Costa, Boersma, Westerweel and Breugem2015) where a mass–spring–damper system in the directions normal and tangential to the contact line between the two overlapping spheres (or sphere–wall) governs the dynamics of the collision. Since the collision time is generally much smaller than the viscous relaxation time, even for a wet collision, the collision model allows us to stretch the collision time artificially so as to avoid the limiting restrictions of the numerical time step. The accuracy of the collision model has been tested against several benchmark cases in Costa et al. (Reference Costa, Boersma, Westerweel and Breugem2015).
3 Computational set-up
We simulate suspensions of neutrally buoyant finite-sized particles in a plane channel with periodic boundary conditions imposed in the streamwise and spanwise directions. The computational domain has size
 $6~\text{h}\times 2~\text{h}\times 3~\text{h}$
in the streamwise, wall-normal and spanwise directions where
 $h$
is the half-channel height. We simulate the flow at bulk Reynolds number,
 $Re=2h\,U_{b}/\unicode[STIX]{x1D708}=5600$
, where
 $U_{b}$
is the bulk velocity of the entire mixture and
 $\unicode[STIX]{x1D708}$
the fluid kinematic viscosity. The simulations are performed forcing the bulk velocity to
 $U_{b}=1$
. This corresponds to a friction Reynolds number,
 $Re_{\unicode[STIX]{x1D70F}}=180$
in the unladen case. We use a resolution of
 $1440\times 480\times 720$
grid points in the streamwise, wall-normal and spanwise directions. For all the particulate cases this gives a grid spacing of
 $\unicode[STIX]{x0394}x^{+}=\unicode[STIX]{x0394}y^{+}=\unicode[STIX]{x0394}z^{+}\leqslant 1$
, a value below the criteria to ensure fully resolved simulation of the turbulent flow in a channel. The choice of the number of grid points is determined by the minimum resolution required to resolve the flow around the smallest particle in the domain.
The solid phase consists of spherical particles of two different sizes,
 $2h/d_{s}=30$
and
 $2h/d_{l}=20$
, where
 $d_{s}$
and
 $d_{l}$
are the diameter of the small and the large particles. The two type of particles considered have therefore a ratio of diameters of 1.5, which corresponds to larger particles with volume
 $3.375$
times that of the small particles. These values of the particle diameter correspond to
 $16$
and
 $24$
Eulerian grid points, respectively. The communication between the solid surface and the surrounding flows occurs via
 $746$
and
 $1721$
Lagrangian grid points located on the particle surface. The number of Lagrangian grid points provides a similar spacing on the surface of the particles as the one of the Eulerian points, which contributes to an accurate exchange of the forces between the two phases. The total particle volume fraction is kept constant to
 $\unicode[STIX]{x1D6F7}=0.2$
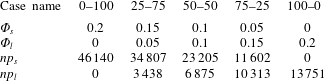
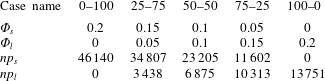
, while the ratio between the volume fraction of the small-to-large particles is changed in the different simulations performed. The details of the five simulations of a particle-laden flow presented in the present work are reported in table 1; the case names reflect the percentage of the volume fraction occupied by large and small particles. The two cases 0–100 and 100–0 correspond therefore to mono-disperse suspensions of only small and large particles, respectively.
Parameters of the five simulations of turbulent flow of bi-disperse suspensions;
 $\unicode[STIX]{x1D6F7}_{s}$
: volume fraction of small particles,
 $\unicode[STIX]{x1D6F7}_{l}$
: volume fraction of large particles,
 $np_{s}$
: number of finite-sized small particles and
 $np_{l}$
: number of finite-sized large particles. The solid volume fraction is fixed to
 $\unicode[STIX]{x1D6F7}=20\,\%$
for all cases.
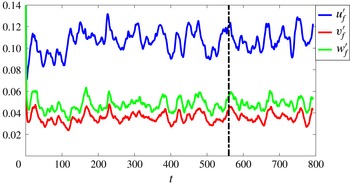
The simulations are initialised with a semi-organised (lattice-like) arrangement of the particles in the entire domain together with a high amplitude localised disturbance in the form of two counter-rotating streamwise vortices (Henningson & Kim Reference Henningson and Kim1991). These vortices efficiently trigger transition to turbulence in the domain and mix the small and large particles. Each simulation is run using 480 cores for approximately 4 weeks. The statistics are computed after the initial transient phase using 100 snapshots over approximately 230 bulk-flow time units,
 $2h/U_{b}$
. We display in figure 1, the time history of the box-averaged fluid velocity fluctuations for the case 0–100. Velocity fluctuations are scaled by
 $U_{b}$
whereas time is shown in bulk-flow units,
 $2h/U_{b}$
. The statistics are calculated using the data after the initial transients, indicated by the vertical dashed line. Convergence tests are carried out by comparing the statistics calculated with half of the number of data points.
Time history of the fluid velocity fluctuations for the case 0–100. The velocity fluctuations are scaled by
 $U_{b}$
whereas time is shown in bulk-flow units,
 $2h/U_{b}$
.

4 Results
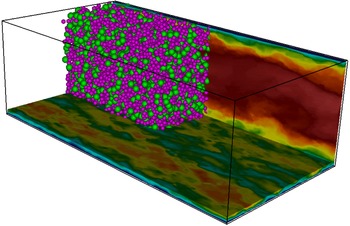
Instantaneous flow visualisation for a binary mixture with equal volume fraction of small and large particles: case 50–50. The contour plot shows the streamwise velocity of the mixture in a wall-normal and wall-parallel plane. The arrangement of the particles is shown only over one-fourth of the domain for the sake of clarity. The ratios between the channel height and the diameter of green and pink particles are
 $20$
and
 $30$
respectively.

First we show in figure 2 a visualisation of the instantaneous flow for a binary mixture with equal volume fraction of small and large particles: case 50–50. We display the colour contours of the streamwise velocity of the mixture in a wall-normal and wall-parallel plane. The mixture velocity is obtained averaging the fluid and particle velocities in the domain. In the wall-parallel plane close to the bottom wall of the channel we observe the classical streaky structures, elongated in streamwise directions. These streaks are created by the lift-up mechanism and serve as engine for sustaining the turbulence (Brandt Reference Brandt2014). The presence of the particles alters the features of the streaks by increasing the spacing and decreasing the contrast between the region of high and low velocities, see also Picano et al. (Reference Picano, Breugem and Brandt2015) for mono-disperse suspensions. In the figure, we also display the particle position over one-fourth of the domain for the sake of clarity. The distribution of both the small and the large particles is almost uniform in the middle of the channel. However, stronger segregation of small particles in the near-wall region is evident as we will show in more detail in the following. A similar behaviour is observed by visualising the flow from the other simulations (not shown here).
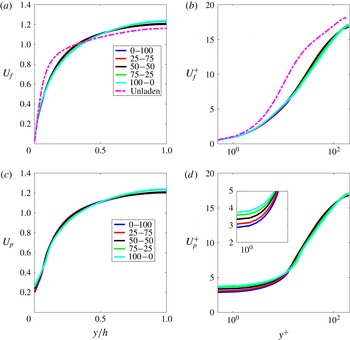
Mean fluid and particle velocity profiles of particulate and unladen turbulent flow cases, (a,c) in outer scaling (b,d) in inner scaling.

4.1 Mean velocity and particle distribution
In figure 3(a,b), we display the mean streamwise fluid velocity profile for the five cases under investigation. We also include the velocity profile of an unladen turbulent channel flow at the same bulk Reynolds number,
 $Re_{b}=5600$
, indicated with the dashed line. We recall that all the simulations are performed by enforcing a constant mass flux. The fluid statistics are obtained by averaging in the streamwise and spanwise directions over the points outside the particles and by temporal averaging. Although the mean velocity profile for the particle-laden turbulent flows exhibit a strong modification with respect to the case of turbulent unladen flows, the difference between the particulate cases is not significant. In figure 3(a) we note that the mean velocity profile of the particulate flow is less blunt and more similar to a laminar flow with higher velocity toward the channel centre. This behaviour is slightly accentuated in suspensions with higher concentration of large particles. This suggests that the turbulent activity is reduced in the presence of the solid phase, the more so for larger particles. In figure 3(b) we present the mean velocity profile of particulate and unladen cases scaled in inner units, i.e.
 $U_{f}^{+}=U_{f}/u_{\unicode[STIX]{x1D70F}}$
and
 $y^{+}=yu_{\unicode[STIX]{x1D70F}}/\unicode[STIX]{x1D708}$
with
 $u_{\unicode[STIX]{x1D70F}}=\sqrt{\unicode[STIX]{x1D70F}_{w}/\unicode[STIX]{x1D70C}}$
the friction velocity and
 $\unicode[STIX]{x1D70F}_{w}$
the wall shear stress. The inner-scaled velocity profiles of the particulate cases are lower than those of the unladen flow indicating an increase in the wall shear stress in the presence of particles. The log profile in the classical unladen turbulent flow reads
 $U^{+}=(1/\unicode[STIX]{x1D705})\text{ln}\,y^{+}+B$
where
 $\unicode[STIX]{x1D705}$
is the von Kármán constant and
 $B$
is an additive coefficient (Pope Reference Pope2000). Here we obtain, similar to Picano et al. (Reference Picano, Breugem and Brandt2015), that the slope of the log region increases while the additive constant reduces significantly, which results in an overall drag enhancement. No significant differences emerge among the different cases. We therefore conclude that the mean flow velocity of the turbulent channel flow is definitely controlled by the volume fraction of the solid phase, while the bi-dispersity of the suspensions plays a minor role.
Figure 3(c) shows the mean velocity of the dispersed solid phase. Particle statistics are obtained by spatial averaging over the points inside the particles and then by temporal averaging. The data in the figure reveal, overall, a similar behaviour for the different particle-laden flows. Comparing with the data in figure 3(a) one finds that slip between the fluid and particle velocities is evident close to the wall whereas this is almost zero in the core of the channel. The slip velocity is thus driving the dynamics near the wall, as further discussed below. As shown in the inset of figure 3(d), the particle slip velocity at the wall increases monotonically when increasing the ratio between the volume fraction of large-to-small particles. This is attributed to the fact that larger particles forming the near-wall layer reach larger distances from the wall where they are exposed to higher flow velocity (see Picano et al. Reference Picano, Breugem and Brandt2015; Costa et al. Reference Costa, Picano, Brandt and Breugem2016).
We employ a phase indicator function to calculate the local volume fraction profile across the channel. The indicator function assumes for each computational cell in the domain values of
 $\unicode[STIX]{x1D6F9}=1$
,
 $\unicode[STIX]{x1D6F9}=0$
or
 $0<\unicode[STIX]{x1D6F9}<1$
if the cell is located inside the particle, in the fluid phase or is cut by the interface. Taking average of the phase indicator function in the streamwise and spanwise (homogenous) directions followed by a time averaging, we obtain the particle concentration profile across the channel. We normalise the profile such that its mean value is equal to the total particle concentration. Although the particle centre cannot get closer than a particle radius to the wall, we still have non-zero values of the indicator function close to the wall, and thus non-zero local volume fraction. The wall-normal profile of local mean solid volume fraction
 $\unicode[STIX]{x1D719}(y)$
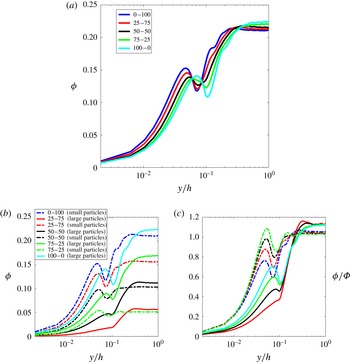
is displayed in figure 4(a) for the five suspensions considered here. Note that the horizontal axis is shown in logarithmic scale to ease the comparison in the near-wall region. For all cases the local concentration is characterised by a homogenous particle distribution in the bulk of the flow due to the action of turbulent mixing. A different behaviour is observed in the near-wall region where an inhomogeneous distribution occurs. In particular, we find a local maximum of
 $\unicode[STIX]{x1D719}(y)$
close to the wall, lower than the value of the bulk concentration, followed by a local minimum. In mono-disperse suspensions, the location of the maximum occurs at a wall distance slightly larger than a particle radius, while the minimum of
 $\unicode[STIX]{x1D719}$
occurs around one particle diameter away from the wall. This behaviour is attributed to the formation of a near-wall layer induced by the planar wall symmetry and the excluded finite volume of the rigid particles, as noted in Picano et al. (Reference Picano, Breugem and Brandt2015). Bi-disperse suspensions show a progressive modification from the case of mono-disperse suspensions of small particles to that of large particles; in particular the location of the first maximum of
 $\unicode[STIX]{x1D719}(y)$
indicates that smaller particles show a higher accommodation at the wall. The bi-dispersity however tends to smear out the near-wall volume fraction profile.
Profile of local volume fraction for the five simulated suspensions: (a) total volume fraction, (b) volume fraction of small and large particles separately, (c) volume fraction of small and large particles normalised by their bulk value.

In figure 4(b) we show, separately, the concentration profile of small and large particles for all the cases. We note that the smaller particles tend always to form a layer, while layering is absent for the larger particles when these are in a bi-disperse suspensions and for lower values of their volume fraction. To better understand the effect of the bi-dispersity on the particle layering we show in figure 4(c) the local volume fraction of small and large particles normalised by their bulk values. It is clear from this figure that bi-dispersity tends to reduce or even destroy the wall layer of the larger particles while promoting the layering of the smaller particles near the wall. Hence for bi-disperse cases the near-wall dynamics tends to be controlled by the smaller particles that concentrate more at the wall. As we will discuss in analogy with the work by Costa et al. (Reference Costa, Picano, Brandt and Breugem2016), the near-wall layering dynamics plays a crucial role in determining the overall suspension drag.
Segregation of small and large particles in different spatial locations is a well-known phenomenon and has been already explored in the seminal experimental study of Bagnold (Reference Bagnold1954). Performing an experiment on the slope of falling sand with mixed sizes, it is observed that the smaller grains tend to migrate towards regions of highest shear while the larger particles accumulate in regions of lower shear. This has been attributed to the proportionality of the disperse phase pressure to the square of the grain diameter. Larger particles will be pushed away from regions of high shear rate by the stronger dispersive pressure (see Schlick et al.
Reference Schlick, Isner, Freireich, Fan, Umbanhowar, Ottino and Lueptow2016, for recent theoretical analysis on this aspect). Even though a turbulent flow tends to redistribute the particles and to weaken this effect, we still observe segregation of small/large particles at the wall/centre region of the channel, an observation consistent with the findings by Bagnold. To further support this, we discuss the concentration profile of binary mixture suspensions in laminar flows,
 $Re_{b}=1000$
, in appendix appendix A.
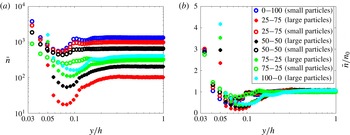
Here, we also examine the particle number density across the channel as an alternative measure of the particle distribution. In this case, we consider only particle centres and compute the spatial and time average of their wall-normal positions. In figure 5(a), we show the profile of the mean particle number density,
 $\bar{n}$
, of small and large particles for the five turbulent cases studied. This is computed by counting the mean number of particle centres at each wall-normal station per unit volume. For each case, the peak of the mean number density occurs at a distance to the wall equal to the particle radius. Small particles are predominant close to the wall in cases 25–75 and 50–50. This is not true for the case 75–25 where the number of small and large particles close to the wall is of the same order. This result is in line with that of the local volume fraction reported in the previous figure. In panel (b) we normalise the data of panel (a) by the corresponding bulk value,
 $\bar{n}/n_{0}$
. Similarly the high traffic of small particles close to the wall is evident.
(a) Profiles of the mean particle number density,
 $\bar{n}$
, (b) normalised mean particle number density,
 $\bar{n}/n_{0}$
, across the channel at
 $Re_{b}=5600$
.

4.2 Overall drag
The mean velocity profile and the overall drag of a turbulent channel flow are directly connected to the inhomogeneous multi-scale dynamics of the turbulent flow. In wall turbulence, it is common to define a bulk Reynolds number,
 $Re_{b}$
, representing a dimensionless form of the flow rate and the friction Reynolds number,
 $Re_{\unicode[STIX]{x1D70F}}=u_{\unicode[STIX]{x1D70F}}h/\unicode[STIX]{x1D708}$
, as a dimensionless measure of the overall drag. Based on well-established empirical correlations, (e.g. Pope Reference Pope2000), it is possible to relate the two numbers for the case of the unladen turbulent plane channel flow,
 $$\begin{eqnarray}Re_{\unicode[STIX]{x1D70F}}=u_{\unicode[STIX]{x1D70F}}h/\unicode[STIX]{x1D708}=0.09(Re_{b})^{0.88}.\end{eqnarray}$$
When a turbulent flow with suspended particles is considered, the relation (4.1) needs to be modified to consider the rheological properties of the suspension. Laminar suspensions are characterised by a monotonic increase of their effective viscosity as a function of the volume fraction of the dispersed phase. The effective viscosity of the suspension in laminar condition has been first predicted in the seminal work by Einstein (Reference Einstein1906) for the dilute regime in the form of a linear correction,
 $\unicode[STIX]{x1D708}_{e}=\unicode[STIX]{x1D708}(1+2.5\unicode[STIX]{x1D6F7})$
. Later on Batchelor & Green (Reference Batchelor and Green1972) considered pair interactions and derived a second-order correction in the volume fraction valid for semi-dilute suspensions. In the dense regime, however, only empirical fits are available, among others the Eilers fit,
 $$\begin{eqnarray}\unicode[STIX]{x1D708}_{e}=\unicode[STIX]{x1D708}\left(1+5/4\frac{\unicode[STIX]{x1D6F7}}{1-\unicode[STIX]{x1D6F7}/\unicode[STIX]{x1D6F7}_{max}}\right)^{2},\end{eqnarray}$$
where
 $\unicode[STIX]{x1D6F7}_{max}\approx 0.6$
is the maximum packing fraction of particles (Stickel & Powell Reference Stickel and Powell2005). Note that Mwasame, Wagner & Beris (Reference Mwasame, Wagner and Beris2016) have recently introduced a weighting function
 $\unicode[STIX]{x1D6FD}$
, describing the effects of size ratio and volume fraction ratio on the effective viscosity of binary suspensions. Interestingly, this model shows that for concentrations
 $\unicode[STIX]{x1D6F7}<0.3$
, the effect of particle bi-dispersity on the effective viscosity of the suspension is negligible, i.e.
 $\unicode[STIX]{x1D6FD}\approx 1$
. Thus, in our study at
 $\unicode[STIX]{x1D6F7}=0.2$
, we safely estimate the effective viscosity using (4.2). When inertia dominates the dynamics, deviations from the empirical fits valid in viscous regimes have been reported by several authors, e.g. inertial shear thickening (e.g. Kulkarni & Morris Reference Kulkarni and Morris2008; Yeo & Maxey Reference Yeo and Maxey2011; Picano et al.
Reference Picano, Breugem, Mitra and Brandt2013).
The situation becomes even more complicated in turbulent flows laden with particles larger than the smallest hydrodynamic scales. As discussed in Picano et al. (Reference Picano, Breugem and Brandt2015), Prosperetti (Reference Prosperetti2015), the turbulent friction Reynolds number cannot be predicted by only taking into account the effective viscosity of the suspension,
 $$\begin{eqnarray}Re_{\unicode[STIX]{x1D70F}}^{e,exp}=0.09(Re_{b}\unicode[STIX]{x1D708}/\unicode[STIX]{x1D708}_{e})^{0.88},\end{eqnarray}$$
where
 $Re_{\unicode[STIX]{x1D70F}}^{e,exp}$
is the expected suspension friction Reynolds number which accounts for the suspension dynamics only by considering the suspension effective viscosity. Applying the formula above, the friction Reynolds number pertaining the cases considered here would be
 $Re^{e,exp}=101.7$
, obtained using
 $\unicode[STIX]{x1D708}_{e}\simeq 1.9\unicode[STIX]{x1D708}$
. This should be compared with the values of the effective friction Reynolds number
 $Re_{\unicode[STIX]{x1D70F}}^{e}=u_{\unicode[STIX]{x1D70F}}h/\unicode[STIX]{x1D708}_{e}$
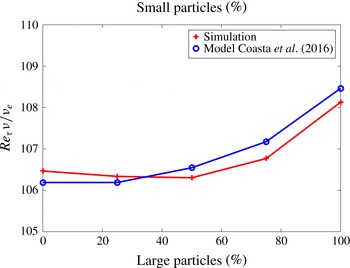
extracted from direct numerical simulation (DNS) of the present bi-disperse cases and reported in figure 6 where all values are higher than what is predicted from (4.3). In addition, the flow shows a dependence on the particle size which is not accounted for by (4.3). As shown here and in the previous works mentioned above, the presence of finite-sized spherical particles increases the overall drag more than what is predicted considering only the effective viscosity. An interesting exception is provided by the case of oblate disc-like particles, see Ardekani et al. (Reference Ardekani, Costa, Breugem, Picano and Brandt2016).
To explain these observations, a new theoretical framework has been recently proposed by Costa et al. (Reference Costa, Picano, Brandt and Breugem2016) to extend the law of the wall for the turbulent channel flow of finite-sized mono-disperse rigid spheres. The underlying idea is that the formation of a particle layer at the wall creates an additional source of drag. In the formula proposed by these authors, the overall stress is assumed to depend on the Reynolds number, the volume fraction and the particle size that together determine the wall layer thickness (for the details of the derivations we refer the readers to Costa et al. Reference Costa, Picano, Brandt and Breugem2016). The formula reads
 $$\begin{eqnarray}\displaystyle Re_{\unicode[STIX]{x1D70F}}^{S}=Re_{\unicode[STIX]{x1D70F}}^{e,exp}\left(1-\frac{\unicode[STIX]{x1D6FF}_{pw}}{h}\right)^{-3/2+0.88}, & & \displaystyle\end{eqnarray}$$
where the particle layer thickness
 $\unicode[STIX]{x1D6FF}_{pw}=C(\unicode[STIX]{x1D6F7}/\unicode[STIX]{x1D6F7}_{max})^{(1/3)}D_{p}$
and
 $C\approx 1.5$
. This has been found to provide a good fit of data from simulations of particle-laden turbulent channel flow for a reasonable range of volume fractions and Reynolds numbers.
Effective friction Reynolds number pertaining the different cases
 $Re_{\unicode[STIX]{x1D70F}}^{e}$
considered here and the predictions by the model of Costa et al. (Reference Costa, Picano, Brandt and Breugem2016).

To extend this formula to bi-disperse suspensions we need to provide an ‘effective’ particle size in order to characterise the wall layer. Examining the local volume fraction profiles in figure 4, we note that the distance between the local maximum and the wall is proportional to the particle diameter for mono-disperse cases. In our simulations the constant of proportionality is obtained equal to
 $1.37$
. We therefore assume the effective particle size,
 $D_{p}^{e}$
, of the binary mixtures as the product of the location of the local maximum in the concentration profile with the constant of proportionality,
 $1.37$
. In table 2 we report the values of the effective particle diameter pertaining each simulation normalised with half the channel height.
Effective particle diameter based on the location of local maximum in the profile of the local concentration.

Using this definition, we note that
 $D_{p}^{e}$
almost coincides with the smallest particle diameter for the cases 0–100, 25–75 and 50–50; it then increases and reaches the largest particle diameter for the 100–0 case, as expected. In figure 6, we report the effective friction Reynolds number
 $Re_{\unicode[STIX]{x1D70F}}^{S}$
estimated from (4.4) with
 $C\simeq 1.33$
. We note that the predicted values are in very good agreement with the DNS data. This analysis also explains the trend for the variation of the overall drag observed in bi-disperse suspensions when increasing the percentage of large particles.
4.3 Turbulent statistics
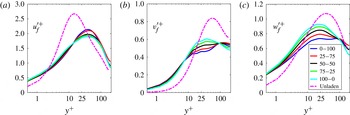
Next we examine the statistics of the turbulent flow. Figure 7 shows the root mean square (r.m.s.) of the fluid velocity fluctuations for the five particulate cases in inner units, together with the corresponding statistics for the unladen turbulent channel flow at the same bulk Reynolds number,
 $Re_{b}=5600$
. Comparing the statistics of the particulate and the unladen flow we observe that the turbulence activity reduces in all the particulate flows, with lowered peaks. The mechanisms responsible for this have been discussed in detail in the previous studies by Lashgari et al. (Reference Lashgari, Picano, Breugem and Brandt2014) and Picano et al. (Reference Picano, Breugem and Brandt2015) for mono-disperse suspensions: this reduction is connected to the increasing importance of particle stresses with respect to Reynolds stresses in the momentum transfer. The profiles of the streamwise velocity fluctuations
 ${u^{\prime }}^{+}$
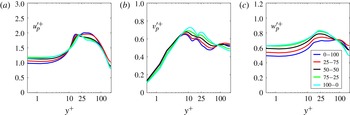
, displayed in figure 7(a), reveal that the wall-normal location of the peak is shifted toward the channel centreline for the particulate flows. This can be explained by the formation of the particle layers close to the wall that hinder the production of perturbation kinetic energy from the mean flow. The maximum streamwise velocity fluctuation is reduced for all cases and appear to be slightly higher for bi-disperse suspensions with larger percentages of small particles. The opposite behaviour is observed for the cross-stream velocity fluctuations, figure 7(b,c) where the peaks move toward the wall with respect to the unladen flow. For these components, we note the opposite trend as that of the streamwise fluctuations when varying the relative amount of large-to-small particles. We infer that large particles arriving to or departing from the wall layer induce a higher level of fluctuations in the cross-stream directions. Finally, we note that very close to the wall higher fluctuations are present in the particle-laden cases, which is attributed to the relatively large particle slip velocity and the squeezing motion of the fluid between the wall and the particles.
Profiles of the intensity of the fluid velocity fluctuation components in (a) streamwise, (b) wall-normal and (c) spanwise directions scaled in inner units. The data pertain to the different cases under investigation as indicated in the legend.

The r.m.s. velocity fluctuations of the particle phase are shown in figure 8 in inner units in order to have a direct comparison with those pertaining the fluid phase. First, we observe that the fluctuations do not vanish at the wall, unlike those of the fluid phase with the only exception of the wall-normal component. In the region close to the wall where the first layer of particles is formed the streamwise and cross-stream fluctuations of the case with all large/small particles are the largest/smallest, see figure 8(a–c). This is attributed to the higher/lower slip velocity of the large/small particles in the near-wall region. The opposite behaviour is observed in the core of the channel where small particles are subjected to more agitation due to the turbulent activity. Away from the near-wall region, the level of fluctuations of the particle phase is generally lower than that of the fluid phase.
Profiles of the intensity of the particle velocity fluctuation components in (a) streamwise, (b) wall-normal and (c) spanwise directions scaled in inner units. The data pertain to the different cases under investigation as indicated in the legend.

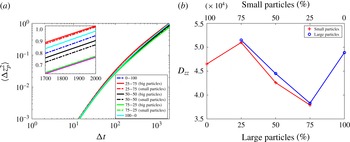
(a) Particle mean square displacement
 $\langle \unicode[STIX]{x0394}z_{p}^{2}\rangle$
for the different cases under investigation. (b) Dispersion coefficient,
 $D_{zz}$
, in the spanwise direction versus the relative particle volume fraction.

4.4 Particle dynamics
In this last part we focus on the particle dispersion dynamics by measuring the particle lateral displacement, which results from particle–particle and particle–fluid interactions. In this work we examine only the particle mean square displacement in the spanwise direction to avoid inhomogeneous and mean flow effects that determine the motion in the wall-normal and streamwise directions. We analyse separately the behaviour of small and large particles in the binary suspensions. The mean square displacement in the spanwise direction is defined by
 $\langle \unicode[STIX]{x0394}z_{p}^{2}\rangle (\unicode[STIX]{x0394}t)=\langle [\boldsymbol{z}_{p}(t+\unicode[STIX]{x0394}t)-\boldsymbol{z}_{p}(t)]^{2}\rangle _{p,t}$
where
 $z_{p}$
is the vector containing the spanwise position of the particle centres and
 $\unicode[STIX]{x0394}t$
is the time interval. The ensemble average,
 $\langle \rangle _{p,t}$
is taken over all the particles and times after a fully developed flow is established. For more details about particle dispersion and diffusion we refer the readers to the works by Da Cunha & Hinch (Reference Da Cunha and Hinch1996) and Sierou & Brady (Reference Sierou and Brady2004).
The particle mean square displacement is shown in figure 9(a) versus time. Note that the mean square displacement,
 $\langle \unicode[STIX]{x0394}z_{p}^{2}\rangle$
, is normalised by
 $(2h)^{2}$
whereas the time is expressed in units of
 $t_{ref}=d_{l}/U_{b}$
. For all the cases, as expected, the particle mean square displacement varies initially quadratically in time,
 $\langle \unicode[STIX]{x0394}z_{p}^{2}(\unicode[STIX]{x0394}t)\rangle \propto \unicode[STIX]{x0394}t^{2}$
, indicating a high correlation in the particle trajectories at small intervals. Later on, the classical diffusive behaviour takes over: the particle trajectories de-correlate and the mean square displacement varies linearly with time. In the inset of the figure we report the regime behaviour, the linear diffusive part, for the different particle-laden flows.
To better highlight the differences we provide in figure 9(b), the value of the dispersion coefficient,
 $D_{zz}$
, obtained by fitting the diffusive, long-time regime to a straight line. As appreciated from the figure, a non-monotonic behaviour is observed. Mono-disperse suspensions of either small or large particles show a similar value of the diffusion coefficient. In bi-disperse suspensions, interestingly, the diffusion coefficient of large and small particles is always close, with a slightly higher value for the largest particles. We explain this non-monotonic behaviour by the following arguments. Adding a small amount of bigger particles in a mono-disperse suspension of small particles, as in the 25–75 case, we expect that the disturbances induced by the large particles enhance the particle dispersion. Conversely, adding a small amount of smaller particles to a mono-disperse suspension of large particles, as in the 75–25 case, will reduce the overall dispersion because of the reduced mobility induced by the smaller particles that are positioned among the larger ones. The peculiar picture of the diffusion coefficient for bi-disperse suspensions can be explained considering that these opposite trends need to match when the concentration of the two particles are similar. Finally, we note that the non-monotonic behaviour of the dispersion coefficient is observed for the particle size distribution studied here and may need further investigations for different size distributions.
One interesting aspect of dense bi-disperse suspensions is the probability of collision, which, in turns, depends on the particle-pair relative distribution and the first-order velocity structure functions. For binary mixtures, we report the particle-pair statistics by considering pairs consisting of (i) only two small particles, (ii) only two large particles and (iii) one small and one large particle. The first step is to examine the radial distribution function,
 $g(r)$
, as a function of the distance between the centres of the particle pairs,
 $r$
. The radial distribution function is a measure of the non-uniformity of the particle distribution and is obtained by counting the average number of particle pairs whose centres are at distance
 $r$
with respect to the value of a corresponding random distribution (see for more details Reade & Collins Reference Reade and Collins2000; Gualtieri et al.
Reference Gualtieri, Picano, Sardina and Casciola2012). In mathematical form,
 $g(r)=1/An_{0}dN_{r}/dr$
, where
 $A=4\unicode[STIX]{x03C0}r^{2}$
is the area of the shell around the reference particle,
 $N_{r}$
is the number of the particle pairs within a sphere of radius
 $r$
and
 $n_{0}=N_{p}(N_{p}-1)/2V$
the density of the particle pairs in the volume
 $V$
with
 $N_{p}$
the total number of particles.
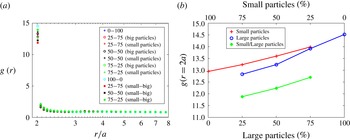
(a) Radial distribution function (RDF)
 $g(r)$
and (b) RDF at pair contact for the five cases under consideration.

The relative position between the particles in the flow determines part of the collision dynamics, but the full scenario becomes clear when considering also the particle-pair relative velocity in the normal direction. The normal relative velocity between the particle pair as a function of the distance
 $r$
reads,
 $\text{d}v_{n}(r)=(\boldsymbol{u}_{i}-\boldsymbol{u}_{j})\boldsymbol{\cdot }\boldsymbol{r}_{i}-\boldsymbol{r}_{j}/|\boldsymbol{r}_{i}-\boldsymbol{r}_{j}|$
, where
 $\boldsymbol{u}_{i}$
and
 $\boldsymbol{r}_{i}$
are the velocity and position vector of particle
 $i$
. The multiplication of the ensemble average of the negative part of the normal relative velocity,
 $\text{d}v_{n}^{-}(r)=\text{d}v_{n}(r)|_{{<}0}$
, and the radial distribution function gives the collision kernel:
 $\unicode[STIX]{x1D705}(r)=\langle \text{d}v_{n}^{-}(r)\rangle \cdot g(r)$
. Note that the collision kernel is properly defined at the pair contact; however here we use the extended formula as a function of
 $r$
to understand how the approaching dynamics governs the collisions.
We display the radial distribution function (RDF) pertaining the different bi-disperse cases under investigation in figure 10(a). In this work, the particle-pair statistics are reported only for the region in the middle of the channel, in the range
 $0.25<y/2h<0.75$
, in order to exclude wall effects. We thus compare the particle dynamics in the homogenous region of the channel. Note that here the average density of particle pairs in this region is used in the calculation of
 $n_{0}$
. All the profiles are characterised by strong segregation at
 $r\simeq 2a$
where
 $a$
is defined by the distance between the particle pairs at contact in each case; i.e. all the profiles start at
 $r=2a$
corresponding to the contact between the pairs. As
 $r$
increases
 $g(r)$
decreases and tends to unity when
 $r\gg 2a$
denoting a random distribution. As it can be seen in figure 10(b) where the RDF is shown at
 $r=2a$
, increasing the percentage of large particles generally increases the segregation at contact for all possible pairs. We note that for the mono-disperse cases, the RDF at contact is higher for larger particles. For bi-disperse suspensions, the pairs formed by large–large and small–small particles show higher segregation than mixed pairs. Hence particles tend to cluster more with those of the same size, probably because their dynamics is more similar.
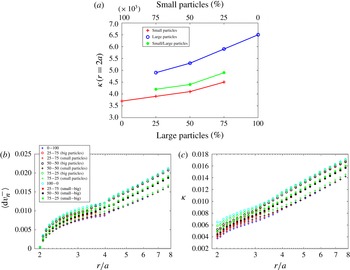
(a) Collision kernel at contact, (b) particle relative normal velocity and (c) extended collision kernel of the different particle pairs as a function of the distance between the particle surfaces.

The collision kernels for particles at contact are depicted in figure 11(a). The trend is not the same as for the particle-pair segregation, indicating the importance of the relative velocity for a collision to occur. In particular, we note that the normalised probability of collisions is the highest for pairs of large particles, followed by the probability of collisions between particles of different sizes and finally lowest for pairs of only small particles. Since the collision kernel is determined by the RDF times the average approaching velocity at contact, the observed differences are due to the pair dynamics. In figure 11(b) we therefore show the absolute value of the negative normal relative velocity as a function of the distance between particles. As expected, the absolute relative velocities increases monotonically with
 $r$
, see also Lashgari et al. (Reference Lashgari, Picano, Breugem and Brandt2016); however the rate is different for different particle sizes. Large particles exhibit the highest normal relative velocities at all separation distances while the opposite is true for small particles. This result is not surprising since large particles have more inertia and are expected to collide even when starting at larger separations, and the dynamics at larger separation is dominated by the most energetic large-scale turbulent fluctuations. As mentioned above, the product of the relative approaching velocity and the RDF determines the collision kernel, whose scale-by-scale behaviour is shown in figure 11(c). This quantity reduces decreasing inter-particle distances until it reaches the value at contact shown in the panel (a). Finally we note that the negative (approaching) relative velocity of pair particles at
 $r\approx 2a$
is small but not negligible. The relative velocities are reduced by the strong lubrication force acting when the distance between the two particles is small. On the other hand, the probability of finding pair particles at contact is high as shown in the plot of the radial distribution function. Thus, on average, a third particle approaching a pair feels the variation in the particle dynamics at
 $r=4a$
. This explains the change in the slope of the relative velocity and collision kernel around
 $r=4a$
.
5 Conclusion and discussion
We study turbulent channel flow of binary mixtures of finite-sized particles numerically. An immersed boundary method is employed to simulate the motion of finite-sized neutrally buoyant spheres by ensuring that the no-slip and no-penetration boundary conditions are satisfied on the surface of each particle. Short-range interactions are modelled with an analytical lubrication force correction and a soft-sphere collision model. The bulk Reynolds number and the total volume fraction of the solid phase are kept constant,
 $Re_{b}=5600$
and
 $\unicode[STIX]{x1D6F7}=0.2$
, while the ratio between the volume fraction of the small and large particles is varied. The ratio between the channel height and the diameter of the large and small particles are
 $2h/d_{s}=30$
and
 $2h/d_{l}=20$
, respectively. Five different particulate cases are simulated, denoted as 0–100, 25–75, 50–50, 75–25 and 100–0 according to the percentage of volume fraction of small and large particles in the flow. In this study we have reported the bulk behaviour of the flow, wall shear stress, turbulent statistics and particle dynamics for the different cases considered.
The presence of the solid phase significantly alters the fluid mean velocity with respect to that pertaining the unladen flow. In particular, the mean velocity profile is less blunt and the additive constant,
 $B$
, of the log profile,
 $U^{+}=(1/\unicode[STIX]{x1D705})\text{ln}\,y^{+}+B$
, decreases considerably. This indicates drag enhancement, as shown in Picano et al. (Reference Picano, Breugem and Brandt2015) for mono-disperse particle suspensions. The particle mean velocity profile shows large slip with respect to the fluid phase in the near-wall region and almost no-slip in the bulk of the channel. The slip at the wall increases with the relative percentage of large particles. Overall, the difference between the mean velocities of the binary mixtures and of the two mono-disperse flows at the same total volume fraction is small. A similar behaviour has also been observed by Richter, Garcia & Astephen (Reference Richter, Garcia and Astephen2016) in simulations of dilute particulate turbulent flow with a two-way coupling model. Therefore, we expect that the total particle volume fraction, and not the bi-dispersity of the particles, plays a major role in the bulk-flow properties even at low particle concentrations.
The profile of the local volume fraction is characterised by a homogenous particle distribution in the main body of the flow due to the turbulent mixing, while an inhomogeneous distribution is found near the wall where particle layering occurs. Considering the distribution of large and small particles separately, we observe a more intense layering of small particles. We remark that even in the case denoted 50–50, i.e. with equal volume fraction of small and large particles, the layering appears essentially only in the small particle statistics, which therefore control the near-wall dynamics. Similar observations are made when considering the profile of the mean particle number density.
We observe that the wall shear stress of the suspension parameterised by the friction Reynolds number does not change monotonically from the case of only small to only large particles, at same total volume fraction. The three cases 0–100, 25–75, 50–50 share similar values, which are the lowest, while the case 100–0 exhibits the highest value of wall friction. Recently, a theoretical model has been proposed by Costa et al. (Reference Costa, Picano, Brandt and Breugem2016) to predict the wall shear stress and the mean velocity profile of turbulent suspensions of mono-disperse rigid particles. In the model two modifications are considered with respect to the unladen turbulent channel flow, the effective suspension viscosity and the formation of the particle layer at the wall, whose thickness scales with the particle size. Here, we apply the same model to estimate the friction Reynolds number of the binary mixtures. To this end, we define an effective particle size responsible for the wall layering proportional to the distance from the wall of the local maximum of the volume fraction. For all the cases under investigation, the prediction obtained with this estimate of the thickness of the particle layer shows a good agreement with the simulation data. We finally remark that just using the effective viscosity the prediction is significantly underestimated, which confirms the key role of the particle layer on the drag increase.
As concerns the fluid and particle velocity fluctuations, we observe that the flow statistics vary monotonically between the two mono-disperse particulate cases. Comparing the statistics of particulate and unladen flows, we note that the turbulent activity reduces in the particulate cases when the particle stress becomes non-negligible. The peak of the streamwise velocity fluctuations is shifted away from the wall due to the formation of the particle layer that hinders the production of turbulent kinetic energy. The opposite is true for the wall-normal component since the interactions between the particles and the wall increase the level of fluctuations close to the wall. As regards the statistics of the particle phase, we note that the fluctuations do not vanish at the wall; however similar to the fluid the particle statistics change monotonically between the two mono-disperse particulate cases.
We also study the particle dynamics, i.e. particle dispersion and collisions for the different particle-laden flows. We observe that the two mono-disperse cases show a similar rate of particle dispersion in the spanwise direction, whereas a non-monotonic behaviour characterises the bi-disperse mixtures. This is explained by the disturbances introduced by the presence of particles of different sizes. We also study the particle collision dynamics by computing the radial distribution function and average normal relative velocity in the middle region of the channel,
 $0.25\leqslant y/2h\leqslant 0.75$
. These quantities are obtained separately for pairs consisting of two small, two large and one small and one large particle. The highest collision kernel is obtained for large–large particle pairs, followed by the mixed pairs and finally by the small–large particle pairs. This trend is determined by the relative velocity of approaching particles that is highest for larger particles. Conversely, we note from the RDF that particles of the same size tend to be more clustered at contact.
To conclude, we observe that the major effect of bi-dispersity is in the near-wall dynamics and in particular in the wall layering. This aspect has macroscopic consequences such as the non-monotonic variation of the overall drag when changing the relative percentage of small and large particles.
Acknowledgements
This work was supported by the European Research Council grant no. ERC-2013-CoG-616186, TRITOS and by the Swedish Research Council grant no. VR 2014-5001. The authors acknowledge computer time provided by SNIC (Swedish National Infrastructure for Computing) and the support from the COST Action MP1305: Flowing matter.
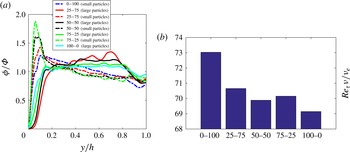
Appendix A. Laminar flow of binary mixture of spheres
In this appendix, we discuss the results of simulations of binary mixtures in laminar channel flow; i.e. we use the same set-up and specifications used for the turbulent cases presented above and decrease the bulk Reynolds number to
 $Re_{b}=1000$
. The simulations are initiated from the turbulent cases: we observe the level of fluctuation to decrease in time and then to level off. Once the steady state laminar condition is reached, we compute the statistics presented here.
The wall-normal profiles of the local volume fraction for the five particulate cases at
 $Re_{b}=1000$
are shown in figure 12(a). Comparing this result with the one of the turbulent flows we observe a significantly stronger segregation of small particles close to the wall. The introduction of large particles in the suspension pushes the small particles away from the bulk of the flow towards the near-wall region. Indeed the concentration of small particles is maximum at the wall and decreases monotonically towards the centre of the channel. The strong particle–particle and particle–wall interactions in the dense suspension move the position of the peak from (slightly closer to the wall in this case) the equilibrium of a single sphere in Poiseuille flow at the same Reynolds number (Segré & Silberberg Reference Segré and Silberberg1961; Asmolov Reference Asmolov1999). As regards the concentration profile of the large particles, we also observe a second peak in the region between the wall and the core of the channel. This peak is more evident for the case 25–75, when the number of large particles is lower. This finding is in line with the experimental data of Matas, Morris & Guazzelli (Reference Matas, Morris and Guazzelli2004) where the formation of a second peak in the local volume fraction profile, close to the pipe centre, is reported for large particles. The formation of the second peak is attributed to the concavity of the lift force profile which is predicted by asymptotic theory for channel flow at large Reynolds numbers. Since we compute the statistics after the flow reaches statistically steady state, we believe the formation of the second peak is not a transient phenomenon as it is questioned in the final discussion by Matas et al. (Reference Matas, Morris and Guazzelli2004).
In figure 12(b) we show the friction Reynolds number of the laminar cases normalised by the effective viscosity of the suspension. The normalised wall shear stress of the laminar cases are significantly lower than those of the turbulent flows. This is directly connected to the reduction of the fluid and particle Reynolds stresses in laminar condition. Unlike in the turbulent cases, the largest wall shear stress is obtained for the case
 $0{-}100$
, i.e., only small particles. This is attributed to the higher dissipation induced by small particles as these are characterised by largest surface area for the same volume fraction, as indicated by Elghobashi (Reference Elghobashi1994).
(a) Profile of local particle concentration and (b) friction Reynolds number for the five bi-disperse flows in laminar regime (
 $Re_{b}=1000$
). In (a) the contributions of small and large particles are shown separately.