1. Introduction
During Late Cretaceous time, extensive basaltic magmatism occurred in Madagascar. Remnants of this igneous province crop out along the rifted margin of the eastern coast, in the Mahajanga and Morondava basins of western Madagascar and directly above the Precambrian basement, and comprise lava flows, dykes, sills and intrusive complexes (Mahoney, Nicollet & Dupuy, Reference Mahoney, Nicollet and Dupuy1991; Storey et al. Reference Storey, Mahoney, Saunders, Duncan, Kelley and Coffin1995; Storey, Mahoney & Saunders, Reference Storey, Mahoney, Saunders, Mahoney and Coffin1997; Melluso et al. Reference Melluso, Morra, Brotzu, Razafiniparany, Ratrimo and Razafimahatratra1997, Reference Melluso, Morra, Brotzu and Mahoney2001, Reference Melluso, Morra, Brotzu, D'Antonio, Bennio, Menzies, Ebinger and Baker2002, Reference Melluso, Morra, Brotzu, Franciosi, Petteruti Lieberknecht and Bennio2003, Reference Melluso, Morra, Brotzu, Tommasini, Renna, Duncan, Franciosi and d'Amelio2005, Reference Melluso, Sheth, Mahoney, Morra, Petrone and Storey2009; Melluso, Morra & Fedele, Reference Melluso, Morra and Fedele2006; Mahoney et al. Reference Mahoney, Saunders, Storey and Randriamanantenasoa2008; Fig. 1a). The original pre-erosion extent of the province is difficult to estimate, although it probably exceeded 1 × 10⁶ km2 (this estimate includes the Madagascar Plateau, which flanks the south coast of Madagascar, and the Conrad Rise; Storey et al. Reference Storey, Mahoney, Saunders, Duncan, Kelley and Coffin1995). The dominant rock type is tholeiitic basalt. Silicic rocks do not represent a substantial part of the eruptive stratigraphy (e.g. Melluso et al. Reference Melluso, Sheth, Mahoney, Morra, Petrone and Storey2009; Cucciniello et al. Reference Cucciniello, Langone, Melluso, Morra, Mahoney, Meisel and Tiepolo2010). Only in the Volcan de l'Androy complex (southern Madagascar) are silicic rocks abundant, and even there they are interbedded with basaltic flows (Mahoney et al. Reference Mahoney, Saunders, Storey and Randriamanantenasoa2008).
(a) Simplified geological map of Madagascar, showing the outcrops of Cretaceous igneous rocks (black and dark grey areas). Published 40Ar–39Ar and U–Pb ages that are considered to be reliable for the Madagascar Cretaceous igneous province are also indicated (± 2σ). 40Ar–39Ar ages have been recalculated using the new decay constants determined by Renne et al. (Reference Renne, Mundil, Balco, Min and Ludwig2010). New 40Ar–39Ar ages for the Antanimena plateau (in Ma) are in bold. (b) Sketch map of the Mahajanga basin (after Besairie, Reference Besairie1964) with the location of four magma groups recognized by Melluso et al. (Reference Melluso, Morra, Brotzu, Razafiniparany, Ratrimo and Razafimahatratra1997). (c) Schematic geological cross-section of the onshore Mahajanga basin (after Banks et al. Reference Banks, Cooper, Jenkins and Razafindrakoto2008). The basin can be divided into a Permo-Triassic failed rift filled with Karoo-related sediments (towards the east) and a Late Jurassic–Cenozoic passive margin filled with a thick succession of deposits post-Triassic (towards the west). Q – Quaternary; Mi – Miocene; Ol – Oligocene; EO–PC – Eocene–Paleocene; KU – Upper Cretaceous; KL – Lower Cretaceous; JU – Upper Jurassic; JM – Middle Jurassic; JLu – Lower Jurassic undifferentiated; JLL – Lowest Lower Jurassic; P–Tr – Permian–Triassic; BSMT – Basement.

Published 40Ar–39Ar and U–Pb ages indicate that the Madagascar Cretaceous igneous province was emplaced over a period of several million years between 92 and 84 Ma (Storey et al. Reference Storey, Mahoney, Saunders, Duncan, Kelley and Coffin1995; Torsvik et al. Reference Torsvik, Tucker, Ashwal, Eide, Rakotosolofo and Wit1998; Melluso et al. Reference Melluso, Morra, Brotzu, Tommasini, Renna, Duncan, Franciosi and d'Amelio2005; Cucciniello et al. Reference Cucciniello, Langone, Melluso, Morra, Mahoney, Meisel and Tiepolo2010, Reference Cucciniello, Conrad, Grifa, Melluso, Mercurio, Morra, Tucker, Vincent and Srivastava2011). In the south, the 40Ar–39Ar ages are mainly concentrated along the eastern coast (Mananjary and Vatomandry transects) and in the Androy area (Volcan de l'Androy complex), and range from 90 to 84 Ma (Storey et al. Reference Storey, Mahoney, Saunders, Duncan, Kelley and Coffin1995; Cucciniello et al. Reference Cucciniello, Conrad, Grifa, Melluso, Mercurio, Morra, Tucker, Vincent and Srivastava2011). In the north, the 40Ar–39Ar ages are mainly focused in the eastern Mahajanga basin (Bongolava–Manasamody plateau) and in the Sambava and Tamatave districts, and range from 86 to 90 Ma (Storey et al. Reference Storey, Mahoney, Saunders, Duncan, Kelley and Coffin1995). U–Pb ages are few and are available for the capping rhyodacitic unit of the Mailaka lava succession and for the Analalava and Antampombato–Ambatovy intrusions, and range from 90 to 92 Ma (Torsvik et al. Reference Torsvik, Tucker, Ashwal, Eide, Rakotosolofo and Wit1998; Melluso et al. Reference Melluso, Morra, Brotzu, Tommasini, Renna, Duncan, Franciosi and d'Amelio2005; Cucciniello et al. Reference Cucciniello, Langone, Melluso, Morra, Mahoney, Meisel and Tiepolo2010). However, all available age determinations are insufficient because they do not cover the whole province, ignoring many important areas such as the western Mahajanga basin (Antanimena plateau) and the Mailaka basaltic lava succession. In addition, most of the previous 40Ar–39Ar ages are not of optimum robustness (a critical review of previous age determinations is given in Section 4) and this can affect understanding of the true duration of the Madagascar province.
An extensive study of the igneous rocks that crop out along the eastern coast (Sambava, Tamatave and Mananjary sectors) of the province was carried out by Storey, Mahoney & Saunders (Reference Storey, Mahoney, Saunders, Mahoney and Coffin1997). They identified two compositional trends (Trends I and II). Trend I appears to have been derived by mixing of normal mid-ocean-ridge-basalt (MORB)-like mantle and a Marion hotspot component, whereas Trend II is consistent with mixing of a low 206Pb/204Pb lithospheric-mantle-derived component with a normal-MORB-like mantle component. In addition, some high-Si, low-Ti-Nb basalts in the Mananjary district show signs of crustal contamination (Storey, Mahoney & Saunders, Reference Storey, Mahoney, Saunders, Mahoney and Coffin1997).
Melluso et al. (Reference Melluso, Morra, Brotzu, Tommasini, Renna, Duncan, Franciosi and d'Amelio2005) reported mineral and geochemical data for the Antampombato–Ambatovy complex and associated dyke swarm of central-eastern Madagascar. They noted that the Sr–Nd isotopic ratios for the mafic-ultramafic rocks are most similar to those of the MORB-like igneous rocks of eastern Madagascar, and suggested the existence of a component in the source of the entire Madagascar province that had a long history of relative depletion in the highly incompatible elements.
The tholeiitic rocks (from picritic basalts to rhyodacites) from the Mailaka district (Fig. 1) are depleted in high-field-strength elements (HFSE) and show a wide range in Sr–Nd–Pb isotope ratios. The transitional rocks (from picritic basalts to basalts) have incompatible element abundances and Pb, Os and Nd isotope ratios within the range of MORB. Melluso et al. (Reference Melluso, Morra, Brotzu and Mahoney2001, Reference Melluso, Morra, Brotzu, Franciosi, Petteruti Lieberknecht and Bennio2003) and Cucciniello et al. (Reference Cucciniello, Langone, Melluso, Morra, Mahoney, Meisel and Tiepolo2010) argued that the Mailaka tholeiitic rocks were derived from a MORB-like mantle source, but contaminated by continental crust en route to the surface. In contrast, the chemical variations observed in transitional basalt lavas and dykes in this area were attributed to nearly closed-system fractional crystallization.
Detailed studies of the southern part of this province were reported by Mahoney, Nicollet & Dupuy (Reference Mahoney, Nicollet and Dupuy1991), Dostal et al. (Reference Dostal, Dupuy, Nicollet and Cantagrel1992) and Mahoney et al. (Reference Mahoney, Saunders, Storey and Randriamanantenasoa2008). These authors identified: (1) tholeiitic basalts in the southeastern coastal area; (2) tholeiitic basalts and basaltic andesites in the southwestern area and in the Ejeda–Bekily dyke swarm; (3) dykes of alkaline basalts and basanites; and (4) tholeiitic and andesitic basalts (Group B1), transitional basalts (Group B2) and rhyolites (Group R1 and R2) in the Androy complex. Mahoney, Nicollet & Dupuy (Reference Mahoney, Nicollet and Dupuy1991) showed that the southwestern tholeiitic basalts were variably contaminated by ancient, low ɛNd and high 87Sr/86Sr continental material, whereas the Ejeda–Bekily alkaline rocks seem not to have been contaminated by continental material. Three different mantle sources (Marion hotspot, a N-MORB-like component and an unusual low 206Pb/204Pb, low-ɛNd source) were invoked to explain the different geochemical features observed.
The focus of this paper is on a basalt sequence exposed in the northern part of the Madagascar Cretaceous igneous province (Mahajanga basin; Fig. 1). Detailed studies of the northern Madagascar basalts were published by Melluso et al. (Reference Melluso, Morra, Brotzu, Razafiniparany, Ratrimo and Razafimahatratra1997, Reference Melluso, Morra, Brotzu, D'Antonio, Bennio, Menzies, Ebinger and Baker2002, Reference Melluso, Morra, Brotzu, Franciosi, Petteruti Lieberknecht and Bennio2003). They argued on the basis of trace element and Sr–Nd isotopic data that the basaltic rocks from the Antanimena plateau (Groups A and C) were derived from a MORB-like mantle source and affected by variable amounts of contamination by crustal materials, whereas the basalts from the Bongolava–Manasamody plateau (Groups B and D) were derived from long-term incompatible-element-enriched lithospheric mantle and that crustal assimilation was minor. However, the nature of the crustal contaminants and the role of the Marion hotspot (heat source to the lithosphere or magma source) are not well understood. The Pb isotope system, when combined with other isotopic systems, can help significantly to identify crustal components in mantle-derived magmas because U, Th and Pb are more enriched in the continental crust than in the mantle and fractionation of the U/Pb and Th/Pb ratios during crustal processes (e.g. metamorphism, hydrothermal alteration) can be large (e.g. Kramers & Tolstikhin, Reference Kramers and Tolstikhin1997).
The Re–Os isotopic system is another potentially powerful tool for tracing the crustal components in mantle-derived magmas. The different behaviour of Re and Os during melting or fractional crystallization (Os behaves compatibly during partial melting and fractional crystallization, whereas Re is a mildly incompatible element) yields, over time, two clearly distinct types of Os isotope signatures in mantle and crustal reservoirs (e.g. Shirey & Walker, Reference Shirey and Walker1998; Saal et al. Reference Saal, Rudnick, Ravizza and Hart1998). Significant differences in Re and Os concentration between the continental crust and the mantle make hot mantle-derived magmas ultra-sensitive to crustal contamination. In addition, the Re–Os system may be used to distinguish between different mantle components involved in the genesis of basaltic magmas (e.g. Xu et al. Reference Xu, Suzuki, Xu, Mei and Li2007; Dale et al. Reference Dale, Pearson, Starkey, Stuart, Ellam, Larsen, Fitton and Macpherson2009).
In this paper we present new high-precision 40Ar–39Ar ages and Pb–Os isotope data to assess the petrogenesis of each magma type and evaluate the role of crustal contamination. Details of analytical methods are given in Appendix 1. In addition, we give a brief outline of a scenario for the origin of the Mahajanga flood basalt sequence.
2. Geological setting
During Proterozoic and early Palaeozoic times, Madagascar was situated within the East African Orogen (EAO; e.g. Stern, Reference Stern1994). From Permo-Carboniferous times onwards, crustal extension in the centre of Gondwana determined the formation of three major sedimentary basins along the western margin of Madagascar (Morondava, Mahajanga and Ambilobe basins; Fig. 1a). The Mahajanga basin is the second largest basin of Madagascar and extends for almost 400 km along the northwestern coast (Fig. 1b). It is filled by a thick sequence of sediments of the Karoo Supergroup (Besaire & Collignon, Reference Besairie and Collignon1972; Razafindrazaka et al. Reference Razafindrazaka, Randriamananjara, Pique, Thouin, Laville, Malod and Rehault1999; Banks et al. Reference Banks, Cooper, Jenkins and Razafindrakoto2008; Fig. 1b, c). The sediments overlie the basement, which is composed of deformed and metamorphosed Precambrian granitoids and subordinate mafic-ultramafic rocks, ranging in age between 3.2 Ga and ≈ 550 Ma (e.g. Tucker et al. Reference Tucker, Ashwal, Handke, Hamilton, Le Grange and Rambeloson1999; Collins & Windley, Reference Collins and Windley2002; De Waele et al. Reference De Waele, Thomas, Macey, Horstwood, Tucker, Pitfield, Schofield, Goodenough, Bauer, Key, Potter, Armstrong, Miller, Randriamananjara, Ralison, Rafahatelo, Rabarimanana and Bejoma2011). The sedimentary rocks of the Karoo Supergroup are subdivided into the Sakoa (Late Carboniferous/Early Permian), Sakamena (Late Permian/Early Triassic) and Isalo (Late Triassic/Early Jurassic) groups. The Sakoa group is absent in the Mahajanga basin. The Sakamena and Isalo groups are composed of continental sediments with minor marine deposits, whereas the post-Karoo sequences (from Middle Jurassic to present) are mainly marine (Fig. 1b, c). During Late Cretaceous time, a sequence (up to 200 m remaining thickness) of flood basalts covered the Permo-Triassic to Lower Cretaceous sedimentary succession. The basalt flows crop out in a wide area of the basin (forming the Antanimena and Bongolava–Manasamody plateaus) and gently dip northwards (≈ 1°). Determination of a clear stratigraphic order for these basalts is precluded because of flat morphology and generally poor exposure of the outcrops. Melluso et al. (Reference Melluso, Morra, Brotzu, D'Antonio, Bennio, Menzies, Ebinger and Baker2002) argued that the Group D basalts partially overlap the Group B basalts in the upper sequence, because no Group D basalts have been found in the Bongolava area, whereas Group B basalts were observed at the end of the sequence in some parts of the Manasamody plateau (Fig. 1b). A dyke swarm is present south of the Antanimena plateau. The chemical and isotopic composition of the dykes is identical to that of the basaltic flows.
Remnants of Cretaceous lava flows also crop out in the Tampoketsa Kamoreen area (about 150 km southeast of Mahajanga; Fig. 1a). The lava flows lie directly above mafic granulites, amphibole gneisses and muscovite-bearing leucogneisses of the Precambrian basement (Melluso et al. Reference Melluso, Morra, Brotzu, Franciosi, Petteruti Lieberknecht and Bennio2003; De Waele et al. Reference De Waele, Thomas, Macey, Horstwood, Tucker, Pitfield, Schofield, Goodenough, Bauer, Key, Potter, Armstrong, Miller, Randriamananjara, Ralison, Rafahatelo, Rabarimanana and Bejoma2011).
3. Geochemical characteristics of the Mahajanga lavas
Representative major and trace element analyses of rocks of the northern part of the Madagascar Cretaceous igneous province are given in Table S1 in the online Supplementary Material (available at http://www.journals.cambridge.org/geo). The samples we have studied have previously been analysed for major elements, trace elements and Sr–Nd isotopes by Melluso et al. (Reference Melluso, Morra, Brotzu, Razafiniparany, Ratrimo and Razafimahatratra1997, Reference Melluso, Morra, Brotzu, D'Antonio, Bennio, Menzies, Ebinger and Baker2002, Reference Melluso, Morra, Brotzu, Franciosi, Petteruti Lieberknecht and Bennio2003). Melluso et al. (Reference Melluso, Morra, Brotzu, Razafiniparany, Ratrimo and Razafimahatratra1997) identified two groups of rocks (A and C) in the Antanimena plateau. Both groups are tholeiitic and range from picritic basalt to basaltic andesite (MgO ranges from 13.2 to 3.3 wt%). The basalts and basaltic andesites are nearly aphyric and contain plagioclase, augite, pigeonite, Fe-Ti oxide and glass. Plagioclase and augite are the dominant phases, both as microphenocrysts and microlites in the groundmass. The picritic basalt (M422) has olivine phenocrysts set in an ophitic matrix of olivine, plagioclase, clinopyroxene and opaque oxides. Full details on the petrography and mineral compositions of these rocks can be found in Melluso, Morra & Fedele (Reference Melluso, Morra and Fedele2006) and Melluso et al. (Reference Melluso, Morra, Brotzu, Razafiniparany, Ratrimo and Razafimahatratra1997).
Group A is a low Nb-Ti magma type (represented by samples M78, M83, M420 and M422) characterized by < 1.5 wt% TiO2, 2–6 μg g−1 Nb and 82–126 μg g−1 Zr (Fig. 2). All Group A samples are mildly enriched in the light lanthanides (light rare earth elements (LREEs)), with Lan/Ybn ranging from 1.4 to 4.1 (the subscript ‘n’ means chondrite normalized; Boynton, Reference Boynton and Henderson1984). Their REE patterns are relatively flat in the middle and heavy REE portions of the pattern (Fig. 3a), with Smn/Lun ≈ 1.8. Mantle-normalized incompatible element patterns of Group A lavas (Fig. 3b) display peaks at Ba and Pb and troughs at Th and Nb.
Variations in TiO2 v. MgO, wt% (a) and Zr v. Nb, μg g−1 (b) showing the composition of Mahajanga mafic rocks. The data for Mahajanga rocks are from Melluso et al. (Reference Melluso, Morra, Brotzu, Razafiniparany, Ratrimo and Razafimahatratra1997, Reference Melluso, Morra, Brotzu, D'Antonio, Bennio, Menzies, Ebinger and Baker2002, Reference Melluso, Morra, Brotzu, Franciosi, Petteruti Lieberknecht and Bennio2003 and unpub. data).

(a, c) Chondrite-normalized REE diagrams for Groups A and C and Groups B and D of the Mahajanga basin. Normalizing chondrite values are after Boynton (Reference Boynton and Henderson1984). (b, d) Primitive mantle-normalized incompatible element diagrams for Groups A and C and Groups B and D of the Mahajanga basin. Primitive mantle values are from Lyubetskaya & Korenaga (Reference Lyubetskaya and Korenaga2007). Average normal mid-ocean ridge basalt (N-MORB) is from Niu & O'Hara (Reference Niu and O'Hara2003). Marion hotspot data are from Mahoney et al. (Reference Mahoney, le Roex, Peng, Fisher and Natland1992).

Group C consists of low Nb, high Ti-Fe lavas (e.g. M54, M87, M421 and Cava) with 2.1–2.6 wt% TiO2, 14.4–15.6 wt% Fe2O3t, 121–200 μg g−1 Zr and 3–9 μg g−1 Nb (Fig. 2). Chondrite-normalized REE patterns for Group C rocks are comparable to those of Group A (Lan/Ybn = 3.0–4.5; Lan = 38–65 times chondrite; Fig. 3a). In mantle-normalized multi-element patterns (Fig. 3b), the Group C rocks show a trough at Nb and peaks at Ba and Pb similar to those of Group A.
Igneous samples from the Bongolava–Manasamody plateau were also subdivided by Melluso et al. (Reference Melluso, Morra, Brotzu, Razafiniparany, Ratrimo and Razafimahatratra1997) into two groups (B and D). They belong to tholeiitic series (from basalt to basaltic andesite) and are mostly aphyric, with rare plagioclase and augite microphenocrysts in a matrix of plagioclase, augite, orthopyroxene and/or pigeonite, Fe-Ti oxides and fresh glass. Microlites of olivine are present in a few samples of Group B and in the Tampoketsa Kamoreen basalts.
Group B (e.g. M32 and M60) is the most abundant magma type of the Mahajanga basin and shows moderate TiO2 (2.2–2.5 wt%) and Nb (8–13 μg g−1) and low K2O and Rb (< 0.34 wt% and < 7 μg g−1, respectively) contents (Fig. 2), and relatively high abundances of the LREEs (Lan = 35–37 times chondrite; Fig. 3c). In Figure 3d, the Group B basalts have peaks at Ba and troughs at K, and smoothly decreasing normalized abundances from La to Lu.
Group D basalts (e.g. M7a, M41, M45 and TK405; the Tampoketsa Kamoreen basalts belong to Group D) are characterized by high TiO2 (3.3–4.9 wt%), Nb (15–24 μg g−1) and Zr (217–327 μg g−1) contents (Fig. 2). They are the most LREE enriched of the four magma groups, with Lan/Ybn values of 5.6–7.8 and Lan contents of 64–98 times chondrite (Fig. 3c). They also have relatively smooth incompatible-element enriched patterns similar to those of present-day Marion hotspot basalts, except for Nb (Fig. 3d).
Alteration effects on major and trace elements appear minor. Most of the rocks studied are relatively fresh, as shown by low loss on ignition (LOI) values (Table S1 in the online Supplementary Material at http://www.journals.cambridge.org/geo) and by poor correlations between LOI and trace element contents.
The Antanimena rocks cover a wide range of (87Sr/86Sr)i and (143Nd/144Nd)i (corrected to 90 Ma), from 0.70331 to 0.70837 and from 0.51197 to 0.51253 (ɛNdi = +0.1 to −10.8), respectively. The picritic basalt (M422) has the highest ɛNdi and lowest (87Sr/86Sr)i. The Bongolava–Manasamody rocks have less radiogenic (87Sr/86Sr)i (0.70377–0.70533) and more radiogenic ɛNdi (+1.0 to +4.0) than the Antanimena rocks. Melluso et al. (Reference Melluso, Morra, Brotzu and Mahoney2001, Reference Melluso, Morra, Brotzu, Franciosi, Petteruti Lieberknecht and Bennio2003) showed that there is a marked similarity between the geochemical features of the Antanimena rocks and those of the Mailaka district (tholeiitic series). Both have low Nb, Zr and ɛNdi and high Ba and (87Sr/86Sr)i values (Fig. 4). The Bongolava–Manasamody rocks have trace element contents and Sr–Nd isotopic composition similar to lava flows of the Sambava sector and the Tamatave–Sainte Marie dyke swarm (Melluso et al. Reference Melluso, Morra, Brotzu, D'Antonio, Bennio, Menzies, Ebinger and Baker2002; Fig. 4).
Sr and Nd isotopic compositions of Mahajanga rocks. The data for other basaltic rocks of the Madagascar igneous province are from Melluso et al. (Reference Melluso, Morra, Brotzu and Mahoney2001, Reference Melluso, Morra, Brotzu, D'Antonio, Bennio, Menzies, Ebinger and Baker2002, Reference Melluso, Morra, Brotzu, Franciosi, Petteruti Lieberknecht and Bennio2003, Reference Melluso, Morra, Brotzu, Tommasini, Renna, Duncan, Franciosi and d'Amelio2005), Storey, Mahoney & Saunders (Reference Storey, Mahoney, Saunders, Mahoney and Coffin1997), Mahoney, Nicollet & Dupuy (Reference Mahoney, Nicollet and Dupuy1991) and Mahoney et al. (Reference Mahoney, Saunders, Storey and Randriamanantenasoa2008). The high TiO2 (> 3 wt%) basalts of Mananjary define Trend I. The Sambava and low TiO2 (< 2 wt%) Mananjary basalts (including the high Mg-Ti basalts), and the Tamatave-Sainte Marie dyke swarm form Trend II.

4. Review of published Madagascar Cretaceous Igneous Province ages: optimized age selection
Few 40Ar–39Ar ages are available for the Madagascar Cretaceous igneous province (Storey et al. Reference Storey, Mahoney, Saunders, Duncan, Kelley and Coffin1995; Torsvik et al. Reference Torsvik, Tucker, Ashwal, Eide, Rakotosolofo and Wit1998; Melluso et al. Reference Melluso, Morra, Brotzu, Tommasini, Renna, Duncan, Franciosi and d'Amelio2005). We have reviewed and filtered the published dataset based on the χ2 statistical test approach (see Baksi, Reference Baksi, Foulger and Jurdy2007a,Reference Baksi, Foulger and Jurdyb; Nomade et al. Reference Nomade, Knight, Beutel, Renne, Verati, Féraud, Marzoli, Youbi and Bertrand2007; Jourdan et al. Reference Jourdan, Féraud, Bertrand, Watkeys and Renne2007) in order to screen out unreliable ages (Table S2 in the online Supplementary Material at http://www.journals.cambridge.org/geo). Even if harsh, we chose this approach as it allows unambiguous and secure assessment of ages of the different parts of the province and the duration of the province overall. In addition, the filtered 40Ar–39Ar ages have been recalculated using the new decay constants determined by Renne et al. (Reference Renne, Mundil, Balco, Min and Ludwig2010) so that these ages are fully comparable with U–Pb ages (see below). All the uncertainties associated with these ages (including systematic error on the decay constants) have been included (Table S3 in the online Supplementary Material at http://www.journals.cambridge.org/geo). We did not use published K–Ar ages for the Madagascar Cretaceous igneous province because of the high probability of post-eruptive alteration and/or excess 40Ar and the impossibility of verifying either quantitatively, due to the limitations of this technique (McDougall & Harrison, Reference McDougall and Harrison1999).
Storey et al. (Reference Storey, Mahoney, Saunders, Duncan, Kelley and Coffin1995) reported 17 40Ar–39Ar age determinations (made using whole-rock step heating and laser fusion of single and multiple feldspar grains) for basalt and rhyolite samples from the eastern coast of Madagascar (Sambava, Tamatave and Mananjary sectors), the Mahajanga (Bongolava plateau) and Morondava basins, and southern Madagascar (Volcan de l'Androy complex and Ejeda–Bekily dyke swarm). The ages range from 90 to 84 Ma, generally decreasing from north to south. While undoubtedly close to the crystallization age at the few million-year timescale, 40Ar–39Ar measurements performed on whole rocks are generally not trustworthy for old rocks, as they invariably contain cryptic alteration that can offset the age by as much as a few million years, even if a plateau is developed (e.g. Deccan Traps – Hofmann, Féraud & Courtillot, Reference Hofmann, Féraud and Courtillot2000; Central Atlantic Magmatic Province – Nomade et al. Reference Nomade, Knight, Beutel, Renne, Verati, Féraud, Marzoli, Youbi and Bertrand2007; Karoo – Jourdan et al. Reference Jourdan, Féraud, Bertrand, Watkeys and Renne2007). Furthermore, the laser fusion method applied to plagioclase is not a true step-heating approach. It is assumed that all grains would produce a 100% plateau age and then an isochron is built from all the total fusion experiments. A 100% plateau for plagioclase is demonstrated not to be the case for most of the Madagascar rocks (see below). Nevertheless, because of the relatively large uncertainty on these ages (typically ± 1 to ± 10 Ma), these results are likely to approach the true age within error.
Torsvik et al. (Reference Torsvik, Tucker, Ashwal, Eide, Rakotosolofo and Wit1998) reported an 40Ar–39Ar age of 83.6 ± 1.6 Ma (using whole-rock step heating) for a basalt from the southwestern part of the Morondava basin. Although the sample yielded a ‘mini-plateau’ with 56% of the gas, the shape of the spectrum is seriously perturbed. Therefore, this age is not considered reliable for the purpose of high-precision geochronology.
None of the reported 40Ar–39Ar data from the Antampombato–Ambatovy intrusion (Melluso et al. Reference Melluso, Morra, Brotzu, Tommasini, Renna, Duncan, Franciosi and d'Amelio2005) meet the definition of a plateau and the shape of the spectra is highly structured, and the use of the isochron to calculate an age is not correct. If there is indeed excess Ar, then most if not all the points should fit on the isochron; otherwise, selecting the points at the bottom of the saddle shape will produce a spurious arbitrary result. These ages are undoubtedly close to the crystallization age (≈ 89 Ma), but can have easily been shifted by 3–4 Ma either way.
Plagioclase separates from the rhyolite of the Sakanila massif (eastern Madagascar) yielded a reliable 40Ar–39Ar age of 88.7 ± 0.6 Ma (MSWD, mean standard weighted deviation = 1.75; Cucciniello et al. Reference Cucciniello, Conrad, Grifa, Melluso, Mercurio, Morra, Tucker, Vincent and Srivastava2011).
Four zircon U–Pb ages are available for the Madagascar Cretaceous igneous province. Two are for the capping rhyodacitic unit of the Mailaka lava succession (89.7 ± 1.4 Ma and 90.7 ± 1.1 Ma; Cucciniello et al. Reference Cucciniello, Langone, Melluso, Morra, Mahoney, Meisel and Tiepolo2010). The other two ages are for the Analalava gabbro intrusion (weighted mean 206Pb–238U age of 91.6 ± 0.3 Ma for all analyses of zircon and baddeleyite; Torsvik et al. Reference Torsvik, Tucker, Ashwal, Eide, Rakotosolofo and Wit1998) and Antampombato–Ambatovy complex (90.0 ± 2.0 Ma; Melluso et al. Reference Melluso, Morra, Brotzu, Tommasini, Renna, Duncan, Franciosi and d'Amelio2005). Zircons and baddeleyites from the sample of the Analalava intrusion do not yield concordant results and only one of the two populations can be used to calculate the age of the gabbro as they record different events. In general, zircon is the mineral of choice for U–Pb dating of silicic volcanic rocks as it usually provides the most reliable ages owing to its robustness to alteration, although we note that it can often yield an age offset of 0.1 and up to 0.6 Ma because of its residence time in a magma chamber (e.g. Simon, Renne & Mundil, Reference Simon, Renne and Mundil2008). Hereafter, we consider the zircon U–Pb age of 91.8 ± 0.2 Ma as the best estimate for the crystallization age of the Analalava gabbro.
5. 40Ar–39Ar results
Detailed 40Ar–39Ar results for the two samples from the Antanimena plateau (belonging to the A group) are shown in Tables 1 and 2. Plagioclase separated from picritic basalt M422 gave a plateau age of 92.3 ± 2.0 Ma (MSWD = 1.21 and probability, P, value of 0.29; 2σ, all uncertainty included; Fig. 5a) including 77.8% of the 39Ar released. The inverse isochron age (90.4 ± 3.3 Ma; MSWD = 1.06) is within two standard deviations of the plateau age (Fig. 5a) and the isochron has an initial 40Ar/36Ar ratio of 307 ± 16 within error of the value of the atmospheric ratio adopted in this study (295.5).
Ar data summary for individual aliquots of Mahajanga plagioclase separates

Values are corrected for mass discrimination, blanks and radioactive decay. Uncertainties are given at the 1σ level. 40Ar* – radiogenic argon. J – irradiation parameter. Age is based on comparison with the GA1550.
Summary table indicating plateau and isochron ages for the Mahajanga plagioclase separates

MSWD for plateau and inverse isochron, probability (P) for plateau, percentage of 39Ar degassed used in the plateau calculation and 40Ar/36Ar intercept are indicated. Analytical uncertainties on the ages are quoted at 2 sigma (2σ).
Plagioclase age spectra and inverse isochron plots for basaltic rocks from the Antanimena plateau. The horizontal lines close to the plateau age indicate the steps used in the age calculation. Errors on plateau ages (plateaus include > 70% 39Ar released) are quoted at 2σ and include all sources of uncertainties. MSWD, P values and 40Ar/36Ar intercept are indicated.

Plagioclase separated from tholeiitic basalt M420 yielded a well-defined plateau age of 91.5 ± 1.3 Ma (MSWD = 0.38; P = 0.96; Fig. 5b), defined by 98.7% of the total 39Ar released. The inverse isochron age (91.5 ± 1.3 Ma) and initial 40Ar/36Ar ratio (296 ± 8) are indistinguishable from the plateau age and air ratio, respectively.
The two plateau ages of 92.3 ± 2.0 and 91.5 ± 1.3 Ma determined for the Antanimena plateau are indistinguishable. In addition, these ages are in agreement within uncertainties, with the U–Pb ages of ~ 90–92 Ma obtained for the Analalava intrusion and the capping rhyodacitic unit of the Mailaka lava succession (Torsvik et al. Reference Torsvik, Tucker, Ashwal, Eide, Rakotosolofo and Wit1998; Cucciniello et al. Reference Cucciniello, Langone, Melluso, Morra, Mahoney, Meisel and Tiepolo2010).
6. Age and duration of the northern part of the Madagascar Cretaceous igneous province
The new ages obtained in this study suggest that the magmatism in the western Mahajanga basin (Antanimena plateau) started about 92 Ma ago. These ages are close to although distinctly younger than the Cenomanian–Turonian (C–T; 93.6 ± 0.8 Ma; Gradstein, Ogg & Smith, Reference Gradstein, Ogg and Smith2005) boundary and are indistinguishable from the U–Pb ages available for this part of the province ranging from 89.7 ± 1.4 Ma and 90.7 ± 1.1 Ma (Cucciniello et al. Reference Cucciniello, Langone, Melluso, Morra, Mahoney, Meisel and Tiepolo2010). The 40Ar–39Ar ages of 89.0 ± 5.9 and 87.6 ± 3.7 Ma reported by Storey et al. (Reference Storey, Mahoney, Saunders, Duncan, Kelley and Coffin1995; recalculated using the new decay constants determined by Renne et al. Reference Renne, Mundil, Balco, Min and Ludwig2010) for the Bongolava–Manasamody plateau overlap or are marginally younger within uncertainty than the ages obtained in this study. The large uncertainty of these apparent ages, however, precludes their use to estimate the duration of the emplacement of the lava pile. In addition, as discussed in Section 4, the validity of the ages obtained using the whole-rock step-heating method and laser fusion of single and multiple feldspar grains can be compromised and are deemed unreliable for high-precision geochronology, because of potential cryptic alteration, recoil and/or excess argon problems. Two new 40Ar–39Ar and four previously published U–Pb ages are altogether statistically distinguishable (P = 0.007) and therefore, can be used to estimate the duration of the magmatic activity of this part of the Madagascar Cretaceous igneous province. A standard deviation of ± 1.0 Ma and a mid-peak width of 2 Ma on the probability density distribution plot (not shown; n = 6), suggest an approximated duration on the order of ~ 2 Ma. Note, however, that this does not preclude that the bulk of the magmatic volume erupted in a shorter time span although volcanic intrusions occurred over a slightly longer period. Nevertheless, the age of emplacement of the Mahajanga flood basalt sequence can be fully addressed using a larger dataset.
7. Isotope geochemistry
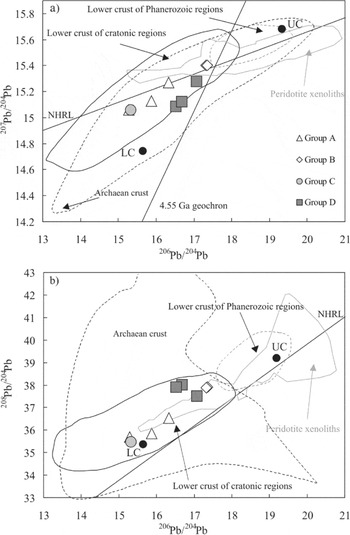
Lead isotope compositions for the Mahajanga rocks are presented in Table 3 and in Figure 6a and b. The Antanimena rocks (Groups A and C) have very low 206Pb/204Pb (15.283–16.325), 207Pb/204Pb (15.058–15.269) and 208Pb/204Pb (35.483–36.547). Their Pb isotope ratios correlate well with each other (Fig. 6a, b). The Bongolava–Manasamody basalts (Groups B and D) have higher 206Pb/204Pb (16.518–17.355) and 208Pb/204Pb (37.511–38.009) than the Antanimena samples, but similar 207Pb/204Pb (15.086–15.404). As shown in Figure 6a, the Antanimena and Bongolava–Manasamody data define separate arrays to the left of the 4.55 Ga geochron towards low-206Pb/204Pb compositions. In the 208Pb/204Pb v. 206Pb/204Pb diagram (Fig. 6b), the Antanimena data form an array displaced towards higher 208Pb/204Pb than the Northern Hemisphere Reference Line (NHRL; Hart, Reference Hart1984), whereas the Bongolava–Manasamody data display a slightly negative slope towards higher 208Pb/204Pb. Pb isotope differences between the Antanimena and Bongolava–Manasamody rocks reflect the geochemical characteristics of the magma sources and contaminants.
Sr, Nd and Pb isotopic data for volcanic rocks from Mahajanga basin

Sr and Nd isotopic ratios are from Melluso et al. (Reference Melluso, Morra, Brotzu, Razafiniparany, Ratrimo and Razafimahatratra1997, Reference Melluso, Morra, Brotzu, D'Antonio, Bennio, Menzies, Ebinger and Baker2002, Reference Melluso, Morra, Brotzu, Franciosi, Petteruti Lieberknecht and Bennio2003). Measured isotope ratios are age-corrected (subscript i) to 90 Ma.
Pb isotope ratios are reported relative to the NBS 981 Pb values of Todt et al. (Reference Todt, Cliff, Hanser, Hofmann, Basu and Hart1996). Reproducibility for NBS was ± 0.011 for 206Pb/204Pb and 207Pb/204Pb, and ± 0.031 for 208Pb/204Pb. Within-run 2σ errors on the tabulated data were less than or equal to ± 0.008 for 206Pb/204Pb, ± 0.011 for 207Pb/204Pb and ± 0.032 for 208Pb/204Pb. Total procedural blanks were negligible at < 19 pg for Pb. The relative uncertainty for Pb concentrations measured by isotope dilution is 0.5%. Measurements were made at the University of Hawaii.
picr bas – picritic basalt; tho bas – tholeiitic basalt; bas and – basaltic andesite.
(a–c) Pb and Os isotopic compositions of Mahajanga rocks. In Pb–Pb isotope space (a–b), the Northern Hemisphere Reference Line (NHRL) and the Geochron at 4.55 Ga are also shown. The data for other basaltic rocks of the Madagascar igneous province are from Melluso et al. (Reference Melluso, Morra, Brotzu and Mahoney2001, Reference Melluso, Morra, Brotzu, D'Antonio, Bennio, Menzies, Ebinger and Baker2002, Reference Melluso, Morra, Brotzu, Franciosi, Petteruti Lieberknecht and Bennio2003, Reference Melluso, Morra, Brotzu, Tommasini, Renna, Duncan, Franciosi and d'Amelio2005 and unpub. data), Cucciniello et al. (Reference Cucciniello, Langone, Melluso, Morra, Mahoney, Meisel and Tiepolo2010), Storey, Mahoney & Saunders (Reference Storey, Mahoney, Saunders, Mahoney and Coffin1997), Mahoney, Nicollet & Dupuy (Reference Mahoney, Nicollet and Dupuy1991) and Mahoney et al. (Reference Mahoney, Saunders, Storey and Randriamanantenasoa2008). Fields for modern Marion hotspot and Southwest Indian Ridge (SWIR) MORB data are from are from Mahoney et al. (Reference Mahoney, le Roex, Peng, Fisher and Natland1992), Janney, le Roex & Carlson (Reference Janney, le Roex and Carlson2005) and Meyzen et al. (Reference Meyzen, Ludden, Humler, Luais, Toplis, Mevel and Storey2005). (c) Fields for Mailaka transitional and tholeiitic basalts are from Cucciniello et al. (Reference Cucciniello, Langone, Melluso, Morra, Mahoney, Meisel and Tiepolo2010). Central and Southwest Indian Ridge data are from Escrig et al. (Reference Escrig, Capmas, Dupré and Allègre2004).

The basaltic rocks of the Madagascar province cover a wide range in Pb isotope compositions (Fig. 6a, b). However, only a few samples (from the eastern coast; Trend II) show low Pb isotope values similar to Mahajanga rocks (Fig. 6a, b). The low 206Pb/204Pb and 207Pb/204Pb compositions suggest that Mahajanga magmas interacted with old, U-depleted continental crust. In contrast, the fields defined by tholeiitic rocks from the southern part of the Madagascar province are consistent with assimilation of crustal material with high 206Pb/204Pb, 207Pb/204Pb and 208Pb/204Pb ratios.
Re–Os isotopic data for the four magma groups from the Mahajanga area are reported in Table 4. With the exception of the picritic basalt M422 (Group A), with an Os content of 0.8 ng g−1, all of the basaltic rocks of the four magma groups have very low Os contents, from 0.004 to 0.032 ng g−1 (Table 4). The Re contents and hence Re/Os ratios of the basaltic rocks are highly variable. Two samples (Cava and TK405) have higher Re contents (Re = 0.108–0.144 ng g−1) than the other basaltic rocks with similar MgO (Re = 0.038–0.048 ng g−1). The lowest Re content was found in the picritic basalt (Re = 0.009 ng g−1). The 187Re/188Os ratios vary widely within the basaltic rocks, ranging from 0.0573 to 445. Initial Os isotopic ratios of the four magma groups span a large range, with (187Os/188Os)i varying from 0.1408 to 9.4524 (γOs = +11 to +7378; γOs values are calculated at 90 Ma, assuming a chondritic mantle 187Os/188Os ratio of 0.127, Walker & Morgan, Reference Walker and Morgan1989; Table 4). In the ɛNdi v. (187Os/188Os)i diagram (Fig. 6c), data for the Mahajanga rocks show a trend that indicates the involvement of a contaminant with high Os isotopic ratios, such as the continental crust (e.g. γOs = + 330 to +22000; McBride et al. Reference McBride, Lambert, Nicholls and Price2001 and references therein). The Mahajanga rocks (Groups B and D) show distinctly more radiogenic (187Os/188Os)i than the Mailaka rocks (Fig. 6c).
Re–Os isotopic data for volcanic rocks from Mahajanga basin

Abundances for Re and Os are in ng g−1.
γOs = [(187Os/188Ossample/187Os/188Osmantle) − 1] × 100 using an estimated average chondritic mantle 187Os/188Os = 0.127 (Walker & Morgan, Reference Walker and Morgan1989).
8. Crustal contamination
No closed system model can explain the wide trace element and isotopic variations observed in the Mahajanga rocks. The Antanimena rocks (Groups A and C) have high Ba/Nb (33–156), Sr/Nd (13–31) and low Ce/Pb (5–8) and Nb/La (0.3–0.8), similar to crustal materials (Fig. 7a). In contrast, the Bongolava–Manasamody basalts (Groups B and D) have lower Ba/Nb (9–14), Sr/Nd (14–18) and higher Ce/Pb (15–21) and Nb/La (0.8–1.0; Fig. 7a). In the ɛNdi v. SiO2 diagram (Fig. 7b), the Antanimena rocks display a general negative correlation, possibly indicating the influence of crustal materials. Although Group D basalts exhibit a slightly negative correlation in the ɛNdi v. SiO2 diagram (Fig. 7b), the small range of their isotopic values could preclude a substantial involvement of crustal rocks in their genesis. The small range could also indicate that the magmas were generated in large crustally contaminated magma chambers that were homogenized. The high ɛNdi values indicate that contamination was not too significant.
(a) Nb/La v. Sr/Nd diagram, showing the composition of Mahajanga lavas; UC – average upper continental crust (Rudnick & Gao, Reference Rudnick, Gao and Rudnick2003); LC – average lower continental crust (Rudnick & Gao, Reference Rudnick, Gao and Rudnick2003); Archaean crust (Condie, Reference Condie2005); Average N-MORB (Niu & O'Hara, Reference Niu and O'Hara2003); CLM – average continental lithospheric mantle from peridotite xenoliths (Simon et al. Reference Simon, Carlson, Graham Pearson and Davies2007); Marion hotspot field (Janney, le Roex & Carlson, Reference Janney, le Roex and Carlson2005). (b) ɛNdi v. SiO2 diagram for the Mahajanga lava compositions.

Pb isotopic values of Group A, C and D basalts overlap the fields defined by worldwide xenoliths from lower cratonic crust and Archaean crust (Fig. 8), suggesting that the crustal contaminant was old U-depleted continental crust. We suggest that the Archaean rocks of northern Madagascar are plausible contaminants for the Mahajanga magmas. The basement rocks exposed in northern Madagascar are dominated by orthogneisses and paragneisses that were metamorphosed and partially melted under granulite- and upper amphibolite-facies conditions in Neoarchaean time (De Waele et al. Reference De Waele, Thomas, Macey, Horstwood, Tucker, Pitfield, Schofield, Goodenough, Bauer, Key, Potter, Armstrong, Miller, Randriamananjara, Ralison, Rafahatelo, Rabarimanana and Bejoma2011 and reference therein). High-grade metamorphism and crustal melting could have produced the low-μ (μ = 238U/204Pb) signature. In addition, the different trends in Figure 6a and b indicate the involvement of crustal assimilants with different time-integrated U/Pb and Th/Pb ratios. Cucciniello et al. (Reference Cucciniello, Langone, Melluso, Morra, Mahoney, Meisel and Tiepolo2010) already reported evidence of contamination by variable upper-to-lower crustal contaminants in the evolved rocks of the Mailaka sequence, which suggests that these processes are not uncommon in the Madagascar Cretaceous igneous province.
(a, b) 208Pb/204Pb and 207Pb/204Pb v. 206Pb/204Pb for Mahajanga rocks. Fields for lower crustal xenoliths (beneath cratonic and Phanerozoic regions), peridotite xenoliths and Archaean crust are from Downes et al. (Reference Downes, Markwick, Kempton and Thirlwall2001), Meyzen et al. (Reference Meyzen, Ludden, Humler, Luais, Toplis, Mevel and Storey2005), Kreissig et al. (Reference Kreissig, Naegler, Kramers, van Reenen and Smit2000) and Sengupta et al. (Reference Sengupta, Paul, de Laeter, McNaughton, Bandopadhyay and de Smeth1991). UC – total upper crust (Kramers & Tolstikhin, Reference Kramers and Tolstikhin1997); LC – total lower crust (Kramers & Tolstikhin, Reference Kramers and Tolstikhin1997).

The Group B basalts most likely experienced minimal crustal contamination (on the basis of trace element and Sr–Nd–Pb isotopic ratios), and we believe that their isotopic compositions may reflect the isotopic features of their mantle source. In Figure 8, the isotopic data for the Group B basalts fall in the field defined by worldwide peridotite xenoliths.
To better evaluate the crustal components in the Mahajanga magmas, we used the fractional crystallization (AFC) model of DePaolo (Reference DePaolo1981). The AFC modelling using the Os isotopic data does not provide any further information about the nature of the crustal contaminant given the very low Os contents of the samples (Table 4). If the contaminant has relatively high Os contents (e.g. 0.05 ng g−1) and high 187Os/188Os (e.g. > 1), very low degrees of crustal contamination can produce a radiogenic 187Os/188Os signature in the magmas.
The compositions of the contaminants chosen for the modelling are those of Archaean crustal rocks of South Africa (Kreissig et al. Reference Kreissig, Naegler, Kramers, van Reenen and Smit2000) and Tanzania (Möller, Mezger & Schenk, Reference Möller, Mezger and Schenk1998), because no whole-rock Pb isotopic data have been published for Madagascan continental crust to date. In the AFC modelling, the mantle-derived parental magmas chosen for the Antanimena and Bongolava–Manasamody rocks are a Southwest Indian Ridge (SWIR) MORB (Mahoney et al. Reference Mahoney, Natland, White, Poreda, Bloomer, Fisher and Baxter1989) and Bongolava basalt (M32; this study), respectively. The results show that the sample M41 (Group D) and the picritic basalt (M422) of Antanimena are the least contaminated. A maximum assimilated mass of ~ 14% is required to produce the evolved rocks of Antanimena (Fig. 9). In addition, the AFC calculations indicate the involvement of a crustal contaminant with variable 208Pb/204Pb ratios in the genesis of the Group D basalt.
(a–c) 206Pb/204Pb v. Pb (μg g−1), and 206Pb/204Pb and 208Pb/204Pb v. (143Nd/144Nd)i for Mahajanga rocks. Four AFC models are illustrated. The AFC calculations were run for the Antanimena (black curves) and Bongolava–Manasamody (Group D) rocks (grey curves), using two different mantle-derived basalt and crustal end-members. Numbers on the AFC curves indicate the residual liquid fraction. Assumed bulk partition coefficients: DNd = 0.2, DPb = 0.2. r = massassimilated/massaccumulated. Crustal contaminant values used in the AFC modelling are from Möller, Mezger & Schenk (Reference Möller, Mezger and Schenk1998; sample A159–1) and Kreissig et al. (Reference Kreissig, Naegler, Kramers, van Reenen and Smit2000; sample 96/217). Continental lithospheric contaminant values are from Walker et al. (Reference Walker, Carlson, Shirey and Boyd1989; sample 1008-Cpx). Starting composition for the Antanimena rocks is a SWIR MORB (AII 93–5/1; Mahoney et al. Reference Mahoney, Natland, White, Poreda, Bloomer, Fisher and Baxter1989). AFC modelling with Marion hotspot values for the starting material (dark grey curves) is also reported.

The very low 206Pb/204Pb and 207Pb/204Pb signatures observed in the Mahajanga rocks (Fig. 8) rule out the involvement of lithospheric mantle as a contaminant in their genesis. The results of AFC modelling support this interpretation.
9. Mantle sources
Most of the Mahajanga rocks have experienced extensive fractional crystallization and crustal contamination (Melluso et al. Reference Melluso, Morra, Brotzu, Razafiniparany, Ratrimo and Razafimahatratra1997, Reference Melluso, Morra, Brotzu, Franciosi, Petteruti Lieberknecht and Bennio2003), but the regional trace element heterogeneity of the Mahajanga flood basalt sequence cannot be explained only by these two processes. In order to evaluate the mantle source characteristics, we prefer to use element ratios involving HFSEs and HREEs, such as Zr/Y, Sm/Yb and Zr/Nb, which are not strongly modified by fractional crystallization or crustal contamination processes.
The Mg-rich Group A basalts (M422, M420) have low Zr/Y (3.3–3.8), Smn/Ybn (1.5–1.7) and high Zr/Nb (> 20) ratios typical of normal MORB, whereas Group B and D basalts have high Zr/Y (4.3–8.7), Smn/Ybn (2.2–4.5) and low Zr/Nb (< 18) typical of magmas derived from incompatible- element-enriched mantle (Fig. 10). In addition, the high Smn/Ybn and Zr/Y ratios indicate the presence of residual garnet in the source of the Group D basalts, whereas the low Smn/Ybn and Zr/Y ratios observed in the other groups exclude melting in the presence of residual garnet (cf. Melluso et al. Reference Melluso, Morra, Brotzu, D'Antonio, Bennio, Menzies, Ebinger and Baker2002, Reference Melluso, Morra, Brotzu, Franciosi, Petteruti Lieberknecht and Bennio2003, Reference Melluso, Morra, Brotzu, Tommasini, Renna, Duncan, Franciosi and d'Amelio2005).
Smn/Ybn v. Zr/Nb for Mahajanga rocks. The data for other basaltic rocks of the Madagascar igneous province are from Melluso et al. (Reference Melluso, Morra, Brotzu and Mahoney2001, Reference Melluso, Morra, Brotzu, D'Antonio, Bennio, Menzies, Ebinger and Baker2002, Reference Melluso, Morra, Brotzu, Franciosi, Petteruti Lieberknecht and Bennio2003, Reference Melluso, Morra, Brotzu, Tommasini, Renna, Duncan, Franciosi and d'Amelio2005), Cucciniello et al. (Reference Cucciniello, Conrad, Grifa, Melluso, Mercurio, Morra, Tucker, Vincent and Srivastava2011), Storey, Mahoney & Saunders (Reference Storey, Mahoney, Saunders, Mahoney and Coffin1997), Dostal et al. (1991) and Mahoney et al. (Reference Mahoney, Saunders, Storey and Randriamanantenasoa2008). Fields for modern Marion hotspot and (SWIR) N-MORB are from Mahoney et al. (Reference Mahoney, le Roex, Peng, Fisher and Natland1992) and Janney, le Roex & Carlson (Reference Janney, le Roex and Carlson2005).

The role of the Marion hotspot as a heat or melt source in the genesis of the Madagascar basalts is controversial (Storey, Mahoney & Saunders, Reference Storey, Mahoney, Saunders, Mahoney and Coffin1997; Melluso et al. Reference Melluso, Morra, Brotzu, Razafiniparany, Ratrimo and Razafimahatratra1997, Reference Melluso, Morra, Brotzu, D'Antonio, Bennio, Menzies, Ebinger and Baker2002, Reference Melluso, Morra, Brotzu, Franciosi, Petteruti Lieberknecht and Bennio2003; Mahoney et al. Reference Mahoney, Saunders, Storey and Randriamanantenasoa2008). The Mailaka and Antampombato transitional basalts have Sr and Nd isotope ratios similar to those of present-day Marion hotspot basalts, but their Pb isotopic and trace element compositions are different (Fig. 6). The geochemical imprint of the Marion hotspot seems evident in some Fe-Ti basalts (Trend I; Storey, Mahoney & Saunders, Reference Storey, Mahoney, Saunders, Mahoney and Coffin1997) of Mananjary, whereas in the Androy complex (close to the postulated position of the Marion hotspot at 88 Ma) a Marion-like isotopic signature is absent (Mahoney et al. Reference Mahoney, Saunders, Storey and Randriamanantenasoa2008). The Antanimena basalts do not resemble hotspot-derived magmas. Although, the picritic basalt (M422) shows Sr–Nd–Os isotopic characteristics similar to ocean island basalt (OIB; e.g. McBride et al. Reference McBride, Lambert, Nicholls and Price2001 and reference therein), its Pb isotope values are lower and equivalent to those of the continental crust (Fig. 8). In contrast, the Group D basalts have incompatible element patterns resembling those of present-day Marion hotspot basalts (Fig. 3d). However, because of crustal contamination, the isotopic compositions of Group D basalts cannot provide much information about the composition of the mantle source. Only the isotopic compositions of the least contaminated Group B basalts could approach that of the mantle source. The Group B basalts have compositions that can be readily attributed to lithospheric materials (Fig. 6). Figure 9 shows that AFC modelling (assuming present-day Marion hotspot lavas are representative of the parental magma of the Group B and D basalts) cannot reproduce the isotopic variations of either magma type. Numerical modelling of the Mahajanga basalts (cf. Melluso et al. Reference Melluso, Morra, Brotzu, D'Antonio, Bennio, Menzies, Ebinger and Baker2002, Reference Melluso, Morra, Brotzu, Franciosi, Petteruti Lieberknecht and Bennio2003, Reference Melluso, Morra, Brotzu, Tommasini, Renna, Duncan, Franciosi and d'Amelio2005) indicates mixing relationships between partial melts of MORB-like mantle and partial melts of incompatible-element-enriched lithospheric mantle. We believe that the amount, timing and distribution of magmatism in the Mahajanga basin were controlled by several factors, such as a hot thermal anomaly, lithosphere thickness and the composition and orientation of old tectonic lineaments. Geophysical studies of the crustal and lithospheric structure of Madagascar (Rambolamanana, Suhadolc & Panza, Reference Rambolamanana, Suhadolc and Panza1995; Rakotondraompiana, Albouy & Piqué, Reference Rakotondraompiana, Albouy and Piqué1999; Piqué et al. Reference Piqué, Laville, Chotin, Chorowicz, Rakotondraompiana and Thouin1999) suggest a relatively thick continental crust (30–42 km) below the Precambrian rocks in the centre of the island. A zone of substantially thinned crust is located below Antananarivo (≈ 21 km) and along the eastern coast (25–27 km). E–W gravimetric profiles across Madagascar indicate that the lithosphere is thin beneath the Late Cenozoic volcanic fields of Ankaratra and Itasy (central Madagascar; Fig. 1) (Rakotondraompiana, Albouy & Piqué, Reference Rakotondraompiana, Albouy and Piqué1999). A thick lithosphere (≈ 130 km) is likely to be present beneath the eastern part of the island, whereas below the Karoo-related Morondava and Mahajanga basins, the lithosphere is likely to be thinner.
A simplified magmatic model proposed for the Mahajanga flood basalt sequence is illustrated in Figure 11. The essential components are: (1) the Archaean Antananarivo craton; (2) an incompatible-element-enriched lithospheric mantle source; (3) a depleted asthenospheric upper mantle source; and (4) a thermal anomaly. In this model a thermal anomaly only provides the heat to the adjacent mantle. In the western Mahajanga basin, decompression melting of a MORB-like mantle source generates the Antanimena magmas. These melts interact extensively during their ascent with old crustal materials having very low Pb and Nd isotopes. In the eastern Mahajanga basin, depleted mantle-derived melts interact with melts derived from incompatible-element-enriched continental lithospheric mantle. Again, crustal-level contamination modifies the composition of the Group D magmas. An alternative hypothesis to explain the generation of the Mahajanga magmas without the involvement of the Marion hotspot requires small-scale convection in an internally heated upper mantle.
Model for the origin of the Mahajanga basalts. The figure is not to scale. The Antanimena rocks were generated by partial melting of a depleted upper asthenospheric mantle (heated by the Marion hotspot) and then contaminated with Archaean crustal material with low time-integrated U/Pb and Th/Pb. The Bongolava–Manasamody rocks were generated by mixing of melts from depleted upper asthenospheric mantle and enriched lithospheric mantle. These magmas were contaminated with Archaean crust with low U/Pb and variable Th/Pb ratios in crustal level magma chambers.

10. Conclusions
The new 40Ar–39Ar ages for plagioclase separates from basaltic rocks from the Antanimena plateau (western Mahajanga basin) constrain the beginning of the magmatism in this area at about 92 Ma and when combined with existing data, argue for a short emplacement duration. The lavas of the Mahajanga sector show distinct isotopic signatures. The Antanimena rocks are characterized by low Pb isotope ratios (206Pb/204Pb = 15.283–16.325; 207Pb/204Pb = 15.058–15.269; 208Pb/204Pb = 35.483–36.547), whereas the Bongolava–Manasamody rocks are characterized by higher 206Pb/204Pb (16.518–17.355) and 208Pb/204Pb (37.511–38.009) but similar 207Pb/204Pb (15.086–15.404). The isotopic variations within the Mahajanga basalts and basaltic andesites are consistent with AFC processes involving different crustal end-members. The Pb isotopic compositions of the Antanimena rocks indicate that they have been contaminated by old continental crust with low time-integrated U/Pb and Th/Pb. In contrast, the higher 206Pb/204Pb and 208Pb/204Pb ratios observed in the Bongolava–Manasamody rocks (Group D) indicate a contaminant with higher time-integrated U/Pb and Th/Pb. The Antanimena and Bongolava–Manasamody basalts cannot be related by variable degrees of partial melting of a common mantle source or by fractional crystallization of a common parental magma. The marked geochemical and isotopic differences between the Antanimena and Bongolava–Manasamody basalts indicate distinct mantle sources. The geochemical features of the Antanimena rocks show general affinities to normal MORB and indicate an incompatible-element-depleted mantle source. On the other hand, an incompatible-element-enriched mantle source is invoked to explain the geochemical features observed in the Bongolava–Manasamody rocks. The contribution of the Marion hotspot (as a magma source) to the northern part of the Madagascar Cretaceous province is not identifiable.
Acknowledgements
We are grateful to Piero Brotzu, who provided invaluable experience and scientific input, and to Andrea Marzoli for useful suggestions on an early draft of the manuscript. Comments of two anonymous journal reviewers and the further advice of Philip Leat were very useful for the preparation of a revised version. This study was supported by MIUR (PRIN 2008) to Leone Melluso.
Appendix 1. Analytical methods
Eleven samples from the Mahajanga basin were selected for isotope analyses. These samples represent the different magma types identified by Melluso et al. (Reference Melluso, Morra, Brotzu, Razafiniparany, Ratrimo and Razafimahatratra1997, Reference Melluso, Morra, Brotzu, Franciosi, Petteruti Lieberknecht and Bennio2003). Lead isotopic data were obtained at the School of Ocean and Earth Sciences and Technology, University of Hawaii, following Mahoney, Nicollet & Dupuy (Reference Mahoney, Nicollet and Dupuy1991) and Mahoney et al. (Reference Mahoney, le Roex, Peng, Fisher and Natland1992). Crushed chips were acid-cleaned in 0.15 mol l−1 HF-HNO3 for 5 minutes (in an ultrasonic bath) and dissolved successively in concentrated HF-HNO3, HNO3, and HCl. A split of each solution was spiked with 206Pb. Lead was subsequently separated and purified on 100-μl anion exchange columns with mixed HBr-HNO3 concentrated solutions. The lead-bearing fraction was loaded onto single Re filaments with concentrated H3PO4 and silica-gel, and isotopic ratios were measured on a VG Sector multicollector thermal ionization mass spectrometer. Lead isotope ratios are corrected for fractionation using the NBS 981 standard values of Todt et al. (Reference Todt, Cliff, Hanser, Hofmann, Basu and Hart1996). The blank contribution to the measurement result was negligible (< 19 pg).
Rhenium and osmium analyses were performed on whole rocks, following Reisberg, Lorand & Bedini (2004). About 2 g of sample powder were spiked with 185Re and 190Os tracer solutions and digested in a Carius tube (Shirey & Walker, Reference Shirey and Walker1995) at 230°C using a 3:1 mixture of HNO3 and HCl. Carius tubes (CT) are thick-walled, sealed borosilicate glass tubes, meant to withstand high pressures, that permit samples to be digested in oxidizing solutions without loss of the volatile species, OsO4. After purification of the separated Os by microdistillation (Roy-Barman, Reference Roy-Barman1993), Os isotopic ratios were measured by negative thermal ionization (Creaser, Papanastassiou & Wasserburg, Reference Creaser, Papanastassiou and Wasserburg1991; Völkening, Walczyk & Heumann, Reference Völkening, Walczyk and Heumann1991) in ion counting mode using a Finnigan MAT262 mass spectrometer at CRPG (Centre National de la Recherche Scientifique–Centre de Recherches Pétrographiques et Géochimiques). Os concentrations were determined by isotope dilution (ID). The average total procedural blank for Os was 1.3 ± 0.7 pg. The 187Os/188Os ratio of in-house reference materials had a precision under intermediate precision conditions of 0.3% (0.17386 ± 0.00054; 2σ; n = 45) during one year. The measurement uncertainties of single concentration determinations of Os were about 1% or less. However, repeated analysis of samples leads to higher uncertainties due to the heterogeneous distribution of Re and Os. The differences in isotopic composition and Re and Os content exceed the uncertainties by far, thus the contribution from sample inhomogeneity was not further investigated by repeated analysis.
The solution aliquot saved for Re separation was dried down and redissolved in 0.4 N HNO3. Re was extracted from this solution using AG1×8 anion exchange resin columns. Spiked Re isotopic ratios were determined by peak jumping using a Daly detector on a Micromass Isoprobe MC-ICP-MS, and Re concentrations were calculated by ID. Mass fractionation was controlled by standard measurements taken after every four samples. The isotope amount ratio 187Re/185Re normally varied by ~ 0.3% throughout the course of a day. Total procedural blanks of Re were about 4 pg.
We selected two samples from the base of the Antanimena plateau that showed few signs of alteration (M420 and M422) for 40Ar–39Ar dating and separated unaltered, optically transparent plagioclase from them. Plagioclase was separated using a Frantz magnetic separator, and carefully hand-picked under a binocular microscope. The selected grains were then leached in dilute HF for one minute and then thoroughly rinsed with distilled water in an ultrasonic cleaner. Samples were loaded into two large wells of an aluminium disc. The wells were 1.9 cm in diameter and 0.3 cm in depth. These wells were bracketed by small wells that included GA1550 biotite used as a neutron fluence monitor, for which an age of 98.79 ± 0.55 Ma was adopted at the time of the measurement and a good in between grain reproducibility has been demonstrated (Renne et al. Reference Renne, Swisher, Deino, Karner, Owens and DePaolo1998). The discs were Cd-shielded (to minimize undesirable nuclear interference reactions) and irradiated for 25 hours in the Hamilton McMaster University (Canada) nuclear reactor. The mean J-values computed from standard grains within the small pits range from 0.007054 (± 0.21%) to 0.006880 (± 0.34%) determined as the average and standard deviation of J-values of the small wells for each irradiation disc. Mass discrimination was monitored using an automated air pipette and provided mean values ranging from 1.001286 (± 0.36%) to 1.001553 (± 0.30%) per dalton (atomic mass unit). The correction factors for interfering isotopes were (39Ar/37Ar)Ca = 7.30 × 10⁻⁴ (± 11%), (36Ar/37Ar)Ca = 2.82 × 10⁻⁴ (± 1%) and (40Ar/39Ar)K = 6.76 × 10⁻⁴ (± 32%).
The 40Ar–39Ar analyses were performed at the Western Australian Argon Isotope Facility at Curtin University. The samples were loaded in 0-blank Cu-foil packages and were step heated using a Pond Engineering® double vacuum resistance furnace. The gas was purified in a stainless steel extraction line using a GP50 and two AP10 SAES getters and a liquid nitrogen condensation trap. Argon isotopes were measured in static mode using a MAP 215–50 mass spectrometer (resolution of ~ 500; sensitivity of 2 × 10⁻¹⁴ mol V−1) with a Balzers SEV 217 electron multiplier, mostly using nine to ten cycles of peak-hopping. Data acquisition was performed with the Argus program written by M. O. McWilliams; the program ran in a LabView environment. The raw data were processed using the ArArCALC software (Koppers, Reference Koppers2002). Argon isotopic data corrected for blank, mass discrimination and radioactive decay are given in Table 1. Individual errors in Table 1 are given at the 1σ level. Initially, the ages were obtained and calculated using the decay constants recommended by Steiger & Jäger (Reference Steiger and Jäger1977) but plateau and isochron ages were subsequently individually recalculated using the new decay constants determined by Renne et al. (Reference Renne, Mundil, Balco, Min and Ludwig2010) and an age of 99.769 ± 0.108 Ma (± 0.11%) Ma for GA1550. Recalculated values are shown in Table 2. Uncertainties on the plateau and isochron ages include all sources of errors, including error on the decay constant and uncertainty on the age of the monitor. Blanks were monitored every three to four steps and typical 40Ar blanks ranged from 1 × 10⁻¹⁶ to 2 × 10⁻¹⁶ mol. Our criteria for the determination of a plateau are as follows: plateaus must include at least 70% of the 39Ar, and a plateau should be distributed over a minimum of three consecutive steps agreeing at the 95% confidence level and satisfying a probability of fit (P) of at least 0.05. Plateau ages (Table 2 and Fig. 5) are given at the 2σ level and are calculated using the mean of all the plateau steps, each weighted by the inverse variance of the individual analytical error. Integrated ages (2σ) are calculated using the total gas released for each Ar isotope. Inverse isochrons include the maximum number of steps with a probability of fit ≥ 0.05.