Introduction
The effect of high pressure on inorganic and mineral structures has traditionally been quantified using the combination of mutual rotation of coordination polyhedra and their deformation. While the polyhedral rotation schemes are largely specific to the structure, the pressure-induced deformation of individual coordination polyhedra follows more universal principles. The first attempt to formulate these principles was made by Hazen and Prewitt (Reference Hazen and Prewitt1977) who found empirically that cation-oxygen polyhedra can be described by a constant K·r 3/z c ratio, where z c is the formal charge of the cation, r is the mean bond length and K is the bulk modulus of the polyhedron. Later, Hazen and Finger (Reference Hazen and Finger1979) extended this observation to include cations in halides, chalcogenides, pnictides and carbides, by incorporating ‘ionicity’ (S 2, 0.5 for coordination by oxygen) and anion charge (z a) into the formula. The resulting trend
 \begin{equation}\frac{{{\textit{K}} \cdot {r^3}}}{{{S^2}{z_c}{z_a}}} = 750\left( {20} \right){\text{ GPa}} \cdot {{\text{{\unicode{x00C5}}}}^3}\end{equation}
has since been used widely as a reference in high-pressure crystal chemistry. However, it should be noted that the empirical data used by Hazen and Finger (Reference Hazen and Finger1979) to derive equation 1 was limited to the compression behaviour of regular polyhedra with a fixed coordination number of four, six and eight, which were described for compounds with relatively simple and symmetric crystal structures (e.g. NaCl, cubic ZnS, fluorite, garnet).
A major issue that has not been adequately addressed up to now is the extension of the universal compressibility rule to the cases where: (1) polyhedra undergo a continuous change in coordination number under pressure; and (2) polyhedra have a large coordination number and an ill-defined limit of the first coordination shell.
These cases are particularly relevant for ‘large cations’ (K+, Ba2+ etc.), and the example of K+ is particularly relevant to Earth science and has been relatively well studied under high-pressure. This example will be discussed in more detail below.
Data sources
The sources of crystallographic data used for the analysis of K+ polyhedral compressibility are listed in Table 1. For most of the crystal structures considered, the K+ content at the corresponding crystallographic sites exceeds 90 mol.%. Two exceptions are the crystal structures of fluorapophyllite-(K) and nepheline, which have site stoichiometries of K0.70(NH4)0.20Na0.07□0.10 and K0.54Na0.24Ca0.03□0.22, respectively. None of the crystal structures shows positional disorder in either the K+ sites or the ligands that coordinate them. The data in CIF format were downloaded either as electronic supplementary material related to original publications or from the American Mineralogist Crystal Structure Database (Downs and Hall-Wallace, Reference Downs and Hall-Wallace2003) or were kindly provided by the authors. Where necessary, the _cell_measurement_pressure key with corresponding pressure values was added to the original CIFs for further machine processing. In cases where no pressure uncertainty was reported, a value of 0.05 GPa was used. The data were processed using the graphical user interface of the crystchemlib Python library (Rashchenko, Reference Rashchenko2025), in accordance with the following procedure:
Sources of crystallographic data used for analysis of K+ polyhedra compressibility

(1) Long description
Rows list mineral and site, with columns for occupancy, maximum pressure in gigapascals, ECoN0, the pressure derivative of ECoN in inverse gigapascals, r03 in cubic angstroms, bulk modulus K0 in gigapascals, and a key letter. Alpha K2Ca3(CO3)4 has two sites: K1 with occupancy K1.00, Pmax 6.3, ECoN0 8.548(7), d(ECoN) over dP minus 0.006(3), r03 22.72(3), and K0 32.3(7); and K3 with occupancy K1.00, Pmax 6.3, ECoN0 8.383(16), d(ECoN) over dP 0.048(5), r03 23.64(5), and K0 41.6(14). Kokchetavite lists K1 and K2, both with occupancy K0.96 vacancy 0.04 and Pmax 5.3; K1 has ECoN0 12.0(5), d(ECoN) over dP minus 0.93(16), r03 30.9(5), and K0 6.3(6), while K2 has ECoN0 10.83(16), d(ECoN) over dP minus 0.53(5), r03 29.2(3), and K0 10.6(9). Hydroxylapophyllite K has occupancy K0.96 vacancy 0.04, Pmax 2.7, ECoN0 8, d(ECoN) over dP 0, r03 25.80(4), and K0 18.1(6), and fluorapophyllite K has mixed occupancy K0.70 with NH4 0.20, Na 0.07, vacancy 0.10, Pmax 4.3, ECoN0 8, d(ECoN) over dP 0, r03 26.44(5), and K0 21.9(8). Leucite site KK has occupancy K0.95 Na0.03 vacancy 0.02, Pmax 1.8, ECoN0 8.02(6), d(ECoN) over dP minus 0.47(6), r03 29.5(3), and K0 11.9(17). Nepheline site K has occupancy K0.54 Na0.24 Ca0.03 vacancy 0.22, Pmax 4.1, ECoN0 11.01(6), d(ECoN) over dP minus 0.27(3), r03 28.69(12), and K0 17.4(9). Phlogopite 1M site K has occupancy K0.91 Na0.02 Ba0.03 vacancy 0.04, Pmax 5.0, ECoN0 10.30(12), d(ECoN) over dP minus 0.46(4), r03 29.3(7), and K0 12(3), and microcline site KM has occupancy K0.97 Na0.01 vacancy 0.02, Pmax 6.2, ECoN0 8.82(3), d(ECoN) over dP minus 0.134(7), r03 25.26(9), and K0 24.6(11).
(1) For each K+ site in each dataset, an effective coordination number (ECoN) vs. pressure (P) plot was generated, considering K–O distances up to 4 Å.
(2) In each case, a pressure range with a constant d(ECoN)/dP slope was selected as the working range for further calculations. The values of d(ECoN)/dP slope and the intersection (ECoN 0) were then fitted by a linear function.
(3) Within the selected pressure range, a plot of weighted mean bond length (r) vs. pressure was generated, considering K–O distances up to 4 Å. The r 3 value, which serves as a proxy for polyhedral volume compressibility, was then fitted with a second-order Birch-Murnaghan equation of state to obtain the r 03 and K 0 (bulk modulus) values. Least-squares fitting was performed using the scipy.odr Python module, implemented in the crystchemlib graphical user interface.
For more information on the definition of ECoN and weighted mean bond length, see below.
Definition of polyhedron compressibility
For regular polyhedra with a fixed coordination number, such as those analysed by Hazen and Finger (Reference Hazen and Finger1979) to derive equation 1, the definition of volume compressibility is straightforward and relates directly to the pressure-induced change in polyhedron volume, which is fitted with a suitable equation of state. However, for more complex cases, as outlined in the Introduction, a more detailed approach is required. This will be illustrated below using the example of kokchetavite, a hexagonal polymorph of KAlSi3O8, which was studied under high pressure by Romanenko et al. (Reference Romanenko, Rashchenko, Korsakov, Sokol and Kokh2024).
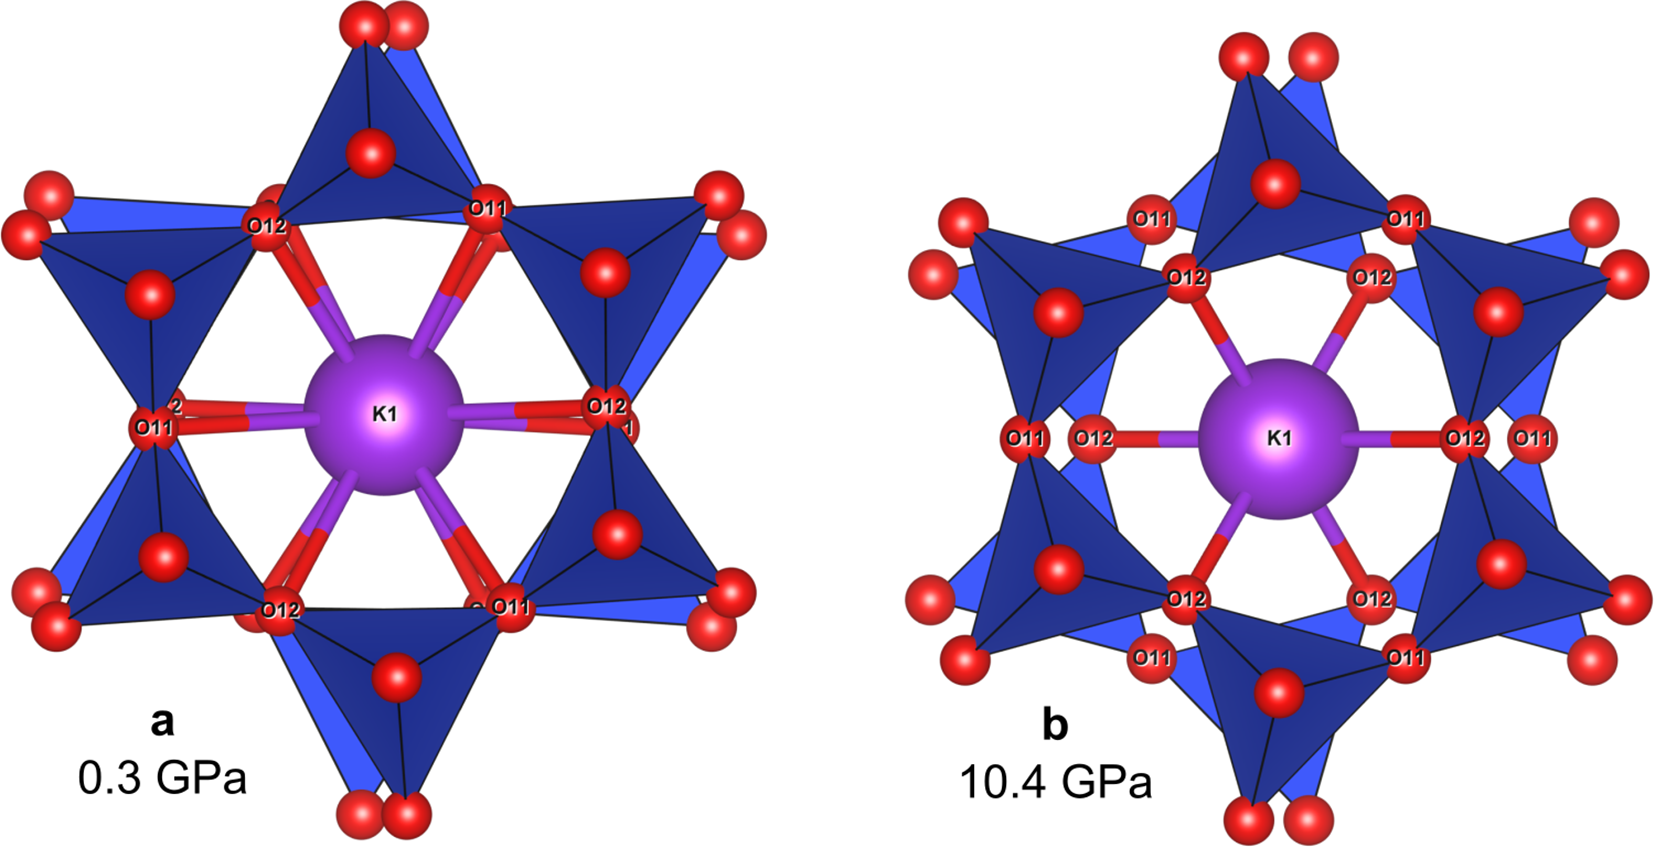
In the pressure range between 0.3 and 10.4 GPa, the kokchetavite structure adopts the  $P\bar 6c2$ space group and contains two potassium sites, K1 and K2, sandwiched between six-membered rings of aluminosilicate tetrahedra. At pressures near 0.3 GPa, the rings surrounding the K1 site have a close to regular hexagonal shape (Fig. 1a), so the K+ cation is coordinated by 12 oxygen atoms of six O11 and six O12 sites, with a minor difference between K1–O11 and K1–O12 bond lengths. However, as pressure increases, the six-membered aluminosilicate rings become progressively distorted in a ditrigonal manner (Fig. 1b). This causes the six K1–O11 bond lengths to increase from ∼3.1 to ∼3.3 Å, while the six K1–O12 bond lengths decrease from ∼3.0 to ∼2.6 Å.
Coordination of the K1 site in the kokchetavite structure by six-membered rings of aluminosilicate tetrahedra at different pressures.

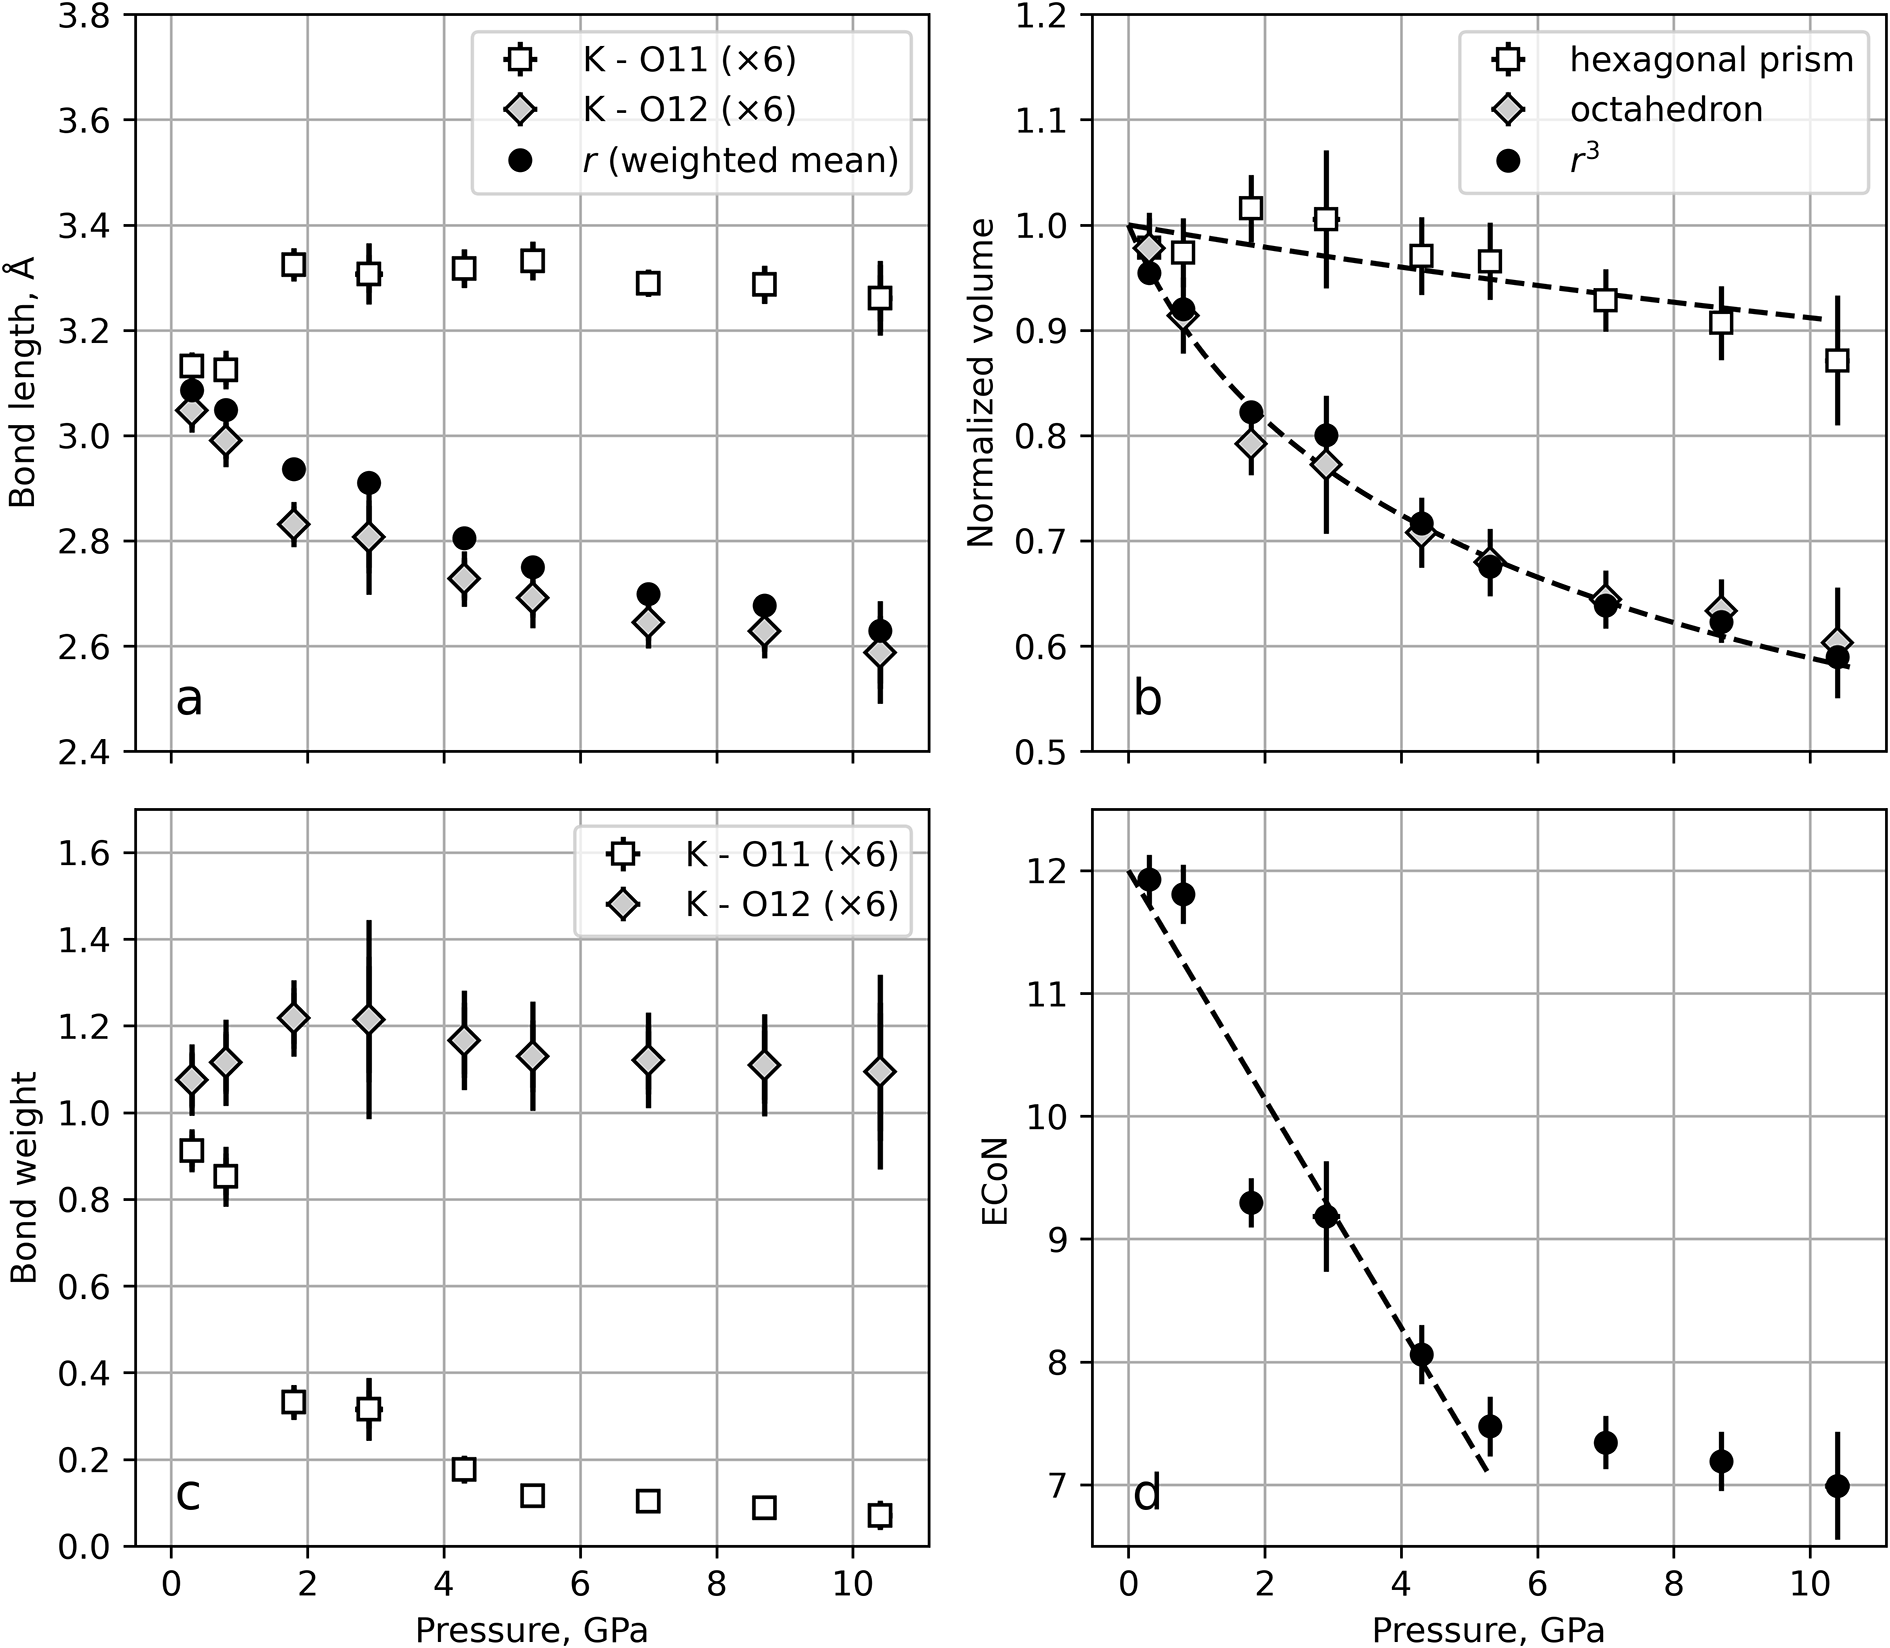
The evolution of the K1–O11 and K1–O12 bond lengths, as shown in Fig. 2a, leads to an ambiguous definition of the coordination polyhedron around the K1 site. At 0.3 GPa, the K1 site has 12 neighbours in the form of a hexagonal prism, as seen in Fig. 1a. However, at 10.4 GPa, the O11 sites, which are located ∼3.3 Å from the K1 site, barely enter the first coordination sphere, which is formed by six short (∼2.6 Å) contacts with the O12 sites. This results in a coordination number of ‘6 + 6’ (distorted hexagonal prism, Fig. 1b) or even an octahedral coordination for K1.
The parameters of the K1 site coordination polyhedron in the kokchetavite structure under compression. The dashed lines represent the least-squares fit using a second-order Birch-Murnaghan equation of state (b) and a linear function between 0.3 and 5.3 GPa (d).

Figure 2 Long description
Scatter plot with the horizontal axis label, Pressure, GPa, ranging from 0 to 10. The vertical axis label, Bond length, A, ranging from 2.4 to 3.8. A legend lists, K minus O11 left parenthesis times 6 right parenthesis, K minus O12 left parenthesis times 6 right parenthesis and r left parenthesis weighted mean right parenthesis. Plotted points with vertical error bars appear at multiple pressures from about 0 to 10 for three marker types. One series forms a band near 3.2 to 3.4 across the pressure range. Two other series decrease from about 3.1 near 0 to about 2.6 to 2.7 near 10. Scatter plot with the horizontal axis label, Pressure, GPa, ranging from 0 to 10. The vertical axis label, Normalized volume, ranging from 0.5 to 1.2. A legend lists, hexagonal prism, octahedron and r superscript 3. One set of points lies near 1.0 at low pressure and decreases slightly to about 0.9 by 10, with a dashed line through it. Another set of points decreases from about 1.0 near 0 to about 0.6 near 10, with a dashed line through it. A third set of points follows a similar decreasing path from about 1.0 near 0 to about 0.6 near 10. Scatter plot with the horizontal axis label, Pressure, GPa, ranging from 0 to 10. The vertical axis label, Bond weight, ranging from 0.0 to 1.6. A legend lists, K minus O11 left parenthesis times 6 right parenthesis and K minus O12 left parenthesis times 6 right parenthesis. One series of points lies near 1.0 to 1.3 across the pressure range, with vertical error bars. A second series starts near about 0.9 to 1.0 at low pressure and decreases to about 0.1 by about 10, with vertical error bars. Scatter plot with the horizontal axis label, Pressure, GPa, ranging from 0 to 10. The vertical axis label, ECoN, ranging from 7 to 12. Points with vertical error bars decrease from about 12 near 0 to about 7 near 10. A dashed line segment descends from about 12 near 0 to about 7.5 near about 4.
Surprisingly, when considering the K1 polyhedron as a hexagonal prism (nearly regular at 0.3 GPa and progressively distorted with increasing pressure), it is found that its volume exhibits an unphysical volume vs. pressure curve (Fig. 2b) and an unrealistically large bulk modulus of ∼90 GPa. The latter reflects a dominant contribution from the six outer O11 ligands in the polyhedron volume, with K1–O11 bonds that are nearly independent of pressure (Fig. 2a). However, this behaviour is not due to the rigidity of the K1–O11 bond, but rather to the weakening of these bonds and the ‘expulsion’ of the six O11 ligands from the first coordination sphere. This weakening of the K1–O11 bonds can be quantified by calculating bond weights in the K1 polyhedron (Hoppe, Reference Hoppe1979; Nespolo et al., Reference Nespolo, Ferraris and Ohashi1999), which correspond to the contribution of each bond to the effective coordination number (ECoN). The bond weights of K1–O11 bonds decrease gradually from ∼0.9 to ∼0.1 over the pressure range of 0.3–5.3 GPa (as shown in Fig. 2c), while the bond weights of K1–O12 remain between 1.1 and 1.2 over the entire studied pressure range. This has an important consequence: the effective coordination number of the K1 site decreases from ∼12 to ∼7.5 over the 0.3–5.3 GPa pressure range in a quasi-linear manner (Fig. 2d; a discontinuity between 0.8 and 1.8 GPa is probably due to a subtle structural transformation that was overlooked in the original publication). At higher pressures, the negative dECoN/dP slope becomes gentler, indicating a change in the compressive behaviour of the structure.
At first glance, the observed behaviour of the K1 effective coordination number appears counter-intuitive, as most crystallography and mineralogy textbooks traditionally state that higher pressure should promote an increase in coordination number. While this may be true for textbook examples such as the four-fold to six-fold coordination changes of silicon and aluminium in high-pressure aluminosilicates, it does not necessarily apply to larger cations with their distinct crystal chemistry. Instead, a more fundamental principle to consider is Pauling’s first rule, which states that coordination number depends on the ratio of ionic radii. In the context of high-pressure crystal chemistry, this can be rephrased as: under compression, the coordination number tends to increase for less compressible cations and decrease for more compressible cations compared to anions. Such a formulation explains readily both the increase in the coordination number of silicon and aluminium in high-pressure aluminosilicates (as Si4+ and Al3+ cations are less compressible than the O2– anion) and the decrease in the coordination number of potassium in kokchetavite discussed above (as the 12-coordinated K+ cation is more compressible than the O2– ligands). The corresponding changes in the coordination sphere hence demonstrate the following features:
(1) When the central cation is less compressible than the ligand anions, upon compression, its first coordination shell tends to expand, accommodating additional ligands from the outer coordination spheres.
(2) When the central cation is more compressible than the ligands, upon compression, the coordination shell splits into two subshells: one collapses to form a new lower-coordination polyhedron, while the ligands of the other are expelled outside.
The latter feature does indeed occur in the case of K1 coordination in kokchetavite (Fig. 2a), which explains why considering O11 ligands in the analysis of polyhedral compressibility leads to such unphysical results. Instead, one could consider only the six nearest O12 ligands in the K1 coordination polyhedron. The volume of the resulting octahedron shows much more realistic behaviour with a bulk modulus of ∼6.5 GPa (Fig. 2b), as it reflects the properties of the most significant short K1–O12 bonds. However, this consideration, which is quite reliable at higher pressures, is questionable below 5.3 GPa, where the contribution of completely ignored O11 ligands to ECoN is certainly not negligible (Fig. 2c).
Therefore, polyhedra with pressure-induced continuous changes in coordination present a particular challenge for formalizing the definition of polyhedral compressibility. As more ligands are taken into account, the volume of the polyhedron does not reflect the actual bonding interactions. Otherwise, it does not account for the significant contribution of certain ligands. Attempting to divide the studied pressure range into segments based on different geometries of the coordination polyhedron would hinder the analysis of volume compressibility, which requires a continuous volume vs. pressure curve. It would also require a somewhat arbitrary and often meaningless decision on the precise pressure values at which one geometry continuously transitions into another.
To address the above issue, one can use the weighted mean bond length (hereafter r) as a measure of the linear extent of the coordination polyhedron. This automatically accounts for the contribution of each ligand to ECoN, and the weights used in the averaging correspond to the bond weights introduced above. The contribution of the closest ligands dominates the result, as can be seen in Fig. 2a, which shows the calculation of r for the K1 polyhedron in the kokchetavite structure. The value of r is close to the six shortest K1–O12 bond lengths, reflecting their dominant contribution. The volume compressibility of the polyhedron follows from the behaviour of r 3, as shown in Fig. 2b. The bulk modulus of the K1 polyhedron, calculated using r 3 (∼6.6 GPa), agrees with the octahedral approximation value reported above (∼6.5 GPa). It is worth noting that in the case of regular polyhedra with equivalent bond lengths, such as those analysed by Hazen and Finger in their derivation of equation 1, the volume compressibility obtained from r 3 is algebraically equivalent to that calculated directly from the polyhedral volume.
Furthermore, the use of the weighted mean bond length concept to evaluate polyhedron compressibility allows us to expand the geometrical considerations discussed above in the following way:
(1) When the central cation is less compressible than the ligand anions, upon compression, its first coordination sphere tends to ‘expand’, accommodating additional ligands from the outer coordination spheres. This leads to an increase in the weighted mean bond length and a negative steric contribution to the compressibility, which becomes lower than that predicted by equation 1 for a fixed coordination number.
(2) When the central cation is more compressible than the ligand anions, upon compression, its coordination sphere tends to split into two sub-shells. One of them ‘collapses’ to form a new coordination with a lower coordination number, while the ligands of the other are ‘expelled’ outside. This leads to a decrease in the weighted mean bond length and a positive steric contribution to the compressibility, which becomes greater than predicted by equation 1 for a fixed coordination.
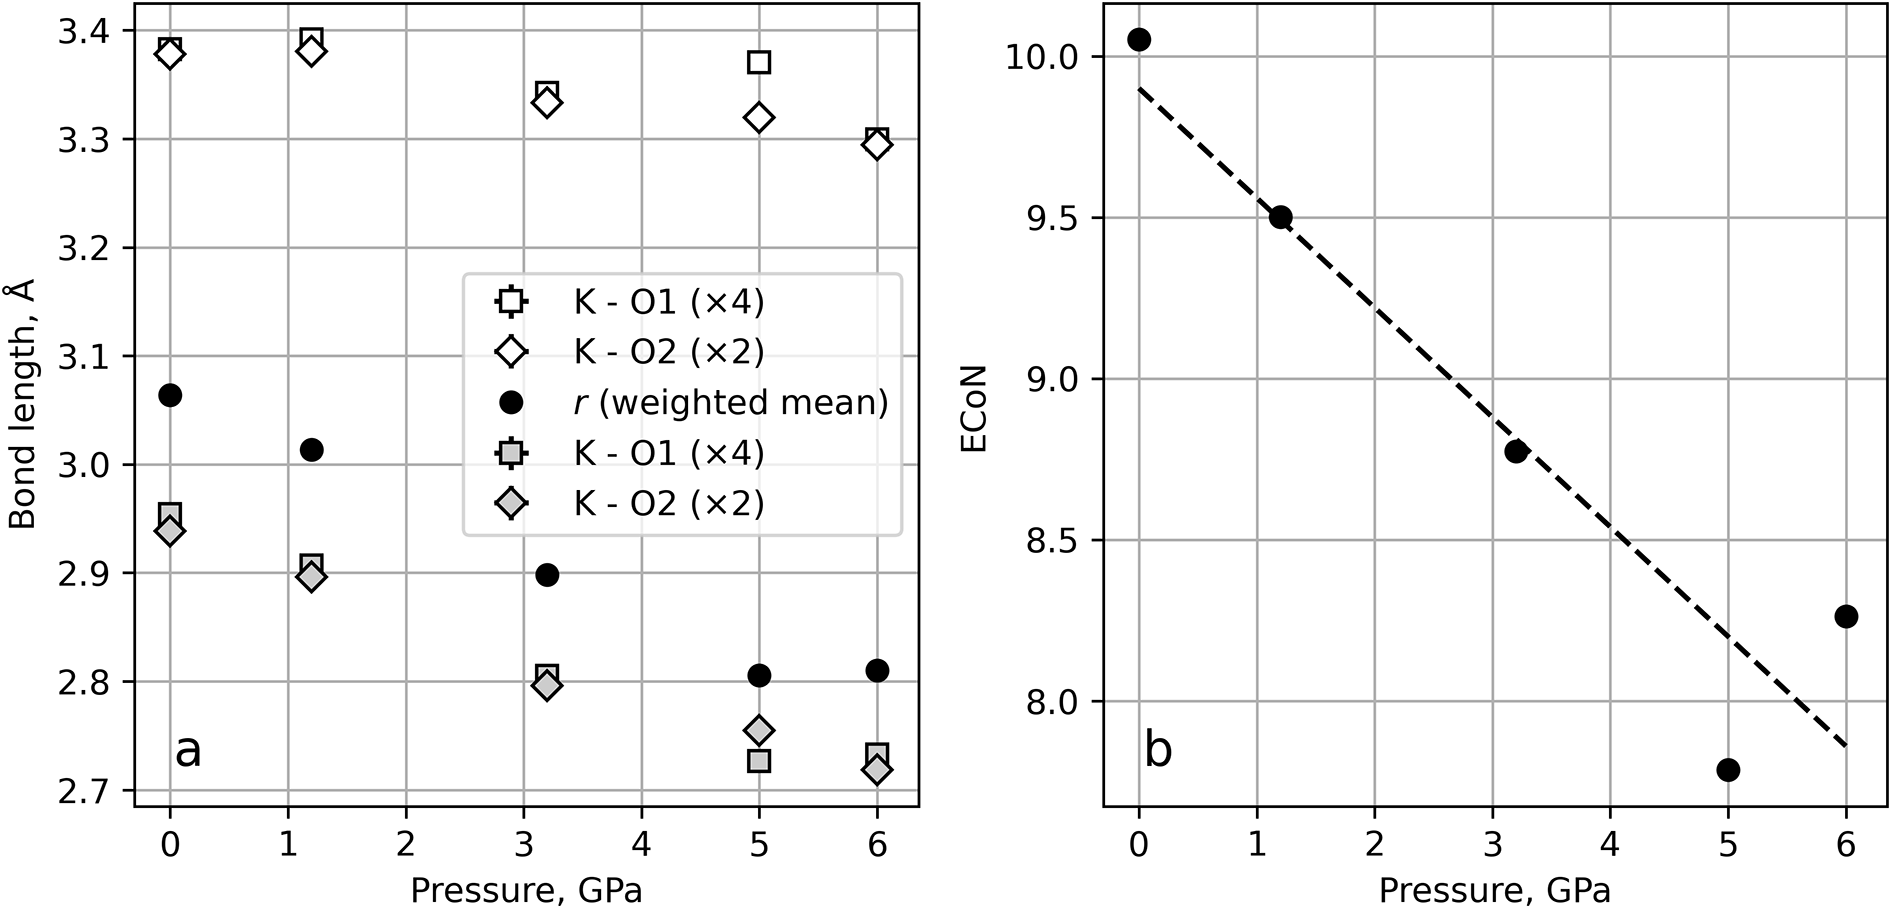
The features of K+ coordination observed in the kokchetavite structure are similar to those found in the crystal structures of leucite, nepheline, phlogopite-1M and microcline (Table 1), i.e. those where a K+ cation occupies a relatively large and ‘soft’ structural cavity. For example, in the crystal structure of phlogopite-1M, the K+ cation is also ‘sandwiched’ between two six-membered rings of tetrahedra. Under pressure, the pressure-induced ‘ditrigonalization’ of these rings leads to a rapid compression of the six shortest K–O distances, from ∼2.95 Å at 1 atm to ∼2.7 at 6 GPa (Fig 3a). However, the six distances to ‘outer’ oxygen ligands only decrease by <0.1 Å, leading to a decrease in ECoN from ∼10 to ∼8 (Fig. 3b).
Parameters of K+ site coordination in the phlogopite-1M structure under compression. Grey and white symbols represent the six nearest ligands and the six ‘outer’ ligands, respectively. Black circles in (a) indicate the weighted mean distance, and dashed lines in (b) represent a least-squares fit using a linear function.

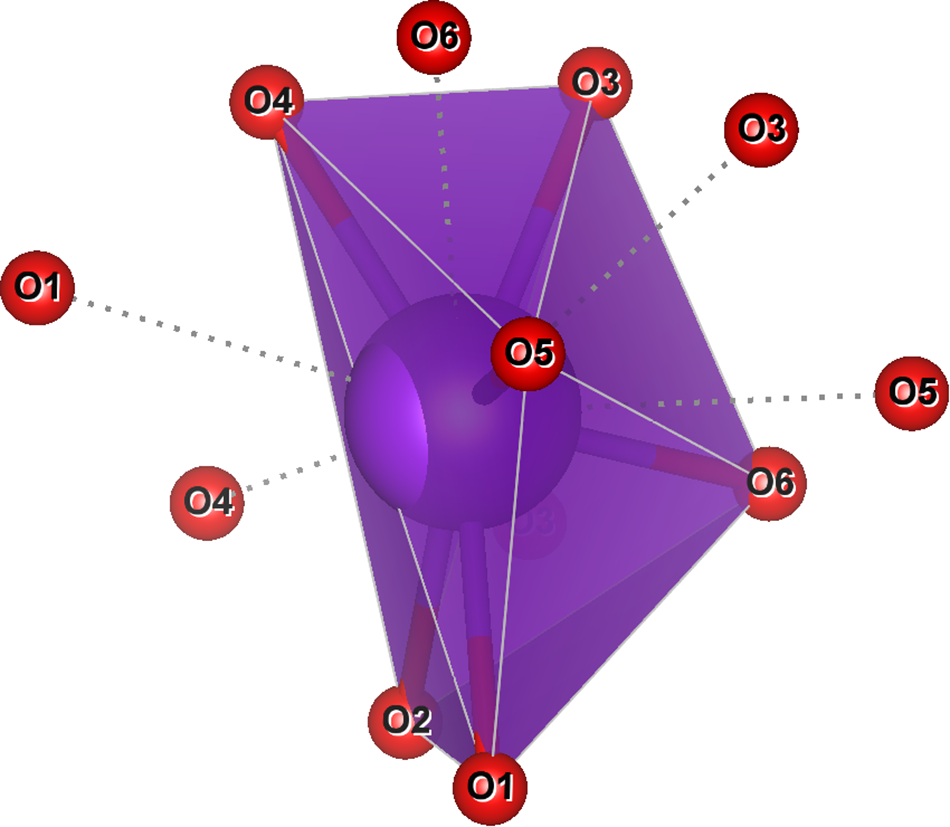
Another example is the crystal structure of leucite. In this structure, the ‘6 + 6’ coordination of the K+ site is composed of six nearest neighbours at a distance between 2.8 and 3.2 Å, and six neighbours at a further distance of between 3.4 and 3.8 Å. These latter neighbours complement the one-sided coordination by the former, as shown in Fig. 4.
Coordination of the K+ site in the crystal structure of leucite at 1 atm. The bonds to the six nearest (2.8–3.2 Å) neighbours are shown as cylinders, and the bonds to the next six neighbours (3.4–3.8 Å) are shown as dotted lines.

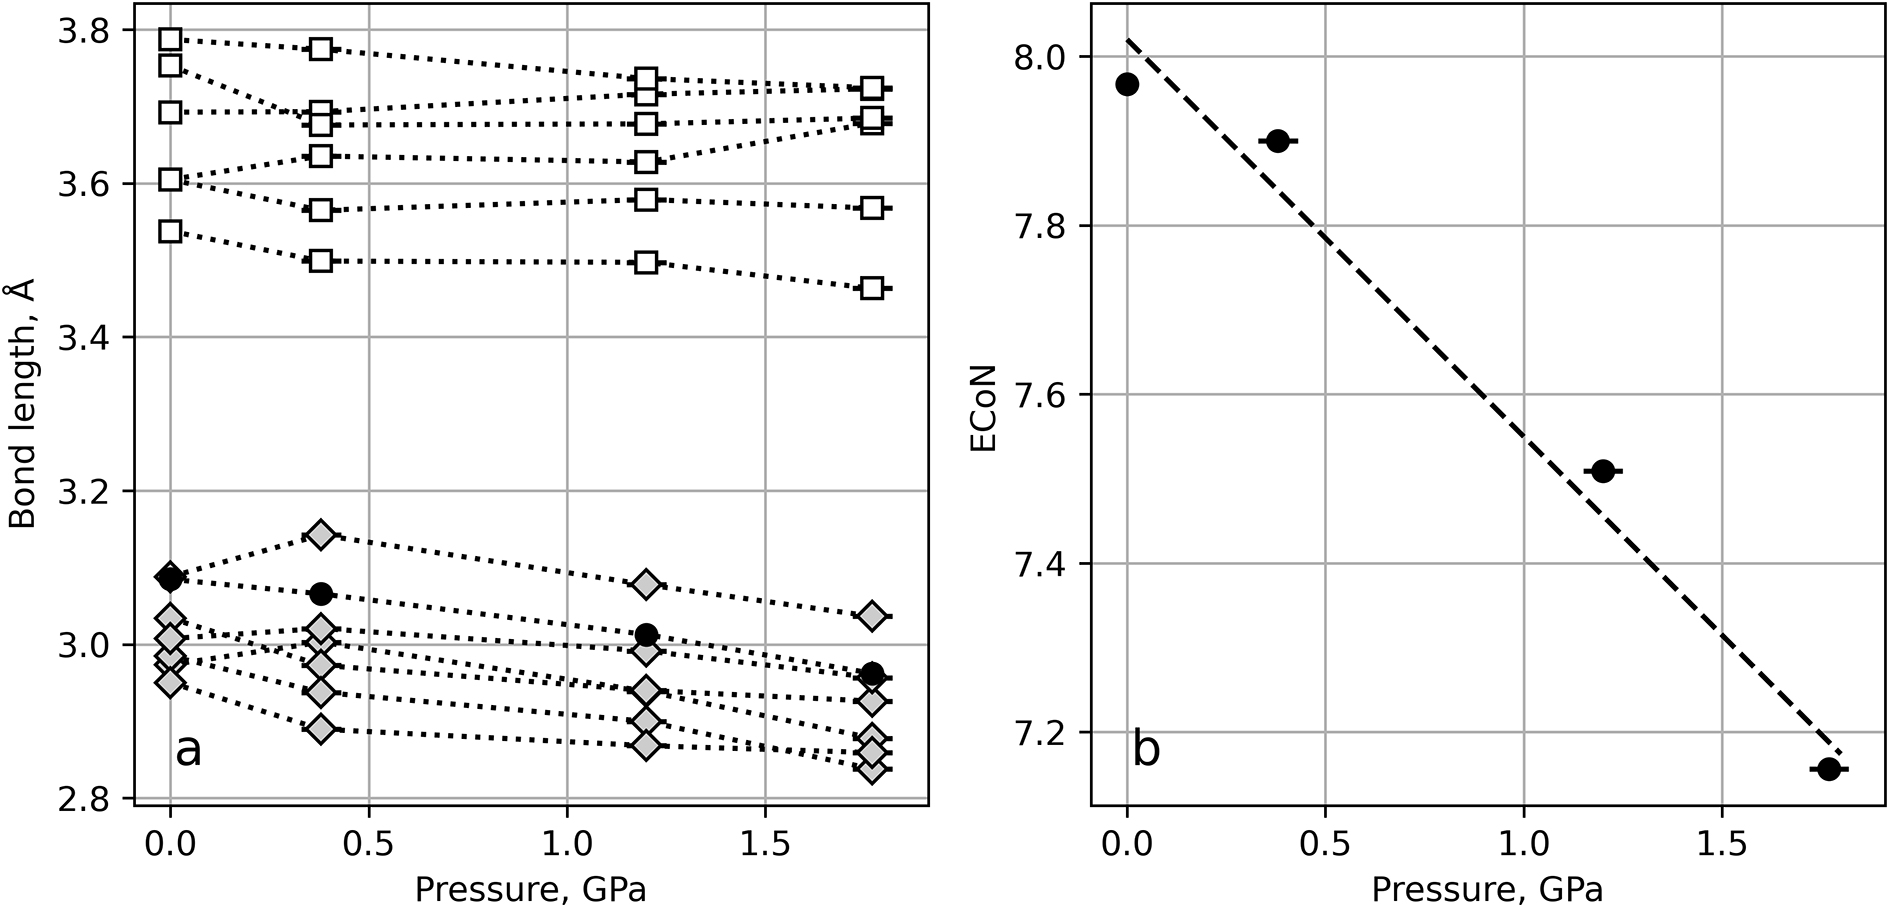
Upon compression up to 1.8 GPa, the six ‘outer’ bonds are again almost insensitive to pressure, so that their average distance decreases by only ∼0.02 Å or ∼0.6% (Fig. 5). The six closest bonds, however, demonstrate several times greater compression, by ∼0.09 Å or ∼3%. As a result, the bond weights of the ‘outer’ ligands decrease, as well as ECoN (Fig. 5b).
Parameters of K+ site coordination in the leucite structure under compression. Grey diamonds and white squares represent the six nearest and six ‘outer’ ligands, respectively. Black circles in (a) indicate the weighted mean distance. The dashed line in (b) represent a least-squares fit using a linear function.

Figure 5 Long description
A multi-line graph of bond length in angstroms versus pressure in gigapascals. The x-axis is labeled ′Pressure, GPa′ ranging from 0 to 1.8 and the y-axis is labeled ′Bond length, Angstroms′ ranging from 2.8 to 3.8. Grey diamonds represent the six nearest ligands and white squares represent the six outer ligands. The graph shows multiple series connected by dotted lines, indicating changes in bond length with pressure. The grey diamond series shows a decrease in bond length with increasing pressure, while the white square series remains relatively stable. Panel b shows a graph of ECoN versus pressure. The x-axis is labeled ′Pressure, GPa′ ranging from 0 to 1.8 and the y-axis is labeled ′ECoN′ ranging from 7.0 to 8.0. Black circles represent ECoN values, connected by a dashed line indicating a linear decrease in ECoN with increasing pressure. The graph highlights a notable decrease in ECoN from approximately 8.0 at 0 GPa to 7.2 at 1.8 GPa.
Steric contribution into compressibility of K+ polyhedra
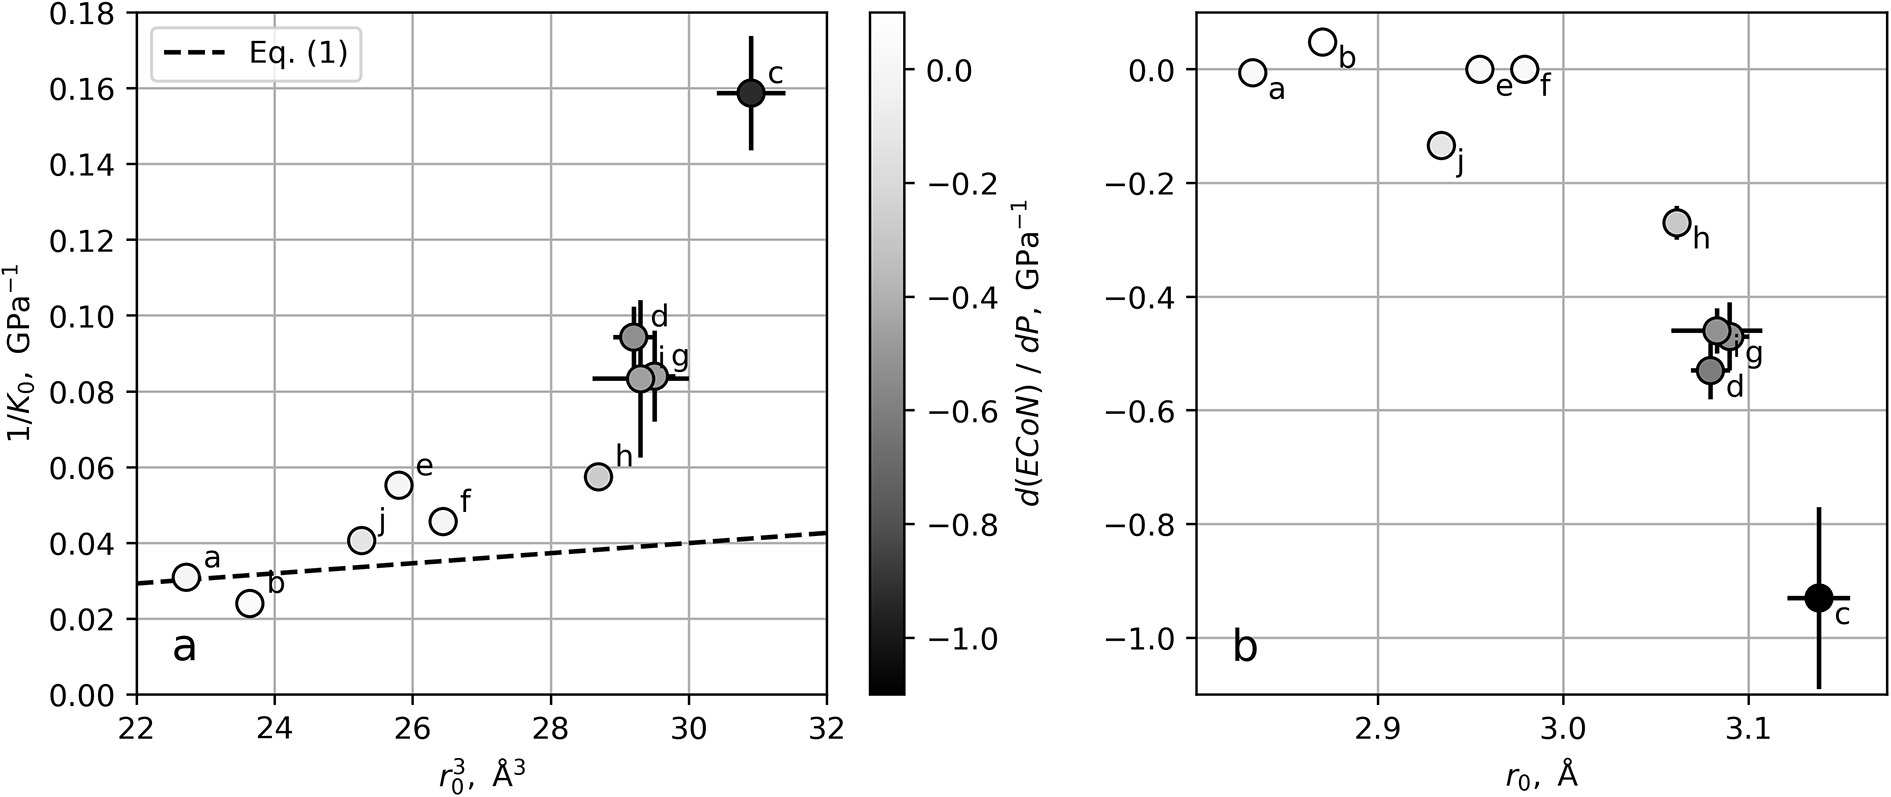
A systematic analysis of available data on the compressibility of K–O polyhedra (Table 1) confirms the above conclusions. Specifically, K+ polyhedra with nearly fixed coordination (i.e. d(ECoN)/dP ≈ 0) exhibit compressibility close to that predicted by equation 1 (Fig. 6a). In contrast, polyhedra with significant pressure-induced changes in coordination (i.e. d(ECoN)/dP < 0) show greater compressibility than predicted by equation 1 due to the additional steric contribution discussed above (Fig. 6a). It is not surprising that the deviation from equation 1 is proportional to d(ECoN)/dP (Fig. 6a), which quantifies how readily the inner coordination shell collapses upon compression. The d(ECoN)/dP value itself appears to be a function of the weighted mean bond length (Fig. 6b), such that K+ polyhedra with r 0 < 3.0 Å tend to maintain their initial coordination, while those with larger r 0 tend to collapse upon compression.
(a) Plot of compressibility vs. volume for K+ polyhedra, obtained using r 3. The dashed line represents equation 1. (b) Dependence of the d(ECoN)/dP derivative on r 0. The shading in (a) and (b) indicates the value of d(ECoN)/dP. The small letters correspond to the ‘key’ column in Table 1.

Figure 6 Long description
A scatter plot with a dashed line and a vertical shaded bar. The x-axis label is r subscript 0, A superscript 3, with tick labels 22, 24, 26, 28, 30 and 32. The y-axis label is 1 over K subscript 0, GPa superscript minus 1, with tick labels 0.00, 0.02, 0.04, 0.06, 0.08, 0.10, 0.12, 0.14, 0.16 and 0.18. A legend shows a dashed line labeled, Eq. (1). Plotted points include: a near r subscript 0 about 22.5 and 1 over K subscript 0 about 0.03; b near 23.5 and about 0.03; d near 25.5 and about 0.04; e near 26.0 and about 0.05; f near 27.0 and about 0.05; h near 29.0 and about 0.06; i near 29.5 and about 0.08; j near 29.8 and about 0.09; g near 30.0 and about 0.09; c near 31.5 and about 0.16. The dashed line rises slightly from left to right, from about 0.03 near r subscript 0 equals 22 to about 0.04 near r subscript 0 equals 32. A vertical color bar at the right has tick labels 0.0, minus 0.2, minus 0.4, minus 0.6 and minus 0.8. The image B showing a scatter plot. The x-axis label is r subscript 0, A, with tick labels 2.9, 3.0 and 3.1. The y-axis label is d ECoN over d P, with tick labels 0.0, minus 0.2, minus 0.4, minus 0.6, minus 0.8 and minus 1.0. Plotted points include: a near r subscript 0 about 2.85 and d ECoN over d P about 0.0; b near 2.90 and about 0.0; d near 2.98 and about minus 0.15; e near 3.00 and about 0.0; f near 3.02 and about 0.0; h near 3.06 and about minus 0.25; i near 3.00 and about minus 0.15; j near 3.08 and about 0.0; g near 3.10 and about minus 0.50; c near 3.12 and about minus 0.95.
Although the above considerations provide a qualitative explanation for the experimental data, it may also be interesting to quantify the steric contribution to the compressibility of polyhedra. In terms of the relative change in r 3, let us consider the ‘pure’ pressure contribution, which corresponds to the bond compression at a fixed coordination, following equation 1. We can also consider the steric contribution, which corresponds to an ‘expansion’ or ‘collapse’ of r 3 due to a gradual change in the effective coordination number:
 \begin{align}
\text{d}r^{3}/r^{3}=\left(\frac{\partial r^{3}/r^{3}}{\partial P}\right)_{ECoN}\cdot\text{d}P+\left(\frac{\partial r^{3}/r^{3}}{\partial ECoN}\right)_{P}\cdot\text{d}(ECoN).
\end{align}
When the effective coordination number itself depends on pressure, it follows
 \begin{equation}
\begin{split}
{\text{d}}{r^3}/{r^3} = {\left( {\frac{{\partial {r^3}/{r^3}}}{{\partial P}}} \right)_{ECoN}} \cdot {\text{d}}P + {\left( {\frac{{\partial {r^3}/{r^3}}}{{\partial ECoN}}} \right)_P} \cdot \frac{{{\text{d}}\left( {ECoN} \right)}}{{{\text{d}}P}}\cdot {\text{d}}P
\end{split}
\end{equation}
 \begin{equation}\frac{{{\text{d}}{r^3}/{r^3}}}{{{\text{d}}P}} = {\left( {\frac{{\partial {r^3}/{r^3}}}{{\partial P}}} \right)_{ECoN}} + {\left( {\frac{{\partial {r^3}/{r^3}}}{{\partial ECoN}}} \right)_P} \cdot \frac{{{\text{d}}\left( {ECoN} \right)}}{{{\text{d}}P}}\end{equation}
or
 \begin{equation}{{\unicode{x03B2} }} = {{{{\unicode{x03B2} } }}_P} + {{{\unicode{x03B2} }}_{ECoN}}\end{equation}
where
 \begin{equation}{\unicode{x03B2}}=-\frac{\text{d}r^3/r^3}{\text{d}P}=\frac1{\textit{K}}\end{equation}
 \begin{equation}{{{\unicode{x03B2} }}_P} = - {\left( {\frac{{\partial {r^3}/{r^3}}}{{\partial P}}} \right)_{ECoN}}\end{equation}
and
 \begin{equation}{{{\unicode{x03B2} }}_{ECoN}} = - {\left( {\frac{{\partial {r^3}/{r^3}}}{{\partial ECoN}}} \right)_P} \cdot \frac{{{\text{d}}\left( {ECoN} \right)}}{{{\text{d}}P}}\end{equation}
are overall compressibility (β) and its pressure (βP) and steric (βECoN) parts.
Since the first derivative in equation 8 is positive, the sign of the steric contribution βECoN will depend on the slope of d(ECoN)/dP. When the effective coordination number decreases with pressure, i.e. when the cation exhibits greater compressibility than the ligands, the overall compressibility will be greater than predicted by equation 1 and vice versa.
Although the steric contribution to polyhedron compressibility can be estimated simply as the difference between the measured 1/K (where K is the bulk modulus) value and that predicted by equation 1, it is also interesting to evaluate it independently using the observed d(ECoN)/dP value. For this evaluation, a value of the first derivative in equation 8 is needed, which corresponds to the relative change in polyhedron volume caused by a change in the number of ligands. Although this value is geometry-specific, reasonable approximations can be made. For coordination numbers between eight and 12, for example, linear interpolation between r 3 values for a regular cube (ECoN = 8) and a cuboctahedron (ECoN = 12), assuming a fixed distance between neighbouring ligands, gives
 \begin{equation}\frac{{\partial {r^3}/{r^3}}}{{\partial ECoN}} \approx \frac{1}{{ECoN - 0.59}}\end{equation}
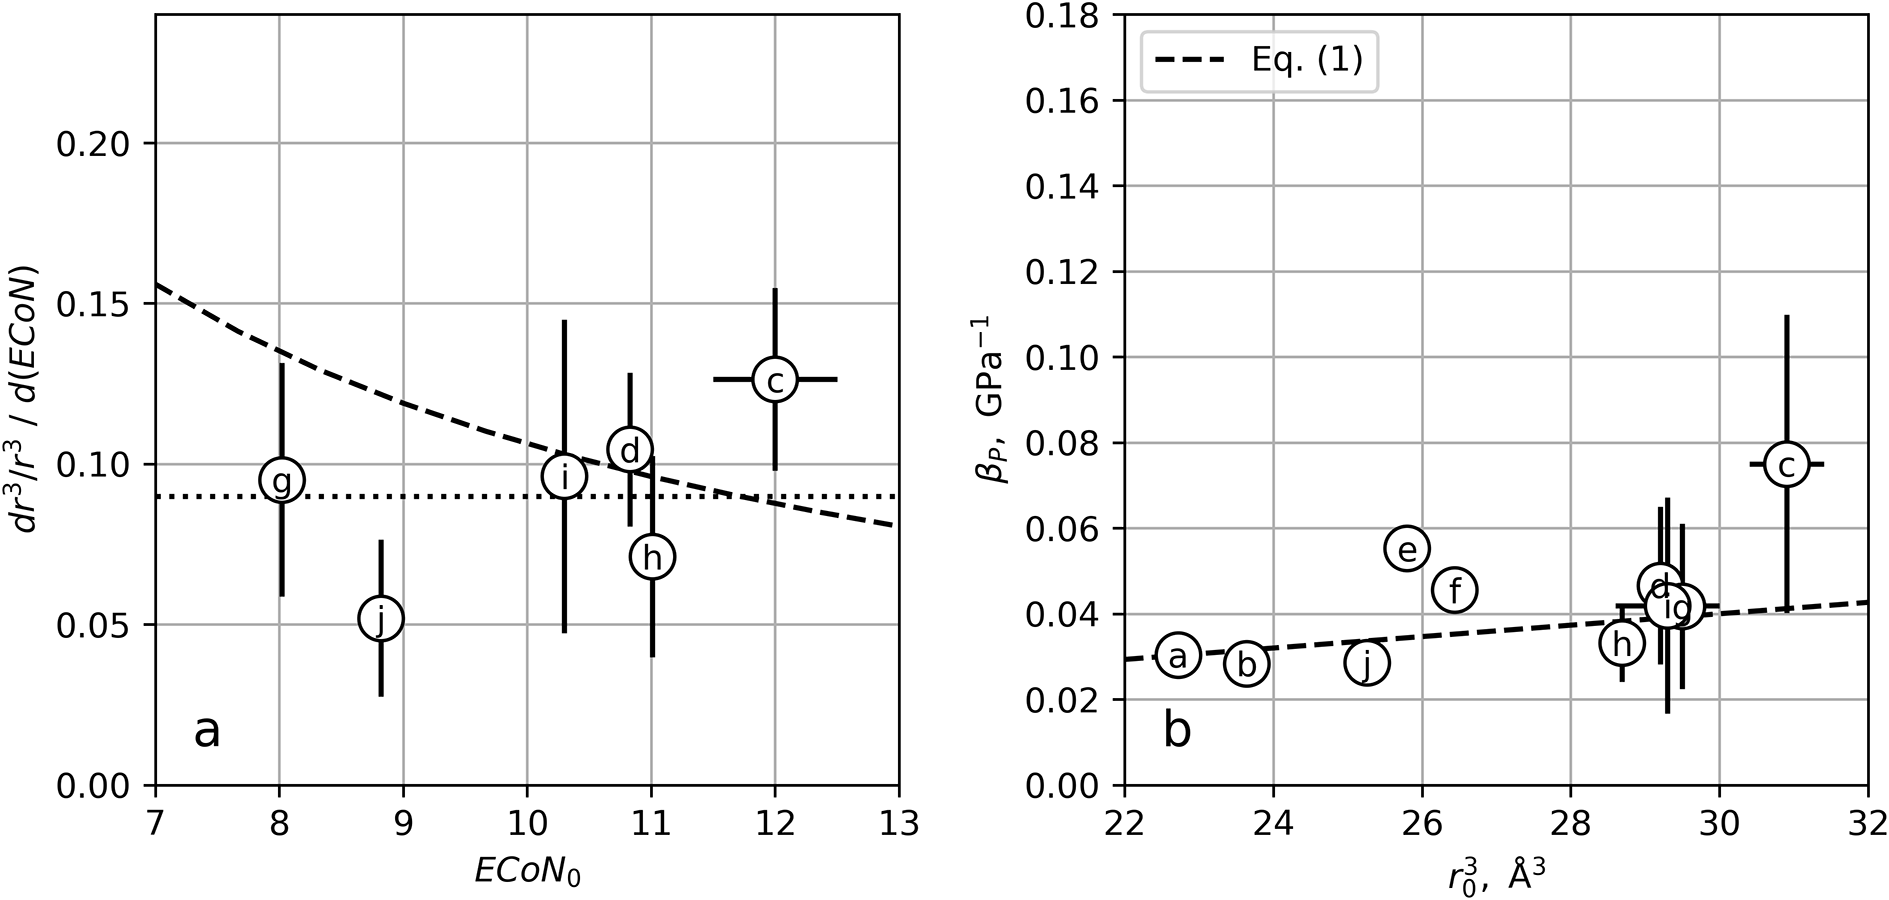
which corresponds to a value of ∼0.11 at ECoN = 10. The empirical data yield a similar average value of 0.09(3) within the analysed ECoN range (Fig. 7a), although the data scatter makes it difficult to discuss the exact dependence on the effective coordination number.
The dr 3/r 3/d(ECoN) value of 0.09(3) allows us to evaluate independently the steric contribution βECoN to the overall compressibility using equation 8, and then subtract this value to obtain the ‘pure’ pressure contribution, βP. The resulting values (Fig. 7b) are in reasonable agreement with equation 1 indicating a general suitability of the proposed approach.
(a) The derivative dr 3/r 3/d(ECoN) vs. ECoN 0 calculated using equation 8. The data with |d(ECoN)/dP| < 0.1 was omitted to avoid propagating large uncertainties. The dotted line represents an average value of 0.09(3) and the dashed line is the linear interpolation between the regular cube and the cuboctahedron, as described in the text. (b) The pressure contribution to the overall compressibility of K+ polyhedra. The dashed line represents equation 1. The small letters correspond to the ‘key’ column in Table 1.

Conclusions
A difference in the compressibility of a central ion and its ligands can lead to a continuous pressure-induced change in coordination. This should be examined by plotting the effective coordination number vs. pressure curves. A decrease in the effective coordination number (ECoN) with pressure can lead to the splitting and ‘collapse’ of the coordination sphere, creating an additional (steric) contribution to the overall volume compressibility of the coordination polyhedron. When the ECoN changes with pressure, the traditional methods of analysing polyhedron compressibility based on its geometric volume can be misleading. Instead, use of weighted mean bond lengths and their cubes as measures of the linear and volume compressibilities of polyhedra for unbiased analysis is recommended.
The proposed formalism, which separates ‘pure’ pressure and steric contributions to polyhedral compressibility, is, on the one hand, fully consistent with traditional treatments of polyhedral compressibility at fixed coordination, and on the other hand, provides a versatile new tool for high-pressure crystal chemistry. Some promising applications of this formalism include:
(1) The high-pressure behaviour of small cations, such as Si4+, Al3+, B3+ and C4+, which may exhibit continuous transitions between four-, five- and six-fold coordination, or three- and four-fold coordination.
(2) High-pressure structural chemistry of glasses and melts, especially those containing small cations listed in the previous point. While the traditional concept uses geometric volumes of polyhedra that are barely accessible for experimental studies of disordered systems, averaged parameters such as ECoN and the weighted mean bond length can, in principle, be extracted directly from pair distribution functions obtained either experimentally or using molecular-dynamics simulations.
Acknowledgements
This work was supported by the Russian Science Foundation (grant No. 23-77-10047).
Competing interests
The authors declare none.