Information Transfer Mechanisms: Dynamics and Fitness
Many areas of science are concerned with how information moves on networks. Biologists, for example, try to understand how signals are transferred across animal groups (Handegard et al. Reference Handegard, Leblanc, Boswell, Tjostheim and Couzin2012; Strandburg-Peshkin et al. Reference Strandburg-Peshkin2013) and how genetic information moves and spreads between individuals and across populations in sexual networks (Chowdhury et al. Reference Chowdhury, Lloyd-Price, Smolander, Baici, Hughes, Yli-Harja, Chua and Ribeiro2010; Holland Reference Holland2012). Computer scientists ask how to optimally transfer information across computer networks and between networks of sensors (Wooldridge Reference Wooldridge2002; Germano and de Moura Reference Germano and de Moura2006; Tanenbaum Reference Tanenbaum2006; Danon, Arenas, and Díaz-Guilera Reference Danon, Arenas and Díaz-Guilera2008; Czaplicka, Holyst, and Sloot Reference Czaplicka, Holyst and Sloot2013; International Journal of Sensors and Sensor Networks, 2013–). Public health policy makers ask about optimal ways of targeting and delivering health information (Hawe and Potkin Reference Hawe and Potkin2009; Grim et al. Reference Grim, Reade, Singer, Fisher and Majewicz2010a, Reference Reade, Singer, Fisher and Majewicz2010b, Reference Grim, Thomas, Fisher, Reade, Singer, Garz, Fryer and Chatman2012b). Marketing researchers want to know how information spreads by word of mouth and over social networks and the effect that has on acceptance of innovation and product adoption (Valente Reference Valente1995; Achrol and Kotler Reference Valente1999; Gordon Reference Gordon1999; Easley and Kleinberg Reference Easley and Kleinberg2010). Policy makers are interested in information flow across social communication networks with an eye to policy formulation, promulgation, and enforcement (Atkinson and Coleman Reference Atkinson and Coleman1992; Peterson Reference Peterson2003; Nekovee et al. Reference Nekovee, Moreno, Bianconi and Marsili2007).
These questions also show up in philosophy. How information moves is one of the primary questions of the philosophy of information (Floridi Reference Floridi2003, 2011; Adriaans and van Benthem Reference Adriaans and van Bentham2008), but the flow of information is also important to social epistemologists, political philosophers, and researchers on the evolution of norms (Alexander and Skyrms Reference Alexander and Skyrms1999; Goldman Reference Goldman1999; Bendor and Swistak Reference Bendor and Swistak2001; Bicchieri Reference Bicchieri2006; Alexander Reference Alexander2007). Additionally, philosophers of science ask how the social structure of science and the transfer of information affect the knowledge of the community at large (Grim Reference Grim2009; Weisberg and Muldoon Reference Weisberg and Muldoon2009; Zollman Reference Zollman2010, Reference Zollman2013; Alexander Reference Alexander2013; Grim et al. Reference Grim, Singer, Fisher, Bramson, Berger, Reade, Flocken and Sales2013).
For concreteness, let us consider three questions:
1. Germs: How does influenza get transmitted between individuals in different social groups?
2. Genes: How does a new advantageous genotype spread through a population over time?
3. Memes: How do communities of scientists converge on a view about the likelihood of a stochastic event when information is sparse?
Each of these questions is about the dynamics of some kind of information on a network. Germs contain genetic information in RNA and DNA that is spread through contact and infection. Genetic information coded in DNA is passed through social reproduction networks. Memes carry propositional information through belief and communication networks.
Because all three questions are about how information moves on networks, they are often lumped together. In particular, it has been popular to draw an analogy between meme transfer and infection dynamics (Le Bon Reference Le Bon1897; De Tarde Reference De Tarde1903; Park Reference Park1904; Park and Burgess Reference Park and Burgess1921; Blumer Reference Blumer and Lee1951, Reference Lee1969). Douglas Hofstadter, Richard Dawkins, Daniel Dennett, and Susan Blackmore have all discussed beliefs as acting like viruses by spreading socially, competing for fitness, and mutating (Dawkins Reference Dawkins1976, Reference Dawkins and Dalhbom1993; Hofstadter Reference Hofstadter and Machlup1983; Dennett Reference Dennett1991; Blackmore Reference Blackmore2000).Footnote 1 Network and complexity researchers have also adopted this line. Newman, for example, suggests that germs and memes can be considered together by pointing out that varying the structure of the network “might substantially influence the propagation of a rumor, a fashion, a joke, or this year’s flu” (Reference Newman2001, 404). Gross, D’Lima, and Blasius also claim that their work on disease spread on networks has implications for “the spreading of information, opinions and beliefs in a population” because memes “can be described in a similar way” (Reference Gross, D’Lima and Blasius2006, 208701–4).
One way scholars have modeled all three phenomena at once is by treating them all as a simple kind of diffusion on a network. A diffusion model uses a network of nodes that can be thought of as people, communities, bots, journals, or anything else that can serve as bearers of information. The model then progresses step by step: if a node has some information at one time step, then in the next time step its neighbors (probabilistically, at least) have the information. Over time, the information percolates to all of the nodes.
When information flow for germs, genes, and memes is modeled as diffusion, the main determinant of how information moves on the network is the structure of the network. It is well established that network structure does importantly affect the amount of time required for information to spread by diffusion (e.g., Zollman Reference Zollman2007, Reference Zollman2013). What we show in this paper is that any simple model of that kind must leave out important aspects of information dynamics.
Different forms of information have different characteristic mechanisms of transfer. Germs use the asexual reproduction characteristic of infection, genes of higher organisms use sexual reproduction with crossover, and beliefs are transferred through learning, reinforcement, and accommodation. In what follows, we use simple computer-aided simulations to explore the dynamics of these three forms of information transfer on linked subnetworks.
Importantly, our models are idealized and are not meant to be fully accurate models of germs, genes, or memes. As minimal models, they are meant to capture the main dynamical features of the phenomena that give each information transfer type its distinctive character. The purpose of such minimal models is to isolate the core causal features important in explaining the phenomena (Weisberg Reference Weisberg2007).
Part 1 shows that transfer type is at least as important as network structure when it comes to convergence speed. Where the timing of the spread across a community is of concern—whether because we want to delay the spread of viral infection or because we want to optimize scientific inquiry—it is critical that we first ask how the kind of information at issue moves. In part 2 we focus on the relative fitness of these types of information transfer. A highly fit pathogen is one that infects a host population so as to optimize reproduction and spread. A fit gene is one that under selective pressure best survives and spreads across a population. A fit meme or belief is one that accurately represents the world, optimizes cognitive function, or otherwise benefits its agent (Grim Reference Grim2009). In this second part of the article, we take some first steps toward exploring differences in fitness between these three types of information transfer, again with an emphasis on linked subnetworks. Our results indicate how different types of information can be used to optimize different goals while making clear some of the costs of those optimizations.
Generally, what our results indicate is that questions about information dynamics on networks cannot be answered solely or even primarily in terms of network structure. How network structure affects information dynamics is differentially determined by the specific type of information transfer at issue. We cannot lump together different types of information and ask about their dynamics. It is only once we restrict ourselves to a specific mode of transfer that there are consistent effects of network structure.
Information Networks
Real social networks are not uniform and homogenous. Social communities are composed of subcommunities, with varying degrees of contact in terms of the physical contact necessary for disease transmission, the sexual contact necessary for genetic mixing, and the communication streams necessary for belief transfer. For animals, understanding subcommunities divided by geographical and ecological barriers is crucial for understanding both disease transmission and the genetics of speciation. For people, subcommunities are divided along racial, ethnic, demographic, and socioeconomic lines. In order to understand infection dynamics, we need to understand physical contact networks, including contact links and gaps between subcommunities. In order to understand genetic change, we need to understand links of sexual contact between subcommunities. In the case of belief, we need to understand the impact of linkages between subcommunities, not only of physical contact but also of communication and trust.
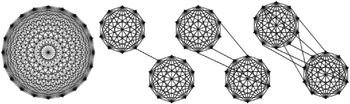
Figure 1 shows a series of four networks related in terms of their structure. The network on the left is a single total network. The three pairs on the right form paired total subnetworks with increasing numbers of connecting links.
Single total network and increased degrees of linkage between total subnetworks.

There are many ways to measure the connectedness of a network, including ratios of the number of links and nodes (like the Alpha, Beta, and Gamma indices); measures over node degrees, betweenness centralities, or closeness centralities of the nodes; graph eccentricity; and average shortest path length. What’s relevant to us is the connectedness of the subnetworks to each other, not the connectedness of each subnetwork. As such, we can naturally measure connectedness in terms of the number of linkages between nodes of different subnetworks as a percentage of the total possible. Linkages like this have also been termed ‘bridges’ in computer networking and identified as a key area for future work in network studies and health care by Trotter, Rothenberg, and Coyle (Reference Trotter, Rothenberg and Coyle1995). L. C. Freeman (Reference Freeman1978) also uses this notion but describes it as segregation and integration between subnetworks.
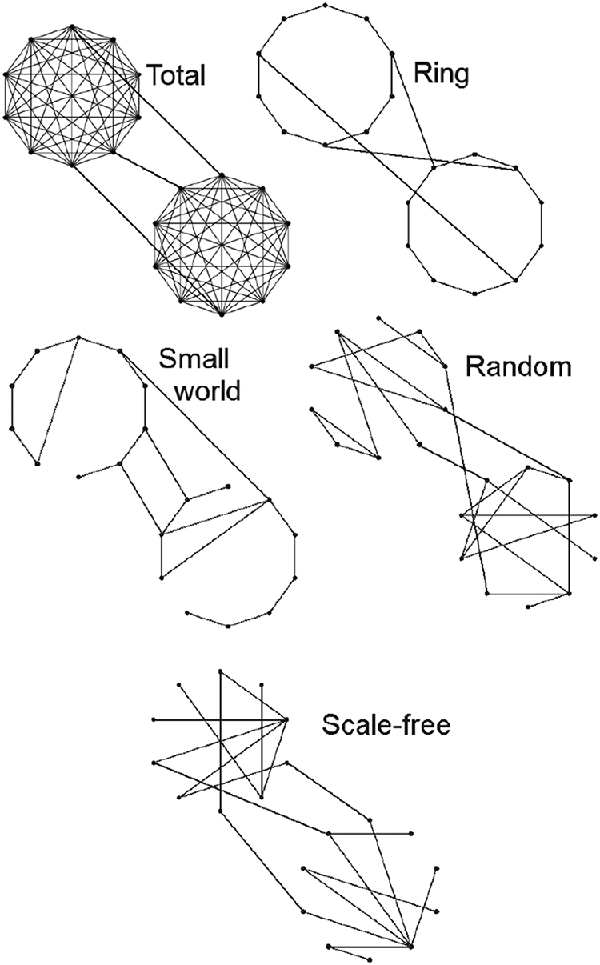
Figure 2 shows the types of linked subnetworks we use in the present study: linked total networks, rings, small worlds, and random and scale-free networks. For simplicity, we use just two subnetworks of 50 nodes each. Our rings use just one connection to a single neighbor on each side. For small worlds we work with single rings in which 9% of nodes have been rewired at random. In our random networks 4.5% of possible connections are in each subnetwork. Small-world and random networks had added links to connect them, when necessary. Our scale-free networks are constructed by the preferential attachment algorithm of Barabási and Albert (Reference Barabási and Albert1999).
Network types. Smaller numbers of nodes are shown here for visibility.

In the course of our investigation we vary both the types of subnetworks and the number of links between them.Footnote 2 Part of our methodology calls for a comparison between results for linked 50-node subnetworks of a given type and results for a single 100-node network of that type. We compare results for a particular number of links between ring subnetworks with results for the same number of links added to a single ring, for example. This method allows us to focus on the effects of two distinct aspects of network structure:
1. network type—ring, wheels, hubs, small worlds, random, or scale-free; and
2. degree of linkage between subnetworks.
We use differences between results on single networks and linked subnetworks to tease out which aspects of overall network structure give rise to particular results. Similar outcomes between a single network of a particular type and linked subnetworks of that type are evidence that it is the network type rather than details of linkage that is important for the result. Different outcomes between a single network and linked subnetworks—particularly where differences carry across different network types—are evidence that it is degree of linkage between the subnetworks that is doing the work.
Part 1: Network Dynamics for Germs, Genes, and Memes
Infection
Germs are the simplest case. Here we vary (a) the structure of subnetworks, that is, whether the subnetworks are rings, small worlds, random, scale-free, or total, and (b) the degree of linkage between those subnetworks. What effect does each of these have on the dynamics of infection?
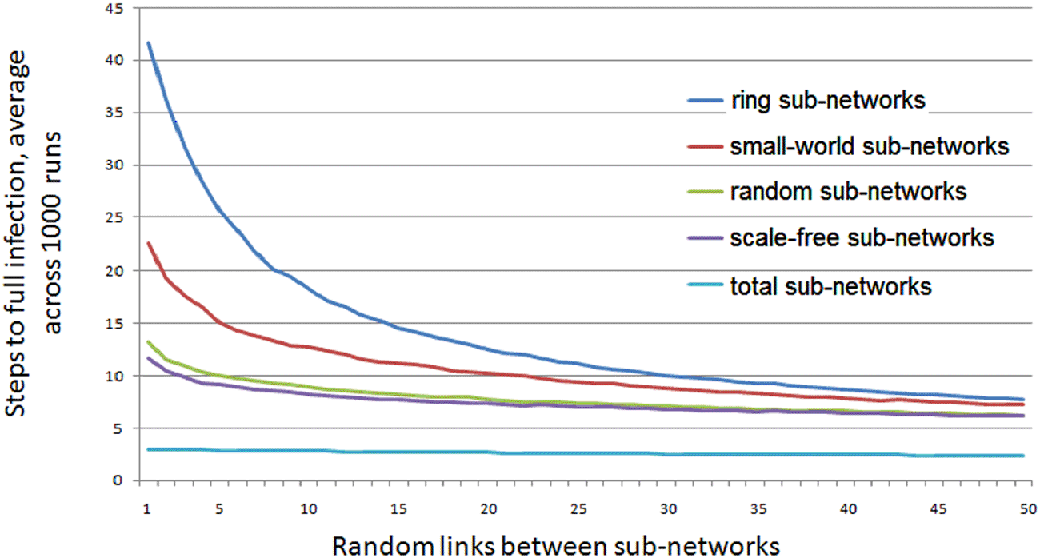
Regardless of the infection transmission rate, time to total infection is importantly sensitive to network structure. It is not sensitive, however, to whether that structure is instantiated as a single network or as linked subnetworks. Figure 3 shows results from simulations for increased linkages between subnetworks. For each number between 1 and 50 we create 1,000 networks with random links of that number between subnetworks, starting with a single infected node. Figure 3 shows the average steps to total network infection over the 1,000 runs, here using a 100% infection rate. Figure 4 shows results in which links are added not between subnetworks but within a single large network of each structure.
Average time to total infection with increasing links between subnetworks. Lines plotted top to bottom, as specified in key.

Average time to total infection with increasing links added in single networks. Lines plotted top to bottom, as specified in key.

Results in the two cases are virtually identical. The difference in plotted lines in each figure shows that network structure does make a significant difference in time to total infection, but the fact that such a structure is instantiated in subnetworks rather than a single network does not make a difference. In all the cases considered, it is network and subnetwork type, not the degree of linkage between subnetworks, that produces the signatures of infection transmission.Footnote 3
To predict, explain, or understand the course of an epidemic—or of information transfer analogous to an epidemic—what one needs to know first is not the degree of linkage between subnetworks but the characteristic structure of the subnetworks themselves.
Memes and Beliefs
Like germs, memes spread across social networks, but in this case, the dynamics of the diffusion are strikingly different. Much work has trumpeted similarities in infection dynamics and the spread of ideas, and they are often treated with the same models (see above and Newman and Watts Reference Newman and Watts1999; Newman Reference Newman2001; Wang and Chen Reference Wang and Chen2003; Börner, Maru, and Goldstone Reference Valente2004; Gross et al. Reference Gross, D’Lima and Blasius2006; Jackson and Rogers Reference Jackson and Rogers2007; Pautasso and Jeger Reference Pautasso and Jeger2008). Here we show that they’re not as similar as they’re often taken to be.
In our models, agents’ beliefs are represented as a single number between 0 and 1, which we can think of as an estimate of a fixed quantity, such as about the value of a natural constant, the probability of contracting a disease, or the effectiveness of a vaccination (Janz and Becker Reference Janz and Becker1984; Mullen, Hersey, and Iverson Reference Mullen, Hersey and Iverson1987; Harrison, Mullen, and Green Reference Harrison, Mullen and Green1992; Strecher and Rosenstock Reference Strecher, Rosenstock, Glanz, Lewis and Rimer1997).
It is clear that a person’s beliefs are influenced, among other things, by the beliefs of those with whom they have contact. In our models, agents update their beliefs using an average of the beliefs of those with whom they have network contact. Here we follow the central modeling tradition for belief updating first discussed by French (Reference French1956) and Harary (Reference Harary and Cartwright1959), brought into a contemporary form by DeGroot (Reference DeGroot1974) and with network applications, like in Golub and Jackson (Reference Golub and Jackson2010, Reference Golub and Jackson2011) and Dandekar, Goel, and Lee (Reference Dandekar, Goel and Lee2013). What an averaging mechanism effectively mimics, in a simple way, is the pattern of reinforcement often characteristic of belief change. The more one’s beliefs are like those of more of one’s network neighbors, the less inclination there will be to change those beliefs. The more one’s beliefs are out of sync with one’s neighbors, the greater the pressure there will be to change one’s beliefs (Asch Reference Asch1952, Reference Asch1955; Bond and Smith Reference Bond and Smith1996; Cialdini and Golstein Reference Cialdini and Goldstein2004). DeMarzo, Vayanos, and Zwiebel (Reference DeMarzo, Vayanos and Zwiebel2003) argue that updating according to a basic rule of this form can be seen as a boundedly rational heuristic that is consistent with psychological theories of persuasion bias. Alternatives have been proposed, often with attention to parameters of polarization rather than convergence, though these are most easily seen as refinements or variations on the simple form of the central model we use here (Friedkin and Johnsen Reference Friedkin and Johnsen1990; Krause Reference Krause, Elaydi, Ladas, Popenda and Rakowski2000; Hegselmann and Krause Reference Hegselmann and Krause2002; Bindel, Kleinberg, and Oren Reference Bindel, Kleinberg, Oren and Ostrovsky2011; Acemoglu et al. Reference Acemoglu, Como, Fagnani and Ozdaglar2012; Grim et al. Reference Grim, Bramson, Singer, Fisher, Flocken and Berger2012a; Su et al. Reference Su, Liu, Li and Ma2014). For simplicity’s sake, we concentrate on the flow of beliefs within a communication network, independent of any external input or information, though important work has been done there as well (Zollman Reference Zollman2007, Reference Zollman2013; Grim Reference Grim2009; Grim et al. Reference Grim, Singer, Fisher, Bramson, Berger, Reade, Flocken and Sales2013).
Using belief averaging, regardless of initial assignment of belief values, all agents in this model eventually approach the same belief value. We can therefore measure the effect of network structure on belief convergence by measuring the number of steps required on average until all agents in the network are within, say, a range of .1 above or below the mean belief across the network as a whole. In what follows we use this range of variance from the mean as our measure of convergence, averaging over 100 runs in each case.
We begin with polarized agents. Half of our agents are drawn from a pool with belief measures that form a normal distribution around .25, with a standard deviation of .06. The other half are drawn from a pool with belief measures in similar normal distribution around .75. In the case of single networks, agents are drawn randomly from each pool. In studying linked subnetworks, our agents in one subnetwork are drawn from the .25 pool; those in the other are drawn from the .75 pool. Belief polarization of this form is necessary to study the effects of subnetwork linkage in particular; were beliefs of our agents randomized within each subnetwork, convergence to an approximate mean could be expected to occur in each subnetwork independently. Time to consensus would not then be a measure of the effect of subnetwork linkage.
In outlining the dynamics of infection above, we contrasted linked subnetworks of particular structures—ring, small world, random, total, and scale-free—with single networks of the same structure. In exploring the dynamics of belief, we again study these side by side. Figure 5 shows graphs indicating times to belief convergence for each of our network types. Times to consensus with increased linkages between subnetworks of a given type are shown in blue. Times to consensus with increased linkages within single networks of that type are shown in red.
Times to belief convergence in various networks for increasing links between subnetworks (shown in blue) and within single networks of that type (shown in red).

Notice two important features of these graphs: (1) the extreme divergence in rates of belief convergence between linked subnetworks and single networks in each case, and (2) the remarkable similarity of the curves for linked subnetworks in each case. That similarity is emphasized by plotting results for all subnetwork types together in log-log form in figure 6, revealing the classic signature of a power law.
Log-log plots of times to belief consensus with increased linkages between subnetworks.

What these results indicate is that where information is transferred in the manner of memes rather than germs, the dominating effect of increased linkage between subnetworks is independent of the structure of the subnetworks themselves. For meme transmission, unlike infection, the degree of linkage between subnetworks trumps network type. If one wants to trace the course of an epidemic, we noted, it is crucial that one knows the structure of networks involved. To predict, explain, or understand the course of belief transmission, in contrast, it is degree of linkages between subnetworks, of whatever type, that is crucial.
Genes
Genetic information transfer in higher organisms is characterized by crossover in sexual reproduction.Footnote 4 To simulate this form of information transfer, we gave each node a genetic code consisting of a binary string of length 100. Half of the population starts out with a genetic code of all ones, the other with all zeros. In the case of linked subnetworks, each subnetwork begins with a uniform genetic code of either zeros or ones. In the case of single networks, we randomize the two codes in the population.
On each time step of the model, each node pairs off with an unpaired node it is connected to, if there is such a node. Each pair then mates, and two new genetic codes are formed. Each new code is a crossover of the two original nodes’ codes, code from one node to the left of a random crossover point and code from the other node to the right. The two new codes will generally differ because each code is produced with a random crossover point. Codes for the two original nodes are then replaced with the results of crossover but with the same network connections.
As emphasized in the introduction, our minimal models are meant to contain only the elements that are causally and explanatorily basic, and we don’t aim for the models to be perfectly biologically or socially accurate. There are, however, two ways to interpret this model as a model of genetic information transfer. On the first interpretation, the model simulates individual organisms with specific genetic codes mating with those to which they are connected in the network and replaced by their hybridized offspring. One oddity of this way of interpreting the model is that it would have siblings mating sometimes, most notably in the case of ring networks. This oddity is best seen as a consequence of the fact that ring networks are biologically unrealistic. A second interpretation of the model treats each node as a piece of genetic code that is characteristic of a small population of individuals within the larger population. On this interpretation, crossover is interpreted as hybridization of subpopulations, not mating of individual organisms.
In the limit, with connected networks, these models can be expected to converge on a uniform code across the population, which allows us to compare how genetic information moves with how germs and memes move.Footnote 5 We measure convergence in terms of the time it takes until two agents drawn randomly from the population can be expected to differ in less than 20% of their genetic code. For our binary strings of length 100, this measure represents a Hamming distance of less than 20.
Above, for belief transfer, we saw that degree of linkage between subnetworks is the major factor in time to convergence. For infection, the crucial factor is network and subnetwork type rather than degree of linkage. Genetic information transfer exhibits a mixture of these features, but it doesn’t match either of the other patterns in all respects.
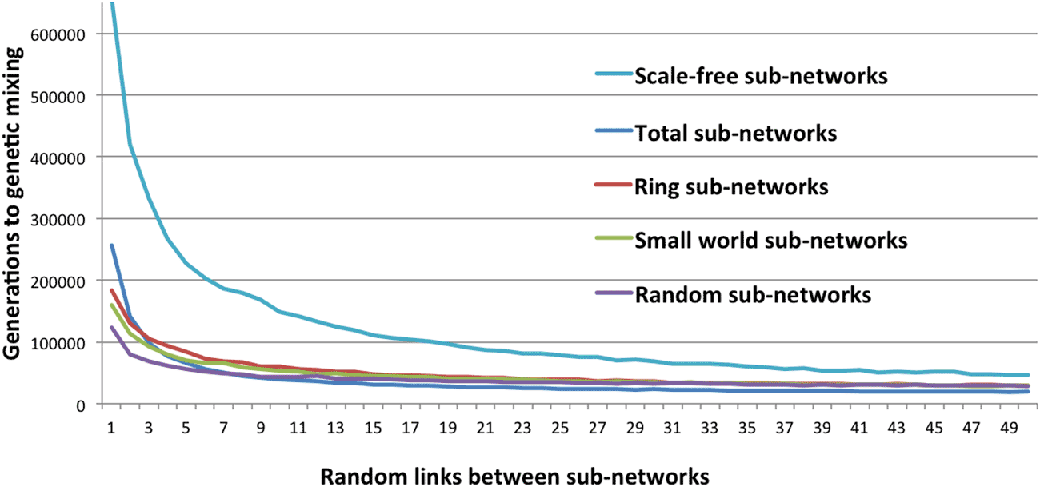
Figure 7 shows genetic dynamics results for linked subnetworks of each of our types. Here, as in the case of belief, network type tends to make very little difference. The data from our scale-free preferential attachment networks are outliers; we remain unsure why. When that case is removed, the proximity of results for increased linkages and regardless of the types of subnetworks linked is even clearer. Those results are shown in a rescaled graph in figure 8 and in log-log form in figure 9. Here, as in the case of memes, we have the signature of a power law, though the slope or scaling exponent is very different. Gene transfer therefore shares some notable features with meme transfer.
Generations to genetic convergence for increased linkages between subnetworks. Lines plotted top to bottom, as specified in key.

Generations to genetic convergence for increased linkages between subnetworks with scale-free preferential attachment networks. Lines plotted top to bottom, as specified in key.

Log-log plot of genetic convergence for increased links between subnetworks.

In the case of memes, however, there is a major difference between results for linked subnetworks and those for single networks of a given type. That difference did not appear in infection dynamics: there, convergence times on linked networks of a given type closely parallel those for single networks with the same number of added links. In this respect, genetic information transfer turns out to be more like infection. Figure 10 shows comparisons for our graph types between added linkages between networks (shown in blue) and within a single network of the same type (shown in red). Total networks stand out, but that is because ‘added’ links in a total network are redundant. In all other cases single networks start with a lower time to convergence, but after just a few added links, the times to convergence for single and linked subnetworks are nearly identical. In this respect genes are more like germs.
Times to genetic convergence for increasing links between subnetworks (shown in blue) and in single networks (shown in red).

Genetic information transfer therefore shows features of both germ and meme dynamics but is clearly different from both. For memes, the primary determinant of time to convergence is the number of links between subnetworks, not the structure of the linked networks themselves. For germ transfer, the pattern is reversed: network type proves far more important than degree of linkage. For genes, increased network connectivity does increase speed to convergence, but neither network type nor degree of linkage plays the dominant role characteristic of germs or memes.
Part 2: Fitness for Germs, Genes, and Memes
Different forms of information transfer act in the service of different ends. Here, again using simulations of linked subnetworks as a primary tool, we take some first steps toward a more rigorous understanding of the comparative fitness of different forms of information transfer toward different ends.
We encode information for asexual and sexual reproduction—germs and genes—as binary strings of length 21. In the previous section, we modeled belief as a real number between 0 and 1. By encoding real values for belief as binary decimals of length 21, however, we have a consistent way of representing information across all three transfer mechanisms.
Our fitness measure will also be the same across the three mechanisms. We use .100000000000000000000 in binary, or .5 in decimal, as our ‘optimal’ code: for germs and genes, this can be thought of as the information that is most strongly selected for in a fixed environment.Footnote 6 In the case of belief, our optimal code might be thought of as proximity to truth or the ability to guide good action. In all cases, we measure fitness by the arithmetic distance between an agent’s code and that arbitrary fitness target.
We use the same range of network types as before, with increased linkages (1) between subnetworks and (2) within single networks of each type. In each case we start with a randomization of information strings across all nodes of the network. What differs is the dynamics of information transfer.
For the asexual reproduction of germs, a node is replaced by that node with the highest fitness to which it is linked in the network. In these early studies we do not include any provision for mutation. For sexual reproduction—genes—the information code of a node is replaced with a crossover at a random point between it and the code of its fittest neighbor, again without mutation. For belief dynamics, the real value of each node is averaged with that of its fittest neighbor.
With a uniform method of representing both information and fitness across the three types of information transfer, we can compare fitness dynamics across different types of networks, whether single or linked subnetworks, and with different degrees of linkage. In each case we measure the number of generations required until the network converges: all nodes have values within .001 of the average fitness of nodes across the network at convergence. At that point we can also measure how ‘fit’ the final convergence is as proximity to the optimal target at convergence. We use 100 runs for each linkage value of each network, deriving both mean and standard deviation across those results.
The first measure of comparison is time to convergence. In this regard the reproduction of germs is clearly the fastest. Updating by meme or belief reinforcement is the second fastest, with genetic crossover a much slower third. Figure 11 offers just one example: relative speed to convergence with additional links added to a single scale-free network. Slower mechanisms, with more generations to fixation, are displayed toward the top. Similar results hold across all networks in our sample. Germs are faster than memes. Memes are faster than genes.
Relative speed to convergence with added links in a single scale-free network, typical of relative speed across all networks. Lines plotted top to bottom, as specified in key.

What of fitness measured as proximity to our optimal code at convergence? Figure 12 shows relative fitness for the three information transfer types, again typical of results for our networks as a whole. The fitter ones, with closer proximity to our optimal value, are displayed toward the top of the graph.
Log-log plot of relative fitness. Lines plotted top to bottom, as specified in key.

The asexual information transfer of germs is the fastest in terms of time to convergence but scores worst in terms of fitness. The reinforcement dynamics of memes or belief prove the best. The fitness of genetic recombination lies in the middle. On this measure, memes prove fitter than genes, and genes prove fitter than germs.
Orderings in terms of speed and fitness clearly differ for our information transfer mechanisms, but those orderings are not simply inverted. The fastest information transfer mechanism is also that with the lowest fitness: the asexual reproduction of memes. But the slowest transfer mechanism is not that with the highest fitness. The slowest is genetic crossover, but it is the belief reinforcement mechanisms of memes that show the highest fitness.
Across a sample of networks, Zollman (Reference Zollman2007, Reference Zollman2010) demonstrates a direct trade-off between speed to convergence and accuracy for networks of agents pooling information about bandit problems. Our work here shows that such a trade-off does not hold across all types of information pooling. Belief transfer proves both faster to convergence and fitter than genetic transfer, for example. This strengthens the lesson from the previous section: to understand the dynamics of information across networks, we must first ask what mechanism of information transfer is under consideration.
There are devils in the details, however, and a more nuanced story is told by the dynamics of different transfer mechanisms on various networks. Figures 13 and 14 show patterns for the asexual reproduction of germs across linked subnetworks of our various types. Speed to convergence varies widely across network type, increasing with increased linkages, without any sharp differences in fitness.
Speed to asexual convergence with added links between all types of subnetworks. Lines plotted top to bottom, as specified in key.

Asexual fitness at convergence with added links between all types of subnetworks. Lines plotted top to bottom, as specified in key.

Figures 15 and 16 show comparative results for memes. Linked total networks are the fastest to convergence, but those networks have a very poor fitness. Fitness for other networks is shown in detail in figure 16. With the exception of scale-free networks, for which results are unclear, meme fitness decays with increased linkages. These results are in accord with related work on epistemic networks (Grim Reference Grim2009; Grim et al. Reference Grim, Reade, Singer, Fisher and Majewicz2010a, Reference Reade, Singer, Fisher and Majewicz2010b). There, too, increased linkage between subnetworks leads to decay in belief-based information transfer.
Speed to belief convergence with added links between all types of subnetworks. Lines plotted top to bottom, as specified in key.

Decay in belief fitness at convergence with added links between all types of subnetworks. Lines plotted top to bottom, as specified in key.

Comparisons regarding speed and fitness for genes are shown in figures 17 and 18. Though significantly slower, genetic information transfer shows a comparable impact of increased linkages and network types to asexual germs. Like germs, but unlike memes, gene fitness also shows relative constancy across added linkages within a network type. Whereas the fitness of germs is essentially random across network types, however, fitness in the case of genetic transfer does appear to be higher for distributed networks such as rings and small worlds, which echoes a characteristic of memes.
Speed to genetic convergence with added links between all types of subnetworks. Lines plotted top to bottom, as specified in key.

Genetic fitness at convergence with added links between all types of subnetworks. Lines plotted top to bottom, as specified in key.

As a whole, our results indicate that information transfer by memes, with the reinforcement characteristic, is an outlier compared to information transfer by either the asexual reproduction of germs or the sexual reproduction of genes. Meme transfer quickly produces convergence and generates highly fit communities. But it comes with a cost—a marked decrease in fitness with increased network linkages that does not appear with either germs or genes.
Conclusion
We started out by asking the question, how does information move on networks? Our work here shows that the question cannot be answered independently of a specification of a particular mechanism of information transfer.
The mechanisms of transfer characteristic of germs, genes, and memes have different dynamics in the case of linked subnetworks and different sensitivities to degree of linkage and network type. This means that to understand information flow on networks, we must fix the transfer mechanism before the effect of the network structure is determined. We have taken some first steps in comparing fitness regarding those three types of information as well. Different methods of information transfer optimize different kinds of fitness, selected for in different environments and measured in terms of different ends.
Our results have both obvious and subtle implications for questions in philosophy. Floridi (2011) takes the dynamics of information to be one of the primary aspects of the philosophy of information. One lesson of our work is that there is no single, unified dynamics of information. The picture is significantly more complex: different types of information move importantly differently on different networks.
Our work bears more subtly on questions in social epistemology and the philosophy of science. When setting up institutions for science, we need to understand how propositional information, funding, and credit move on networks of researchers (Kitcher Reference Kitcher1990, Reference Kitcher1993; Strevens Reference Strevens2003). But the mechanisms of transfer for propositional information, funding, and credit are different. Hence, we should expect that searching for what Zollman calls the “optimal community structure” (Reference Zollman2007, 575) may not be best done by merely testing various network structures. We should first understand how propositional information, funding, and credit are each affected by network structure and then combine the results to uncover the optimal social structure for science. Unlike a brute-force search method, this technique allows us to explain why a particular network structure is optimal in terms of the flows of propositional information, funding, and credit across the network.
Finally, in the philosophy of biology, one approach to understanding evolutionary processes and inheritance posits a kind of biological information that is transmitted between generations (Maynard Smith and Szathmáry Reference Maynard Smith and Szathmáry1995; Maynard Smith Reference Maynard Smith2000). Others suggest that the supposed ‘information’ isn’t really information at all (Griffiths Reference Griffiths2001). Our work can further this discussion and has subtle implications for both sides. We have shown that genetic information transfer does share many formal and dynamic features with memes, a paradigmatic form of information. But in other ways, genetic transfer is also importantly different.
Because of its importance to questions both inside and outside of philosophy, the issue of information flow has received a great deal of attention. Our attempt here has been to work toward a more cohesive and comparative approach, with a particular point for future research. That point is that one should not expect a unified theory of information dynamics written just in terms of network structure and some single notion of information. Information comes in distinct types with distinct mechanisms. Those differences in mechanism affect both the dynamics and the fitness of information across networks.