INTRODUCTION
Marine biodiversity provides unique sets of goods and services to society and generates employment to millions of people involved in fishing, aquaculture and tourism. But these anthropogenic activities often result in overfishing (Hughes et al., Reference Hughes, Rodrigues, Bellwood, Ceccarelli, Hoegh-Guldberg, McCook, Moltschaniwskyj, Pratchett, Steneck and Willis2007), water pollution, extra nutrient input (Szmant, Reference Szmant2002) and sedimentation from terrestrial runoff (De'ath & Fabricus, Reference De'ath and Fabricius2010). The degradation of water quality in reef ecosystems results in a shift from coral (or other alternative taxa) to algal dominated communities (Bellwood et al., Reference Bellwood, Hughes, Folke and Nystrom2004; Knowlton & Jackson, Reference Knowlton and Jackson2008) thereby eroding the native species. Water quality and nutrient overloads play crucial roles in determining the succession of pioneering species to climax communities. There are plenty of studies delineating the impact of water quality parameters and nutrient overload on coral benthic communities (Naim, Reference Naim1993; West & van Woesik, Reference West and Woesik2001; Bellwood et al., Reference Bellwood, Hughes, Folke and Nystrom2004; Loya, Reference Loya and Yossi2004; Knowlton & Jackson, Reference Knowlton and Jackson2008) where algae have become dominant due to nutrient overload or degradation of water quality. However, its effects on the occurrence of other benthic taxa are still poorly understood.
The Saurashtra coastline of Gujarat, a species-rich marine region, has reported marine invertebrates, including cnidarians (Venkararaman & Wafer, Reference Venkataraman and Wafer2005; Vaghela & Bhadja, Reference Vaghela and Bhadja2013). One group of relatively understudied cnidarians are the zoanthids (Zoantharia = Zoanthidea), which are an order of benthic and generally colonial anthozoans that are widespread and occasionally common in many marine ecosystems (Reimer et al., Reference Reimer, Nakachi, Hirose, Hirose and Hashiguchi2010). Zoanthids are widely studied for their bioactive compounds such as pylatoxin and zoanthimine (Moore & Scheuer, Reference Moore and Scheuer1971; Fukuzawa et al., Reference Fukuzawa, Hayashi, Uemua, Nagatsu, Yamada and Ijuin1995). Green Fluorescent Protein (GFP) is also a potential resource from zoanthids (Mythili, Reference Mythili2012). Some of the zooxanthellate genera such as Palythoa and Zoanthus are aggressive benthic competitors (Suchanek & Green, Reference Suchanek and Green1981; Sebens, Reference Sebens1982) in favourable environmental conditions. However, they are taxonomically neglected because of high intraspecific variation in their morphological characters. The present study focuses on the biodiversity of zoanthids of the Saurashtra coast and assesses the effect of abiotic and water quality parameters on their distribution, abundance and community structure.
MATERIAL AND METHODS
Study area
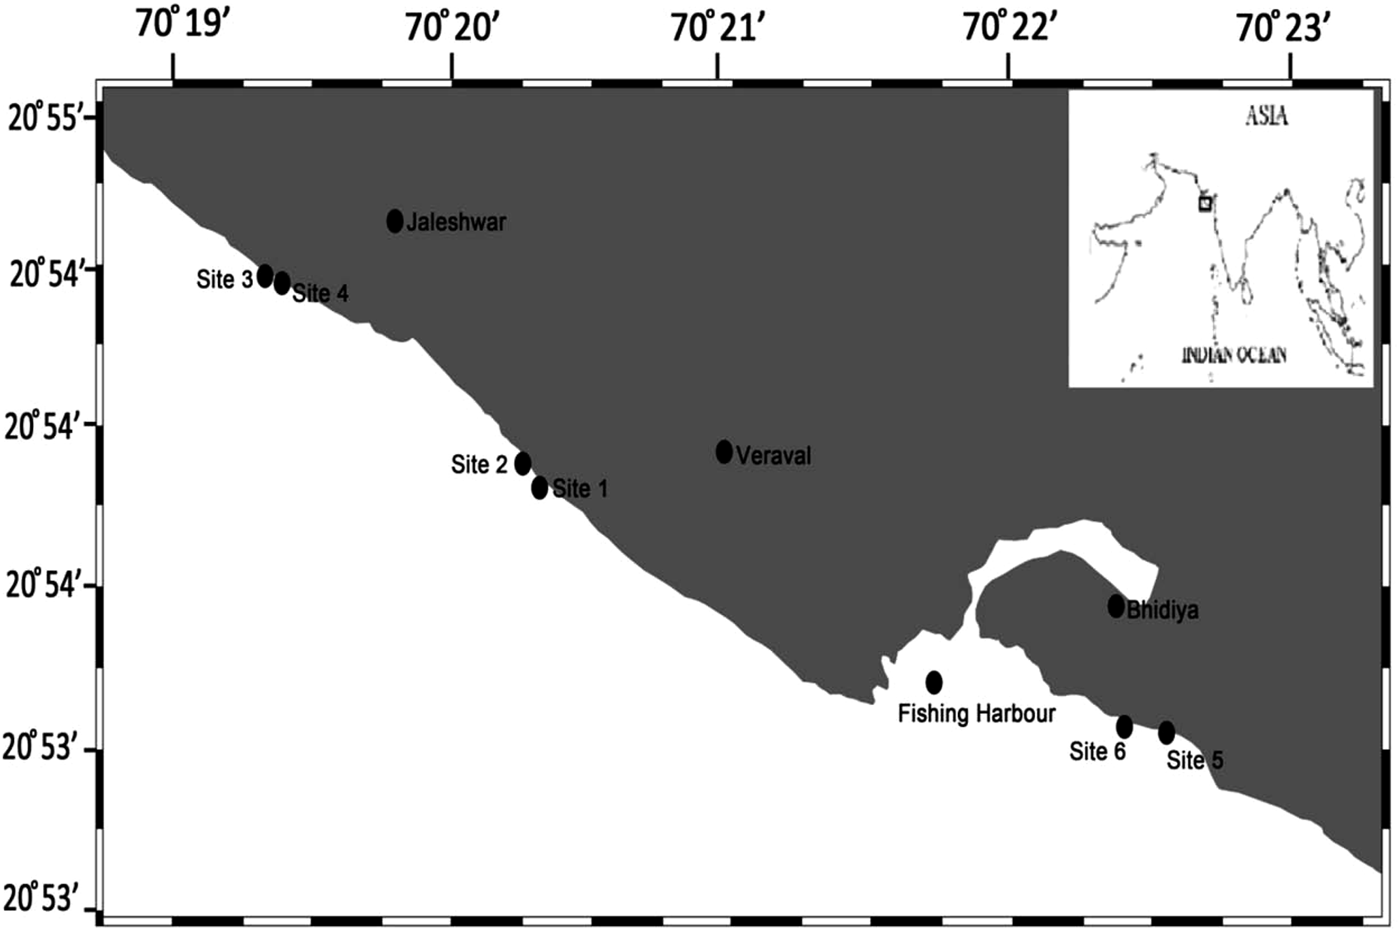
The present study was carried out during September to December 2013 along the 8 km stretch of coastal waters in three villages in Saurashtra (Figure 1), viz. Veraval (20.9°N 70.37°E) (site 1 & 2), Jaleshwar coast (20.91°N 70.33°E) (site 3 & 4) and Bhidiya (20.89°N 70.38°E) (site 5 & 6). All three stations differ significantly in their geomorphology and anthropogenic interference. Veraval intertidal region is rocky with an upper sandy zone that ends in a sharp slope. Jaleshwar is characterized by rocky cliffs and weathered rocks with sharp points. Little human habitation exists near the shore. Bhidiya coast has a rocky intertidal zone which is located at the mouth of Veraval fishing harbour. The shoreline is heavily populated and the coastal waters receive effluents from both domestic households and industries such as fish processing units.
Sampling sites on the map of Gujarat Coast, India.

Field survey
The Line Intercept Transect (LIT) method was adopted to estimate intertidal zoanthid distribution, pattern and abundance. The line was stretched perpendicular to the shore towards the zoanthid colony. All biotic and non-biotic components were observed at every 1 m interval along the transect line (Belford & Phillip, Reference Belford and Phillip2011). The intertidal zones were divided into five regions to represent the distance from the maximum tide imprint left on the shore during low tide. Zones 1, 2, 3, 4 and 5 were designated based on the depths 0–10, 11–20, 21–30, 31–40 and 41–50 m respectively from the shore line (Belford & Phillip, Reference Belford and Phillip2012). Maximum zoanthid abundance was found in zones 3, 4 and 5. Hence, these zones were selected for a horizontal LIT survey (English et al., Reference English, Baker, Wilkinson, English, Wilkinson and Baker1997). Six horizontal LITs with three replicates each spaced at 5 m were done using a 50 m long fibreglass tape stretched parallel to the coast. The fraction of the length of the line intercepted by zoanthids was recorded. This measure of cover expressed as percentage is considered to be an unbiased estimate of the proportion of the total area covered by zoanthids. The intercepts of all underlying zoanthid species, rock, sand, algae and others (anemones, clams and other molluscs) were recorded to the nearest cm. Digital photographs of zoanthids were taken with a Canon D10 camera and video-graphs of LIT using Sony CybershotRX100. Identification of zoanthids was based on taxonomic characters following Reimer et al. (Reference Reimer, Nakachi, Hirose, Hirose and Hashiguchi2010); Häussermann (Reference Häussermann2004). Data for environmental parameters such as sea surface temperature (SST), salinity, dissolved oxygen (DO), pH, total suspended solids (TSS), phosphate (PO4), nitrate (NO2) and ammonia (NH3) were also recorded during the course of sampling. SST was recorded using a centigrade thermometer, salinity and pH values were estimated using WTW multi-parameter kit, DO was estimated by Winkler's method and estimation of ammonia (phenol hypochlorite method), phosphate and nitrate (APHA-AWWA, 1998) was done using a ‘Spectroscan UV 2600, Thermo Scientific’ spectrophotometer. Geographic position of each transect was fixed using ‘GARMIN Model Oregone 6’ GPS. Statistical analysis was performed using Primer 6 (Carr, Reference Carr1996) and SPSS v.19.
Community analysis
The relative abundance (RA), which is an index of commonness or rarity, of each zoanthid species was calculated (Rilov & Benayahu, Reference Rilov and Benayahu1998) as:
 $${\rm Relative}\;{\rm abundance}\;\left( {RA} \right)\displaystyle{{{P_i}} \over {{P_{{\rm total}}}}} \times 100$$
Where, P i is the pooled living coverage of the ith species from all transects at a given site and P total is the pooled total living coverage of all species in all transects at a given site.
The resulting values were transformed into abundance categories (%) as not recorded (RA = 0), rare (0 < RA < 0.1), uncommon (RA = 0.1–1), common (RA = 1–10), abundant (RA = 10–20) and dominant (RA > 20) (Sukumaran & George, Reference Sukumaran and George2010).
Univariate analysis
Based on zoanthid coverage of each individual species during the transects, various diversity indices including Shannon–Weiner diversity index(H’e), Simpson's diversity index(1-Lambda), Margalef's richness index (d) and Pielou's evenness index (J′) were calculated.
Graphical descriptors
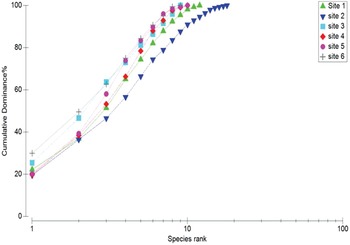
K-dominance curves were constructed in order to find the dominant species at each site and its contribution to the total live coverage. The starting point of curve and its inclination is indicative of the diversity of the site i.e. more elevated curves which start high have lower diversity and vice versa. Hence, K dominance curves help in assessing and comparing sites qualitatively.
Multivariate analysis
A SIMPER analysis to determine the most important taxa responsible for causing dissimilarity (or similarity) was performed using PRIMER. The density data of the species was transformed to ln (x + 1) values, in order to reduce the effect caused by extremes, thus allowing the rare species to exert some influence on the results while reducing the impact of most common taxa. Species falling above a 40% similarity threshold were considered to be those most important in determining community structure.
Statistical analysis
In order to find the correlation between different abiotic parameters, nutrient level and zoanthid abundance, two-tailed Pearson correlation was performed using SPSS v. 19. The data were subjected to pre-treatment by transformation to ln (x + 1) values in order to avoid the effects of outliers and to establish a linear relationship between the variables. The density of all the zoanthid species was correlated with abiotic parameters such as SST, pH, salinity, DO, NH3, PO4, TSS and NO3.
RESULTS
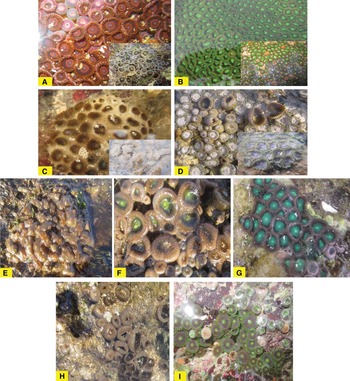
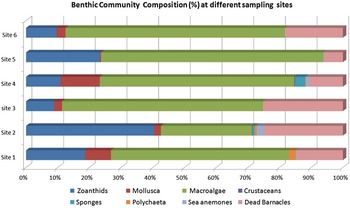
A total of seven species of zoanthid, namely Zoanthus sansibaricus (Figure 2A, B), Palythoa tuberculosa (Figure 2C), Zoanthus vietnamensis (Figure 2D), Isuarus tuberculatus (Figure 2E) Palythoa mutuki (Figure 2F, H), Zoanthus cf. sansibaricus (Figure 2G) and Zoanthus sp. (Figure 2I), belonging to two families, Sphenopidae and Zoanthidae were recorded. Morphotype of Z. sansibaricus were observed during the course of study, one with an orange (Figure 2A) and the other with a green oral disk (Figure 2B). Palythoa mutuki was also recorded in two variants, one with a green (Figure 2F) and the other with a brown oral disk (Figure 2H). Macrolagae, such as Ulva sp., Caulerpa sp., Enteromorpha sp., Gracilaria sp., calcified algae etc., were forming one of the major taxa across all the sites. Other benthic organisms that were observed in different zones were molluscs such as Onchidium verruculatum, Aplysia sp., Turbo sp., Patella sp., Chiton sp., sea anemones, Nereis sp., crabs and barnacles (Figure 3).
Brachycnemic zoanthid diversity along the stretch of Saurashtra Coast from Gujarat. (A) Zoanthus sansibaricus, orange form, open and closed polyps; (B) Zoanthus sansibaricus, green form, open and closed polyps; (C) Palythoa tuberculosa, open and closed polyps; (D) Zoanthus vietnamensis, open and close polyp; (E) Isaurus tuberculatus; (F) Palythoa mutuki, green form (G) Zoanthus cf. sansibaricus; (H) Palythoa mutuki, brown form; (I) Zoanthus sp.

Benthic community composition at different sampling site.

Community analysis
Relative abundance analysis showed that Veraval coast (sites 1 and 2) is rich in zoanthid biodiversity. All the species of the zoanthids found, namely P. mutuki, Z. vietnamensis, Z. sansibaricus, Zoanthus cf. sansibaricus, Zoanthus sp., I. tuberculatus and P. tuberculosa were recorded from the Veraval coast out of which P. mutukiwas found to be the most dominant species. Jaleshwar (sites 3 and 4) showed presence of four species with dominance of P. mutuki and Z. sansibaricus, while patches of Z. vietnamensis and Zoanthus cf. sansibaricus were also recorded. Three species of zoanthids were observed at Bhidiya (sites 5 and 6) with Z. sansibaricus the dominant species (Table 1). Overall dominance of a single species was lacking in the present study, as variations were observed in the number of species and their composition at all the survey sites. Palythoa mutuki with overall relative abundance of 45.99% is classified in the ‘dominant’ category, followed by Z. sansibaricus, which showed a relative abundance of 33.67% and also placed in the ‘dominant’ category. Zoanthus sansibaricus showed a patchy distribution with complete absence at sites 1 and 4 (Table 1). The relative abundance of other spp., viz. Z. vietnamensis, Zoanthus sp. and I. tuberculatus was less than 1%. Therefore, these species were categorised as ‘uncommon’. Isuarus tuberculatus was observed only at Veraval coast along with Zoanthus vietnamensis and Zoanthus sp.
Relative abundance of zoanthids at different sampling sites.

Univariate analysis
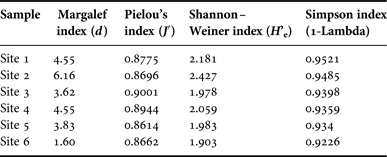
Margaleff richness index (d), which weights number of species rather than individuals, ranges from 2.5 to 3.5 for any healthy environment (Khan et al., Reference Khan, Murugesan and Lyla2004). Margaleff index (d), varied from 1.6 to 6.16 during the course of sampling representing the stressed condition at site 6 and favourable condition at site 2 for the growth of the zoanthid colony (Table 2). Pielou's evenness index (J′), measures the evenness of a habitat and ranges from 0–1 (Turkmen & Kazanci, Reference Turkmen and Kazanci2010). A low value for J′ indicates less evenness in spatial distribution pattern and as the values approach 1, it indicates that the individuals are distributed equally (Pielou, Reference Pielou1966). Least values for Pielou's evenness index (J′) were observed at sites 5 and 6 which show variant distribution of zoanthids at Bhidiya coast. Nevertheless, Veraval and Jaleshwar showed higher J′ values indicating relatively even distribution patterns of different zoanthid species. The Shannon–Weiner index (H’e) which takes into account the number of individuals as well as the number of taxa varies from 0.0–5.0 (Turkmen & Kazanci, Reference Turkmen and Kazanci2010). Results are generally found in the range of 1.5–3.5; values above 3.0 are considered to represent stable environmental conditions, whereas values under 1.0 indicate that there is pollution and degradation of the habitat structure (Turkmen & Kazanci, Reference Turkmen and Kazanci2010). In our case, the highest value of H’e was found at site 2 followed by sites 1 and 4, depicting balanced environmental conditions at Veraval and Jaleshwar coast. Simpson diversity index (1-Lambda) measures the evenness of the community and varies from 0–1 (Turkmen & Kazanci, Reference Turkmen and Kazanci2010). In the present study, the maximum value for Simpson index was estimated at site 1 followed by site 2, whereas the lowest value was estimated at site 6, thereby indicating an even distribution pattern of species at Veraval coast and an irregular pattern at Bhidiya coast (Table 2). With its low value starting point and gentle slope, the K-dominance curve confirms more diversity at site 2 followed by site 1 and least diversity at site 6 thereby corroborating the above results (Figure 4).
K dominance curve of the selected sampling sites.

Biodiversity indices along different sites.

Multivariate analysis
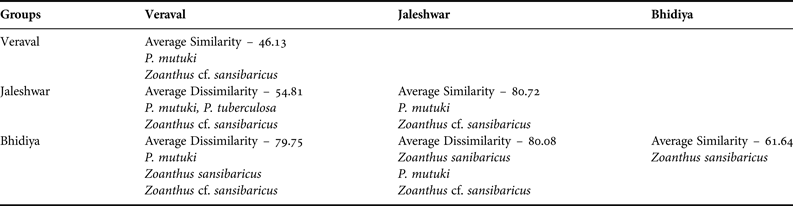
Results of SIMPER analysis (Table 3) show that presence of P. mutuki and Zoanthus cf. sansibaricus resulted in within-group similarity at Veraval (sites 1 and 2). The average similarity in species composition at Veraval was 46.13%. In a similar manner, P. mutuki and Zoanthus cf. sansibaricus observed at Jaleshwar coast (sites 3 and 4) resulted in within coast similarity, with an average similarity index of 80.72% in species composition. Zoanthus sansibaricus was found to be most responsible for Bhidiya (sites 5 and 6) showing within-group similarities with an index value of 61.64%. The highest and lowest average dissimilarity index was observed between Jaleshwar vs. Bhidiya (80.08%) and Veraval vs. Jaleshwar coast (54.81%) respectively. Palythoa tuberculosa was found abundant in Veraval and Bhidiya, but absent in Jaleshwar, which made it the most important species accounting for the dissimilarity among zoanthids distributed along the Saurashtra coast.
Results of SIMPER analysis showing the most important taxa responsible for similarity and dissimilarity between each coast.

Statistical analysis
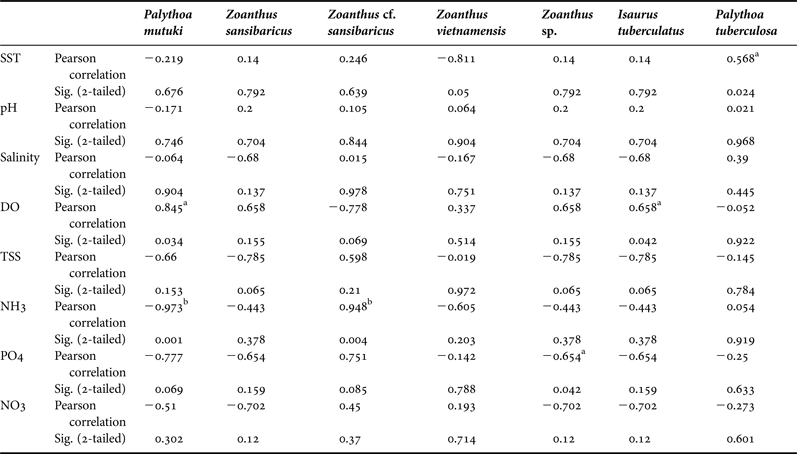
Correlations between different zoanthid species and abiotic factors are shown in Table 4. The results indicate significant positive correlation between SST and Palythoa tuberculosa with r = 0.568 (P value < 0.05). Effect of dissolved oxygen can be seen on species such as Palythoa mutuki and Isaurus tuberculatus. Pearson correlation analysis shows a significant positive correlation between DO and P. mutuki (r = 0.845, P < 0.05), and a positive correlation of r = 0.658 (P < 0.05,) between DO and I. tuberculatus (Table 4). Among the nutrients, NH3 was found to be significantly correlated with Zoanthus cf. sansibaricus (r = 0.948, P < 0.01) however negative correlation of r = −0.973 (P value < 0.01) was observed with Palythoa mutuki. Phosphate (PO4) was also found to be negatively correlated with Zoanthus sp. (r = −0.654, P < 0.05). No significant effects of salinity, pH, TSS and NO3 were recorded for different species of zoanthids (Table 4).
Correlation between abiotic parameter and zoanthids.

a Correlation is significant at the 0.05 level (2-tailed).
b Correlation is significant at the 0.01 level (2-tailed).
DISCUSSION
Relative abundance patterns of zoanthids from three coastal villages (Veraval, Bhidiya and Jaleshwar) were studied. A total of seven species of zoanthids were recorded and variations were observed between the dominant species of zoanthid at each site. This could be due to the difference in geomorphology and water quality parameters at selected sites resulting in different distribution patterns of zoanthids. Environmental factors such as temperature, dissolved oxygen, salinity and nutrient levels played a crucial role in determining the diversity and survival of zoanthids. In the present study, high values of Margalef index, Pielou's evenness index and Shannon–Weiner index were obtained at Veraval, indicating a favourable environment for zoanthid growth whereas low values of d′, J′ and H’e represent stressed conditions at Bhidiya. The reason for the high species richness and even distribution patterns at sites 1 and 2 could be due to less pollution at Veraval.
Analysis of water quality parameters revealed high DO at Veraval (5.94 mg L−1) and low DO at Bhidiya (3.27 mg L−1). This supports the Pearson correlation estimation, where a significant positive correlation (P = 0.034) was observed between DO and P. mutuki followed by DO and I. tuberculatus (P = 0.042). Both these species were abundant at Veraval but scarce at Bhidiya, thus emphasizing the need for pollution-free waters with high oxygen levels required for zoanthid growth. Huang et al. (Reference Huang, Hsieh, Huang, Meng, Chen, Keshavmurthy, Nozawa and Chen2011) also reported significant positive correlation between zoanthid growth and elevated DO levels.
Sea surface temperature is crucial in determining the concentration of dissolved gases in the sea. Impact of SST on zooxanthellae is responsible for bleaching events affecting zooxanthellae in corals, hydrocorals and zoanthids (Fitt et al., Reference Fitt, Spero, Halas, White and Porter1993; Saxby et al., Reference Saxby, Dennison and Hoegh-Guldberg2003; Costa et al., Reference Costa, Sassi and Amaral2005; Kemp et al., Reference Kemp, Cook, Lajeunesse and Brook2006). Reimer et al. (Reference Reimer, Shusuke, Yasuo and Junzo2007) have studied the seasonal variation of zoxanthellae and reported a positive correlation between Symbiodinium zoxanthellae and cold ocean temperatures (<18°C), while a negative correlation has been recorded between Symbiodinium and high ocean temperatures (>28°C). However, in the present case, SST was found to be positively correlated with P. tuberculosa (r = 0.568, P < 0.05) similar to the results of Costa et al. (Reference Costa, Sassi, Gorlach-Lira, Lajeunesse and Fitt2013),where significantly higher densities of zooxanthellae were recorded in Zoanthus sociatus with elevated levels of SST. The reason for higher levels of zooxanthellae densities with elevated SST may be due to the influence of other factors regulating their concentration. However, such observations showed negative effects of elevated SST on zooxanthellae densities in Palythoa caribaeorum only. Therefore, it can be concluded that different species of zoanthids are impacted differently by temperature. Some zoxanthellae species such as P. tuberculatus and Zoanthus sociatus are capable of tolerating increases in temperature while species such as P. caribaeorum are negatively affected. Neither salinity nor pH was significantly correlated with any zoanthid species in our case unlike the results of Yang et al. (Reference Yang, Bourgeois, Ashworth and Reimer2013) where higher correlation has been reported between salinity and P. tuberculosa with a conclusion of salinity acting as limiting factor in P. tuberculosa growth. Apart from the abiotic factors, the nutrient concentration also affects the benthic distribution pattern. Huang et al. (Reference Huang, Hsieh, Huang, Meng, Chen, Keshavmurthy, Nozawa and Chen2011), in a study has concluded growth of zoanthid colonies is favoured by nutrient enrichment and increased organic matter concentration. Similar results have been reported by Costa et al. (Reference Costa, Nimmo and Attrill2008) where abundance of Palythoa was noticed from the areas with extra nutrient input. In the present study high levels of NH3 and PO4 (3.49 and 0.708 mg L−1) were recorded at Bhidiya and Jaleshwar (0.964, 0.595 mg L−1). A significant positive correlation has been observed between Zoanthus cf. sansibaricus and NH3 (r = 0.948, P < 0.01), while a negative relationship was recorded between P. mutuki and NH3 (r = −0.973, P < 0.01). A negative correlation of −0.654 (P < 0.05) was also found between Zoanthus sp. and PO4, contrary to the results of Hernández-Delgado et al. (Reference Hernandez Delgado, Sandoz, Bonkosky, Ramirez and Mattei2008) which reported dominance of zoanthid colonies under hypertrophic, faecal-polluted conditions. The reason for low zoanthid growth despite hypertrophic nutrient conditions could be due to the competition given by extensive growth of macroalgae at both these sites, similar to the studies of Emanuelle et al. (Reference Emanuelle, de Marcelo, Luis and Matthews-Cascon2015), where a negative correlation has been obtained between macroalgae and zoanthids. Such negative correlations between algal cover and zoanthids suggest that algae compete for space and probably inhibit the growth of zoanthids. The high nutrient level at Bhidiya could be due to the effluents from polluted water coming from the nearby fishing harbour, fish processing plant, ice plant and other fish processing factories. This is the most polluted site among all the sampled sites resulting in less biodiversity as estimated from biodiversity indices and K dominance curve. Hypertrophic conditions at Jaleshwar were due to discharge of effluents from nearby factories involved in viscose filament yarn manufacturing. In the present study, positive correlations between SST and P. tuberculosa, and a positive correlation between P. mutuki as well as I. tuberculatus with DO, indicate the effect of abiotic factors on zoanthids. A positive correlation of NH3 with Zoanthus cf. sansibaricus and negative correlation of P. mutuki with NH3 and negative correlation of PO4 with Zoanthus sp. indicate the effect of nutrient concentrations on zoanthid colonies. Hence it could be inferred that zoanthid distribution pattern varies greatly with abiotic parameters such as SST and DO and nutrient level condition of the habitat. Species such as P. mutuki and I. tuberculatus prefer certain dissolved oxygen levels for their growth and are not capable of growing in hyperoxic conditions. The elevated levels of SST can be tolerated by species such as P. tuberculosa while high levels of NH3 can be tolerated by Zoanthus cf. sansibaricus.
The above results in the context of a changing climate indicate that the community structure of zoanthids might be dominated by species which can withstand high SST and high nutrient levels. The study indicates the adaptive capacity of zooxanthellae to environmental changes, which similar species such as corals are lacking. Further, it has been reported that coral reefs will continue to suffer due to high nutrient inputs, bleaching and other anthropogenic activities, leading to shifts in reef patterns towards more aggressive and rapidly growing benthic communities such as zoanthids (Yang et al., Reference Yang, Bourgeois, Ashworth and Reimer2013). However, the present findings are concerned only with seven species of zoanthids in a particular geographic region. The study calls upon widespread sampling from different locations along with estimation of water quality parameters to further understanding of the interaction of benthic communities with their environments and how they evolve under rapidly changing environmental conditions affected by anthropogenic activities.
ACKNOWLEDGEMENTS
The authors are greatly thankful to Professor J.D. Reimer, for providing help in identification of zoanthids. The authors would like to acknowledge Dr A. Gopalakrishnan, Director, Central Marine Fisheries Research Institute for his support and encouragement.
FINANCIAL SUPPORT
The work has been undertaken as a part of Doctorate degree under the scheme ‘National Initiative on Climate Resilient Agriculture (NICRA)’, funded by the Indian Council of Agricultural Research and carried out at Central Marine Fisheries Research Institute