1. Introduction
Solid waste is increasingly recognized as a serious worldwide environmental concern. Anecdotal evidence documents that a collapse of a waste site killed 69 people in Shenzhen, one of the most advanced cities in China, in 2015 (Yang et al., Reference Yang, Huang, Thompson and Flower2016). Municipal solid waste (MSW) directly causes negative externalities to both health and the environment. Residential exposure to the waste site is well-established to be significantly associated with asthma, tuberculosis, diabetes and depression (Tomita et al., Reference Tomita, Cuadros, Burns, Tanser and Slotow2020). The combustion and landfill of MSW lead to air pollution (Muller et al., Reference Muller, Mendelsohn and Nordhaus2011) and water pollution (Yu et al., Reference Yu, Sui, Lyu, Zhao, Liu, Cai, Yu and Barcelo2020), respectively. MSW also causes marine pollution and even flows into our food chain (Jambeck et al., Reference Jambeck, Geyer, Wilcox, Siegler, Perryman, Andrady, Narayan and Law2015).
To reduce the negative impact of MSW, the widely recognized 3Rs principle calls on the public to reduce, reuse and recycle, which emphasizes reducing the impact of waste at the source. It suggests the crucial role of consumption patterns in determining the generation of MSW. However, probably owing to the difficulty of identification, the causal effect of consumption pattern changes on the reduction of MSW generation has not undergone a thorough evaluation. Accordingly, we fill the gap in this study.
This paper approaches this issue by examining the effect of the COVID-19 lockdown, a sound natural experiment that changes the patterns of consumption, on MSW generations. In particular, the outbreak of the COVID-19 pandemic and the lockdown policy implemented to control the disease has had a profound influence on the world's economy. Recent literature has documented its impact.Footnote 1 As an endless activity of urban metabolism, the generation, discarding, and disposal of MSWFootnote 2 should have been largely influenced. Surprisingly, studies have scarcely examined the effect of the COVID-19 lockdown on MSW.
In this article, we quantify the reduction of MSW generation by eliminating the types of consumption that create a large amount of waste, such as takeaway, express delivery, and over-packaging. With unique data from the discarding records of 252 communities in Beijing, we conduct a difference-in-differences (DiD) model following Abrams (Reference Abrams2021). The daily total MSW decreased by 134.16 kg in a community, which is equivalent to at least 0.22 kg per household per day, and the average weight of MSW per package decreased by 56.8 per cent.
One concern of estimating the COVID-19 lockdown impact in China is that the Lunar New Year (January 25, 2020) was very close to the beginning of the lockdown (January 23, 2020), which may bias our estimation. Thus, we further conduct a DiD model based on the lunar calendar to address this issue, and the results suggest that the decrease in MSW remains significant after excluding the New Year effect. We also conduct an event study analysis. All the results verify the robustness of our findings.
Some analyses of the scientific literature show that the impact of the COVID-19 lockdown on MSW is ambiguous. Fan et al. (Reference Fan, Jiang, Hemzal and Klemeš2021) find that the household waste amount decreased by about 23 per cent in Shanghai, while waste increased by 1 per cent in Brno, Czech Republic, and increased by 3 per cent in Singapore. Leal Filho et al. (Reference Leal Filho, Voronova, Kloga, Paço, Minhas, Lange Salvia, Dias Ferreira and Sivapalan2021) conducted a survey in several countriesFootnote 3 other than China and find that plastic packaging waste increased by 53 per cent due to the increase in takeout due to travel restrictions. Therefore, it is necessary to discuss the reasons and mechanisms behind the reduction of MSW during the lockdown in China.
We explore the underlying mechanism of the MSW decrease. We first consider the ways that the reduction effect could arise from hoarding behavior and shifts of discarding time. The lockdown restricted mobility, prohibited public gatherings, shut down schools and workplaces, and also caused panic. We suppose that the generation of MSW has not decreased but only that the households have changed their discarding frequency. The detailed records allow us to rule out the hypothesis and we present evidence that hoarding behavior is unlikely to explain our results. In particular, the MSW weight of each discard significantly decreased after the lockdown, which is the opposite of the hoarding effect. The decreasing effect of MSW is robust even when we control the information on local and national COVID cases in our model and the outbreak of local COVID cases has an insignificant effect on MSW discarding, which indicates that ‘the fear of going out effect’ could not explain our findings. Furthermore, we find that both the total weight of MSW and the average weight of MSW per package do not return to the previous level after the lockdown policy is lifted. This finding suggests that the households do not shift the discarding time but reduce the generation of MSW in the long run.
We next investigate the reduction of the generation of MSW as consumption is restricted. We conduct a placebo test of the restriction of offline activities based on the second round of the COVID-19 outbreak and the corresponding control policy in Beijing. The Chinese government has taken prompt measures, such as school closing and restrictions on public gatherings to control the new round of epidemic. Differently from the first lockdown, the epidemic prevention measures in June did not strictly prohibit commercial activities. We conduct an event study analysis and find that MSW did not significantly decrease in June. This result suggests that the shutdown of consumption after the lockdown reduced the generation of MSW. Compared to the well-documented increase in MSW induced by epidemic prevention policies in countries other than China (Fan et al., Reference Fan, Jiang, Hemzal and Klemeš2021; Leal Filho et al., Reference Leal Filho, Voronova, Kloga, Paço, Minhas, Lange Salvia, Dias Ferreira and Sivapalan2021), we emphasize that the strict restriction of consumption, such as food take out and express delivery, significantly reduced the generation of MSW in China.
Our finding contributes to the emerging literature estimating the impact of the COVID-19 lockdown. Fang et al. (Reference Fang, Wang and Yang2020) evaluate the effect of the lockdown policy and the spread of the COVID-19 pandemic in China. In the field of environmental economics, several existing studies examine the effect of lockdown policy on the improvement of air pollution (He et al., Reference He, Pan and Tanaka2020; Liu et al., Reference Liu, Kong and Kong2020; Dang and Trinh, Reference Dang and Trinh2021). Our paper supplements the examination of environmental effects of the lockdown. Considering that the generation of MSW comes from consumption which has been widely halted during the lockdown, estimating the reduction of MSW is intuitive.
The current study also fills the void in the literature about MSW. Valente and Bueno (Reference Valente and Bueno2019) evaluate the effect of the Unit Pricing System on the reduction of household generation in Italy. Ek and Miliute-Plepiene (Reference Ek and Miliute-Plepiene2018) find that the Swedish food collection policy has had a positive spillover effect and has promoted the reduction of packaging waste. Akbulut-Yuksel and Boulatoff (Reference Akbulut-Yuksel and Boulatoff2021) explore the effect of the green nudge policy on households' recycling and MSW from a behavioral perspective. Taylor (Reference Taylor2020) evaluates the time cost of bag policy to reduce MSW. All these studies are evaluating the cost and benefits of policy objectives to reduce waste. Our work is different from theirs in terms of utilizing the natural experiment of the COVID-19 lockdown to estimate the reduction of MSW. We are the first study to provide evidence of the effect of consumption pattern change induced by exogenous shock on the reduction of MSW generation.
Our finding also offers clear implications for waste management and the post-pandemic world. In early 2018, the government of China banned the import of several types of waste, which has largely affected the recycling industries worldwide, as China has been the largest importer of waste plastics (Brooks et al., Reference Brooks, Wang and Jambeck2018). China itself produces a lot of waste. Zhou et al. (Reference Zhou, Shan, Guan, Liang, Cai, Liu, Xie, Xue, Ma and Yang2020) find that the rapid growth of the express delivery and takeaway market generated 323 kilotons of waste in 2018. Therefore, the study of MSW in China has practical significance for the entire international recycling industry. This paper provides an estimation of MSW generated by ordinary residents in China and estimates the reduction of MSW generation. We also call on the public to reduce unnecessary consumption and put the 3Rs principles into practice, to mitigate the negative welfare impact of MSW at the source.
2. Data and empirical strategy
2.1 Data
The data used in our analysis contain information about MSW discarded every day. We obtained the data from a waste collection company,Footnote 4 which serves 252 communities in Changping, a district in northwest Beijing. The data contain detailed discarding records of these communities from 2019 to 2020, including the weight, time and place of discarding. Since the accumulation of domestic waste in communities would cause great problems, the garbage collection company was still in normal operation during the period of the lockdown. This ensured that we can still obtain data on waste discarded during the lockdown. Owing to service limitations, the company only provides garbage collection services other than organic waste. In other words, our sample only includes refuse and recyclable solid wastes.
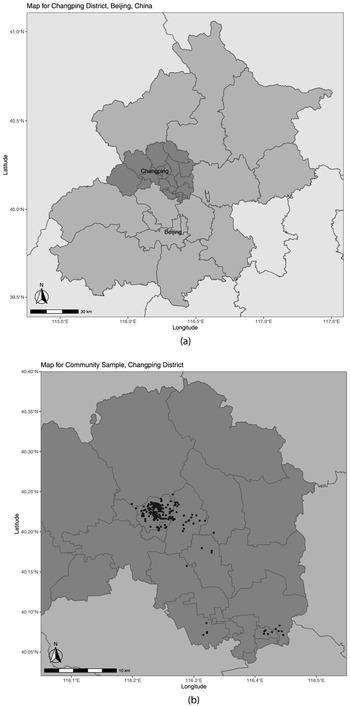
We show the spatial dispersion of our sample communities in figure 1 using the geographical information of the communities. Changping District has a resident population of 2.166 million. Owing to the large areas of mountains and parks in Changping District, our sample communities are relatively concentrated as shown in online appendix figure A1.
Map of Changping District, Beijing, China.
Notes: Panel (a) shows the relative location of Changping District in Beijing. Panel (b) shows the geographical distribution of sample communities.

We subsequently merge the data on municipal waste with the COVID-19 lockdown policy data of China. We refer to He et al. (Reference He, Pan and Tanaka2020) and Dang and Trinh (Reference Dang and Trinh2021) and collect the lockdown information from Oxford University's COVID-19 Government Response Tracker (OxCGRT). On January 23, 2020 China began to take strict measures to control the COVID-19 epidemic, including store closing, suspension of work and schools, stay-at-home requirements, and traffic control to restrict public gatherings and mobility (Hale et al., Reference Hale, Angrist, Cameron-Blake, Hallas, Kira, Majumdar, Petherick, Phillips, Tatlow and Webster2020). Unlike many other countries, China's lockdown was implemented simultaneously. However, food materials purchases and municipal waste disposal services necessary for life were not restricted.
According to the government announcements and news collected by OxCGRT, Beijing implemented a lockdown policy similar to the one in Wuhan and canceled the annual grand event of celebrating the Spring Festival, closed major scenic spots, and advocated that citizens reduce mobility on January 23. In the following two days, Beijing suspended the long-distance bus service. Furthermore, China Railway canceled hundreds of trains in the following week, and Beijing required people traveling from Hubei Province to be isolated. Overall, while the measures in Beijing were not as strict as those in Wuhan, it also implemented similar measures to restrict mobility.Footnote 5 Figure A2 (online appendix) plots the newly confirmed cases and the total number of confirmed cases in Beijing from January to May, which shows that there were a large number of cases in Beijing in January.
We add to this data information about local weather and the characteristic of each community. The weather data were collected from the China Meteorological Data websiteFootnote 6 and contain daily temperature and wind speed.Footnote 7 Temperature is measured in centigrade, and wind speed is measured in meters per second. We manually collected the community characteristics from a real estate transaction website called Lianjia.com (at https://bj.lianjia.com/ershoufang/) to analyze the community heterogeneity. Data were collected on average house price, construction year, the total number of households, and property service information.
2.2 Empirical strategy
Most empirical work estimating the impact of the COVID-19 lockdown is built on Regression Discontinuity Design (RDD), such as that of Dang and Trinh (Reference Dang and Trinh2021) and Takaku and Yokoyama (Reference Takaku and Yokoyama2021). However, China's 2020 Lunar New Year was on January 25, which is very close to the imposition of the COVID-19 lockdown (January 23, 2020) and may thus become a confounding factor affecting MSW generation. Before the Lunar New Year, Chinese families have the custom of cleaning. Even if China had not implemented the lockdown policy, more solid waste before the Lunar New Year would have been anticipated than after. The RDD method directly compares the weight of waste discarded in each community before and after the lockdown, and the results will be biased by the New Year's cleaning customs.
To overcome the bias induced by the Chinese Lunar New Year., we refer to He et al. (Reference He, Pan and Tanaka2020), Fu and Gu (Reference Fu and Gu2017), and Abrams (Reference Abrams2021) and conduct a DiD regression where the comparison group for each community is itself in 2019:

where $MS{W_{cdy}}$ is the weight of MSW thrown away in c community on day d in year y. $\textrm{trea}{\textrm{t}_y}$
 equals 1 if the year is 2020; otherwise equals 0. $\textrm{Afte}{\textrm{r}_{cd}}$
 is 1 on the solar calendar day when the lockdown policy is implemented regardless of year. ${\beta _1}$
 is the parameter of interest. ${X_{dy}}$
 is a vector of observed time-varying control variables, such as temperature and wind speed. Since the severe cold and bad weather may affect people's decision regarding waste discarding at the same time, we added weather conditions to the control variables.Footnote 8 ${\pi _d}$
 and ${\mu _c}$
 respectively denote the weekday and community fixed effects. We estimate equation (1) with a window of one month before and after the lockdown.Footnote 9
Considering the bias induced by the Chinese New Year cleanup custom, we conduct a robustness check by using the corresponding lunar calendar of 2019 as the control group. Specifically, the lockdown day (January 23, 2020) happened two days before the Chinese New Year and corresponds to January 23, 2019, in the solar month. However, in the lunar calendar, the lockdown day corresponds to February 3, 2019, which is also two days before the Lunar New Year in 2019. $\textrm{Afte}{\textrm{r}_{cd}}$ is 1 after February 3 in 2019 and after January 23 in 2020 for regression based on the lunar calendar.
We also conducted an event study of the treatment and control groups to ensure the parallel trend in 2019 and 2020 before lockdown day. The basic event study model is given by

where $MS{W_{cdy}}$ is the weight of MSW, and $\textrm{trea}{\textrm{t}_y}$
 is 1 if the year is 2020. $\textrm{da}{\textrm{y}_j}$
 is a dummy for the day on which time $j\;$
 is before or after the calendar date when the lockdown policy is implemented regardless of year. Similar to equation (1), the event study analysis also includes the weather controls and year, weekday and community fixed effects.
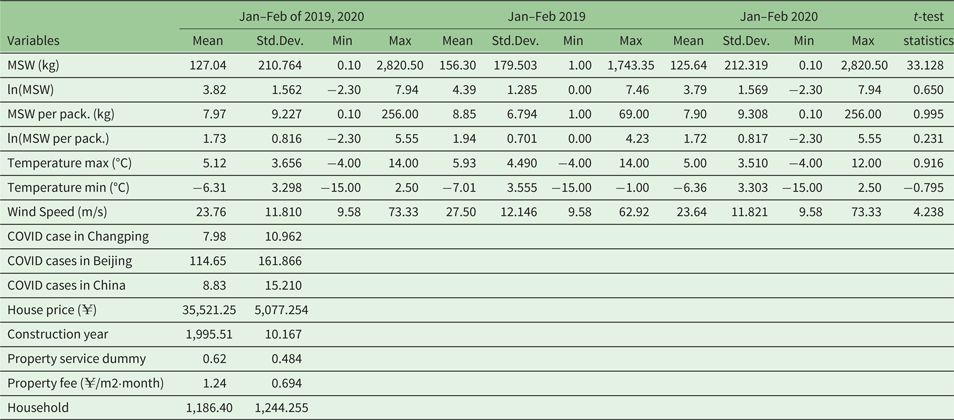
Table 1 reports the summary statistics of all the variables. The average number of households in the sample community is 1,186. The average daily waste weight of each community is 156.3 kg and 125.6 kg during January and February of 2019 and 2020, respectively. One possible reason is that many people in Beijing return to their hometown during the Spring Festival and the waste weight counted in our sample does not include organic waste, the average daily waste weight of each community is relatively small.
Summary statistics

Notes: The t-test statistics in the last column test whether the means of a variable in the 2019 and 2020 periods are equal.
3. Empirical results
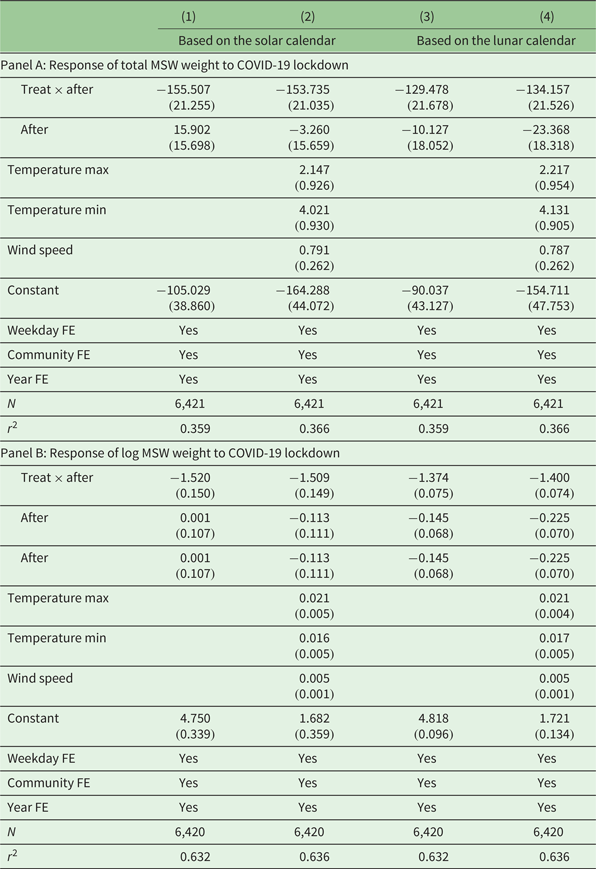
Table 2 reports the results of estimating equation (1). Panel A reports the change in the total daily weight of MSW. Standard errors are clustered at the community level and reported in parentheses. The coefficient of the cross term in column (1) is 155.507 and is significant at the level of 1 per cent, which indicates that the total daily weight of MSW discarding fell rapidly, broadly, and substantially, that is, 155.507 kg for every community overall. Considering that the MSW discarding behavior may be influenced by time-varying variables, we further add weather controls in column (2). The coefficient only increases by 1.772 and remains significant at the level of 1 per cent. The weather control of temperature is positive and significant, which indicates that the warmer the weather, the more people go out to discard waste in winter.
Response of municipal solid waste to COVID-19 lockdown

Notes: This table shows the baseline results of the effects of the COVID-19 lockdown on the weight of municipal solid waste (MSW). Standard errors are clustered at the community level and are reported in parentheses.
As discussed earlier, one concern is that the Chinese Lunar New Year, which is close to the lockdown day, may bias our estimation. The custom of cleanup may increase the MSW discarded before New Year's Day and also before the lockdown day. We investigate whether this scenario is the case by estimating the equation based on the lunar calendar. The coefficient of a cross term is 129.478 and remains significant. We further add weather controls. The coefficient turns to 134.157 and is statistically significant. This finding indicates that the MSW decreased after the Lunar New Year, but the effect of lockdown remains.Footnote 10 To prevent our results from being driven by a small number of outliers, we take the logarithm of the total weight of MSW for the robustness test. Panel B reports the change in log MSW weight. All the coefficients remain significantly negative. Overall, our findings suggest that MSW decreased in response to the COVID-19 lockdown policy.
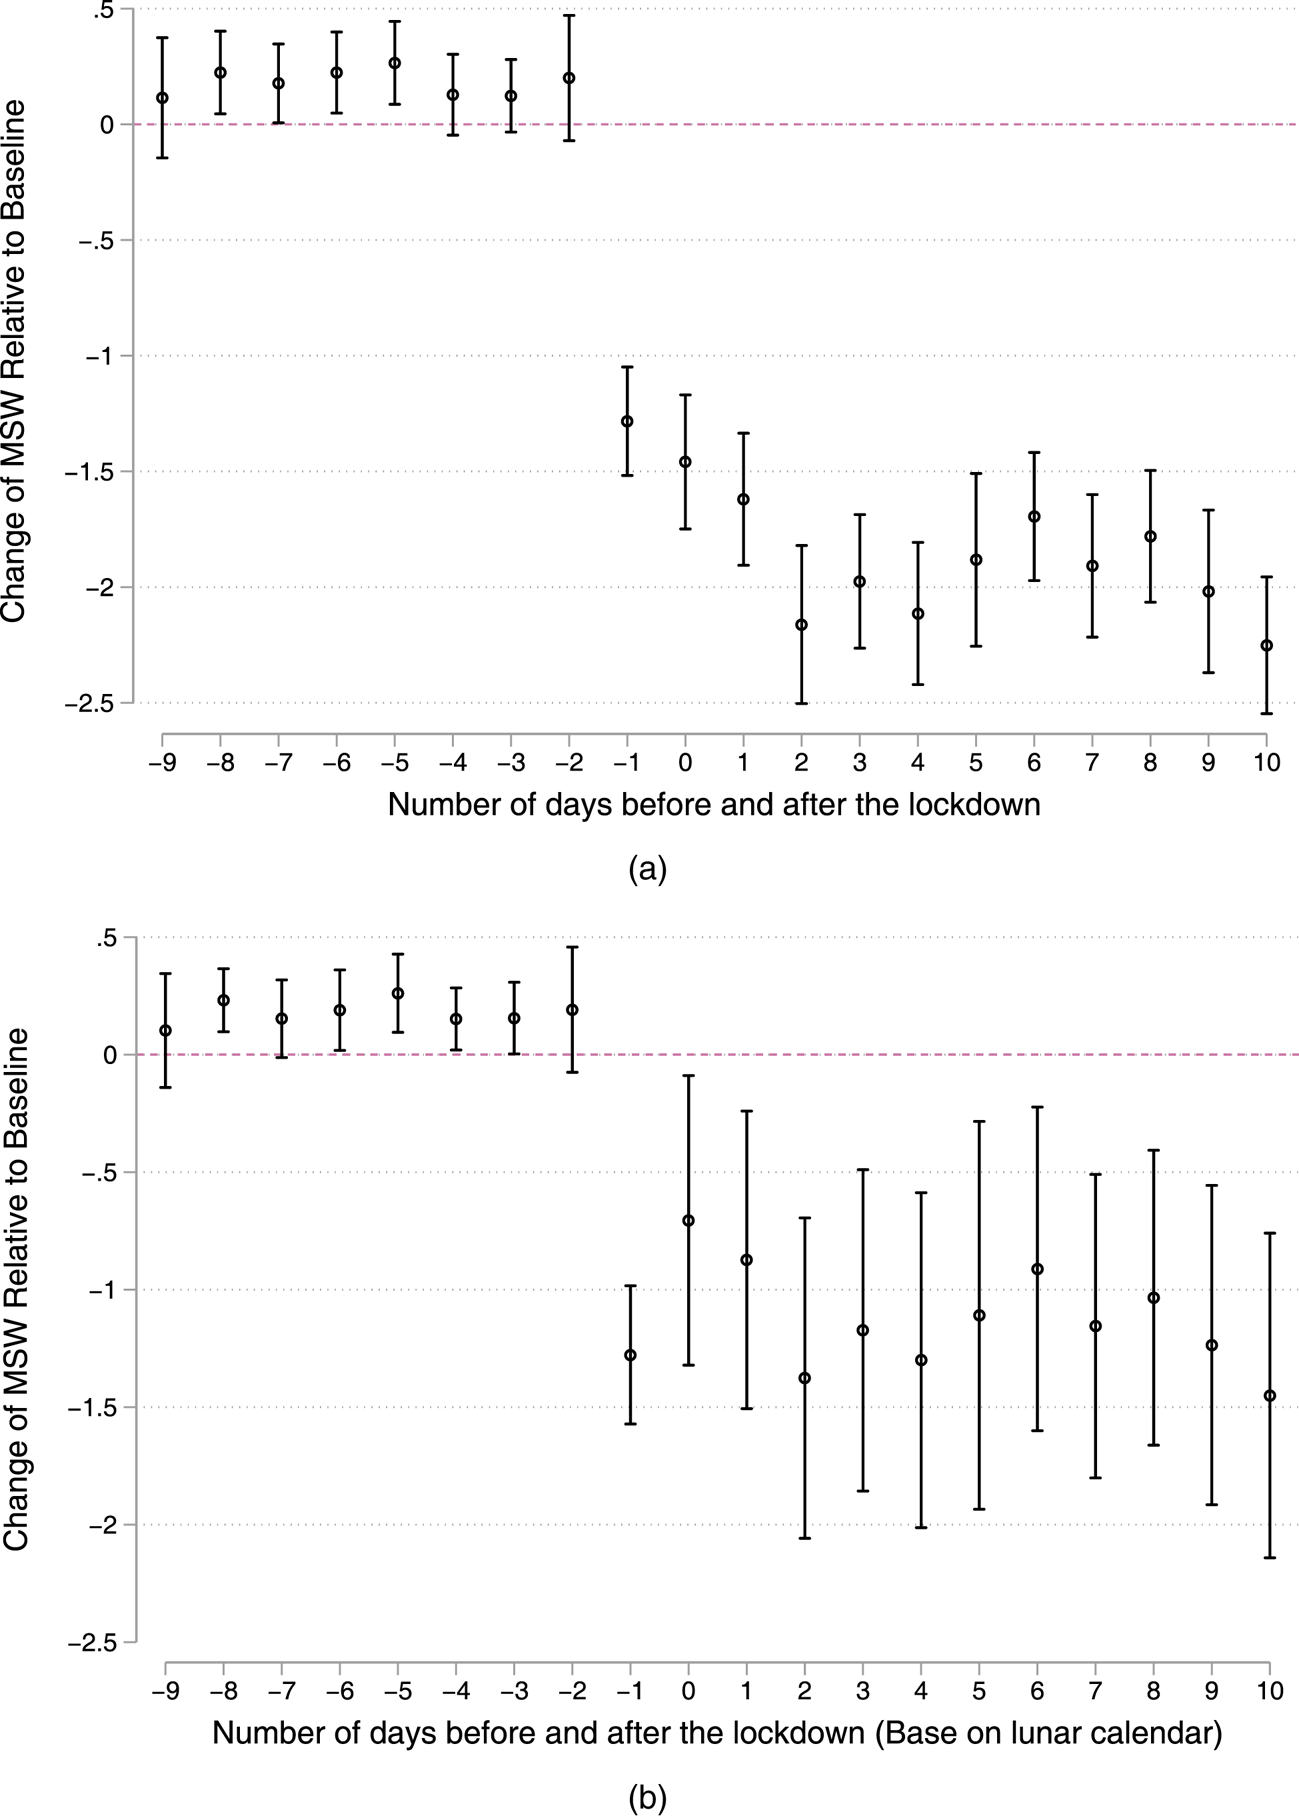
To visually assess the dynamic change in the MSW before and after the lockdown, we estimate an event study specification with a full set of control variables and community and time fixed effects and a series of event time indicators. The event time indicators range from −9 to +10 before and after the lockdown day. We omit the −10 day in the event window to avoid complete collinearity. The reference group is 10 days before the lockdown window.
Figure 2 plots the results. Panel (a) reports the estimation of equation (2) based on the solar calendar, and panel (b) is based on the lunar calendar. Standard errors are clustered at the community level. The results are consistent with our previous finding that MSW is significantly lower after the lockdown date. The coefficients of the pre-event window are about −0.048 to 0.130 but the coefficient for the pre-event window is about −0.601 to −0.849, indicating a sharp decline after the lockdown. The daily MSW weight is relatively stable from 9 days before up to the lockdown. We find that MSW decreased sharply one day before the implementation of the lockdown policy, which is plausible because the announcement of lockdown was reported on the day before the lockdown day. The daily MSW weight remains low for 10 days following the lockdown policy. The direction and magnitude of the results estimated by the event study specification are consistent with those in the DiD model, suggesting that the lockdown policy significantly decreased MSW.
Event study analysis: total MSW weight.
Notes: This figure reports the effects of the COVID-19 lockdown on the total weight of MSW and 95 per cent confidence intervals for the period from 9 days before to 10 days after the lockdown. Panel (a) reports the effect measured by the solar month model and panel (b) reports the results of the lunar month model. All models also include weather controls, community dummy, weekday dummy, and year dummy. The reference group is 10 days prior to the lockdown window. Standard errors are clustered at the community level.

4. Potential mechanism
The lockdown policy to control the outbreak of the COVID-19 pandemic implemented a series of measures, which limited public gatherings, restricted population mobility, and closed offices and schools. We have established the causal relationship between the lockdown policy and MSW. Thus, what is the potential mechanism of the impact on MSW? Does the lockdown policy only reduce the amount of MSW thrown away or does it reduce the amount of MSW generated? We next consider several potential explanations for the lockdown effects that do not reduce the amount of MSW generated.
4.1 Effects of MSW hoarding
One possible explanation for the previous finding is hoarding behavior. The lockdown policy may not directly influence the generation of MSW; instead, people merely hoard garbage at home and reduce the frequency of waste discarding to reduce the risk of COVID-19 exposure.Footnote 11 If this mechanism works, the total amount of MSW generated has not decreased, but the frequency of people throwing garbage has decreased. Our sample communities are all buildings and apartments, implying that people may have to throw away a large amount of garbage every time due to the difficulty of hoarding garbage for a long time in their homes.
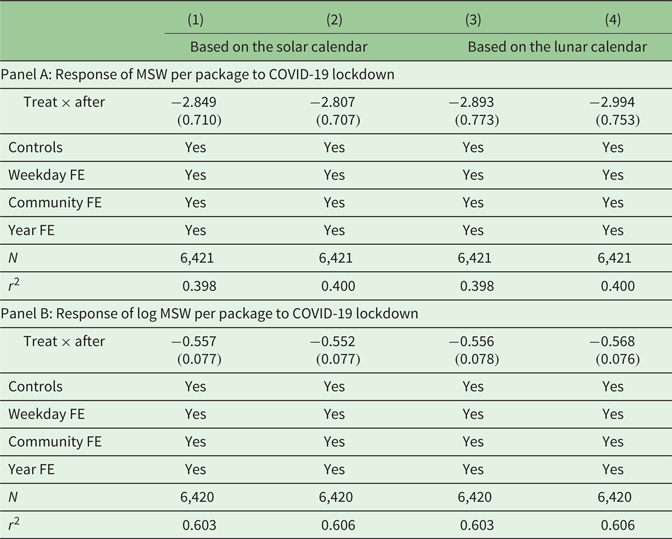
To access the MSW hoarding mechanism, we estimate the effect of lockdown on the average weight of MSW per packageFootnote 12 with equation (1). The weight of each package of waste refers to the weight of the garbage discarded at one time. If there is a hoarding effect, the average weight of each discard will increase. If the amount of waste generation reduces, the weight of waste discarded at one time will reduce. We expect the coefficient of the cross-term to be significantly positive, which suggests people hoarding garbage and a decrease in the frequency of discarding.
Table 3 reports the effect of lockdown on the average weight of MSW per package. The coefficient of the cross term is −2.89 and is statistically significant at the level of 1 per cent. Even when we add the weather controls and change the control group based on the lunar calendar, the results remain robust. We further estimate the effect of log MSW per package and find that the lockdown reduces the average weight of MSW per package by 55.2 per cent. These results are suggestive of the fact that the decrease in MSW after the lockdown occurred not because they hoarded garbage and reduced the frequency of discarding, but because less waste seems to have been generated.
Response of MSW per package to COVID-19 lockdown

Notes: This table shows the effects of the COVID-19 lockdown on the average weight per package of MSW. Standard errors are clustered at the community level and are reported in parentheses.
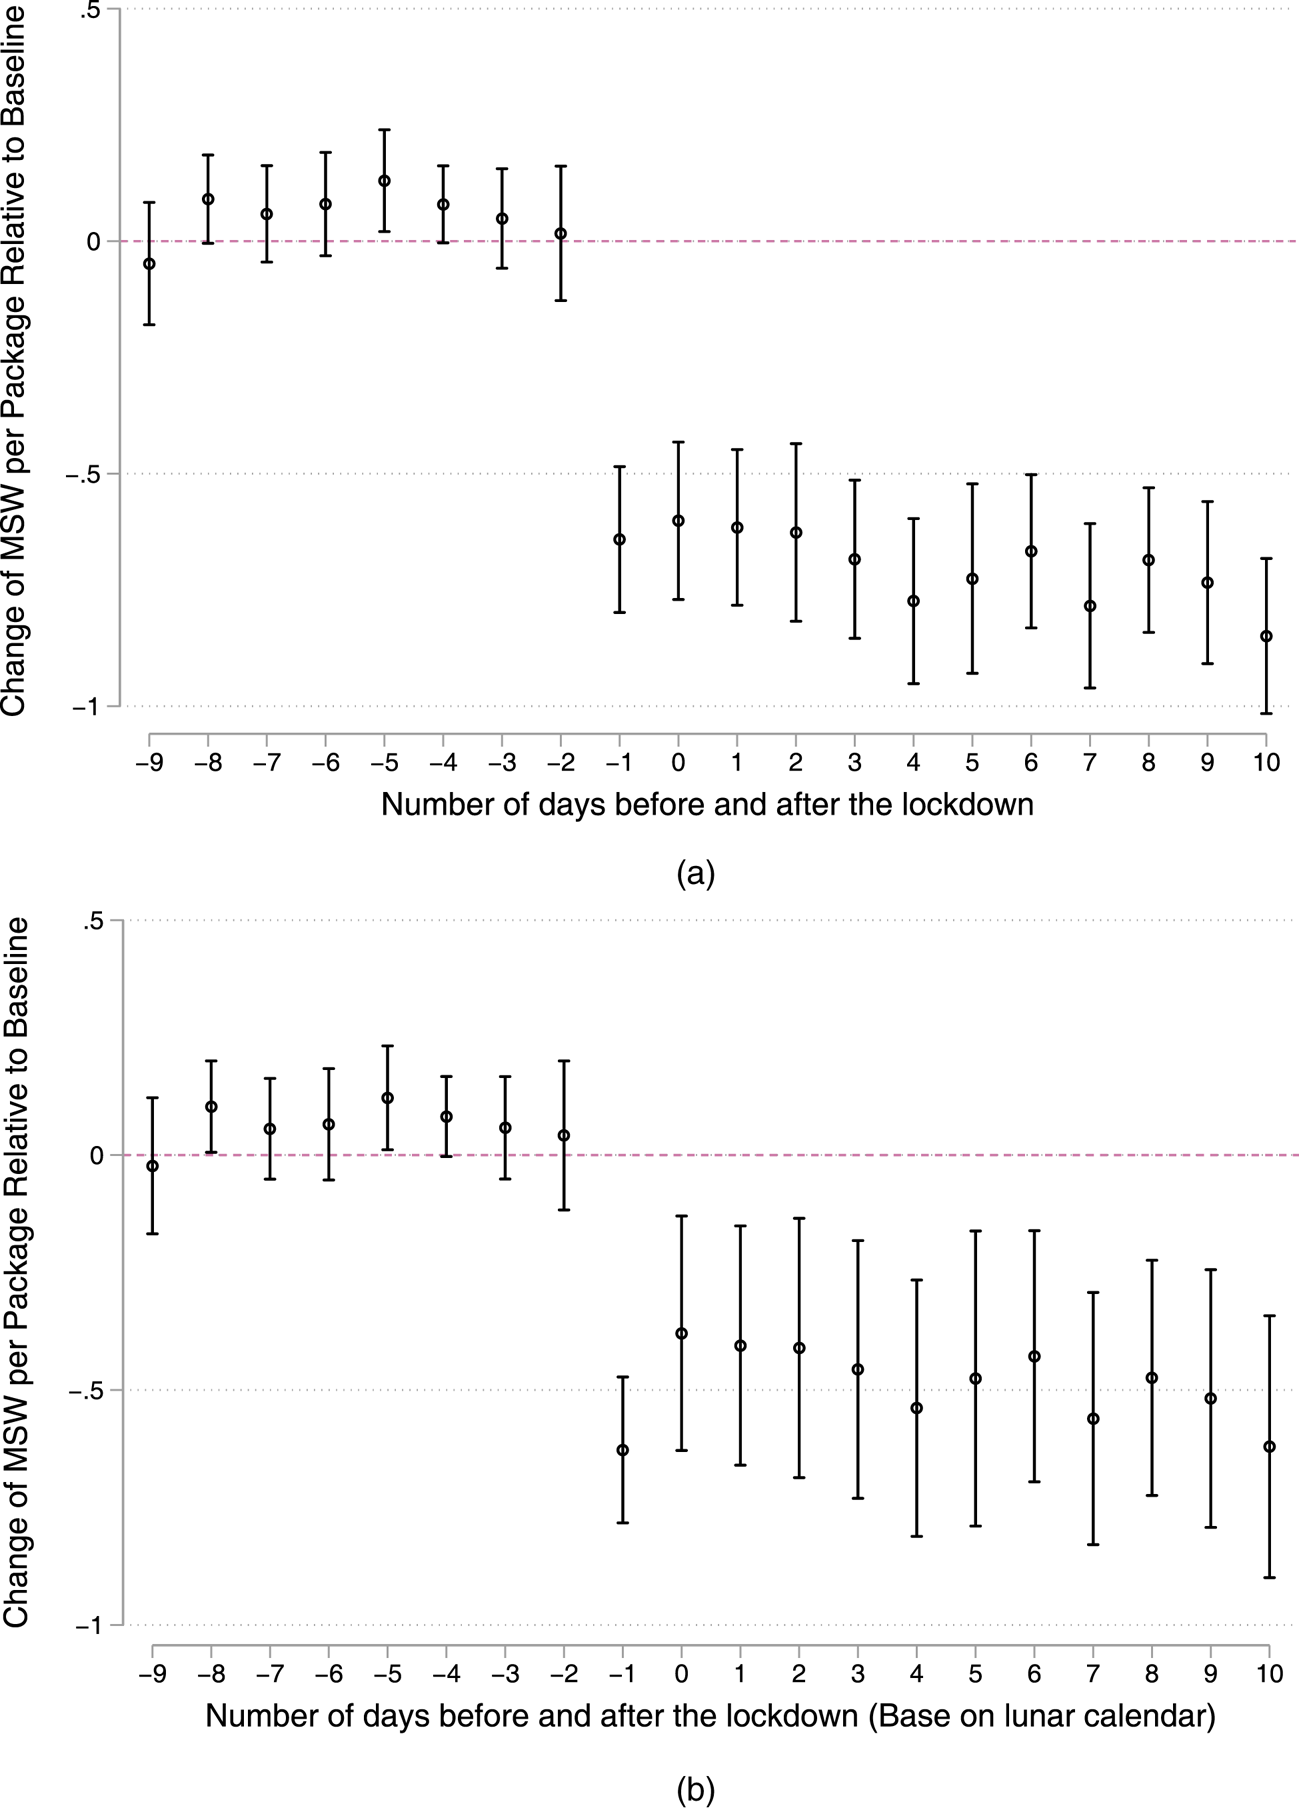
We also conduct a time-event analysis of the average MSW per package. Figure 3 plots the results specifically based on solar and lunar calendars, which confirm the finding with a DiD model. The average MSW per package is significantly lower after the lockdown, which confirms that the hoarding effect could not explain our previous findings. Instead, the significant decrease in the average MSW per package suggests that the generation of MSW decreased after the lockdown.
Event study analysis: average MSW weight per package.
Notes: This figure reports the effects of the COVID-19 lockdown on the average weight of MSW per package and 95 per cent confidence intervals for the period from 9 days before to 10 days after the lockdown. Panel (a) reports the effect measured by the solar month model and panel (b) reports the results of the lunar month model. All models also include weather controls, community dummy, weekday dummy, and year dummy. The reference group is 10 days prior to the lockdown window. Standard errors are clustered at the community level.

4.2 Shifts of discard timing
Another alternative mechanism that would explain our finding is that the household shifted the time of discarding garbage. First, the severity of the virus may have affected the decision-making of discarding. Specifically, households delayed the time of discarding in the short run after obtaining the information on COVID-19 cases. The COVID-19 cases may also endogenously correlate with the lockdown policy and bias our estimation. Second, at the other extreme, households delayed the time of discarding until the lockdown policy was lifted in April. If the long-term shift effect is established, we will see that the amount of MSW after the lifting of the lockdown will exceed the level the day prior to it.
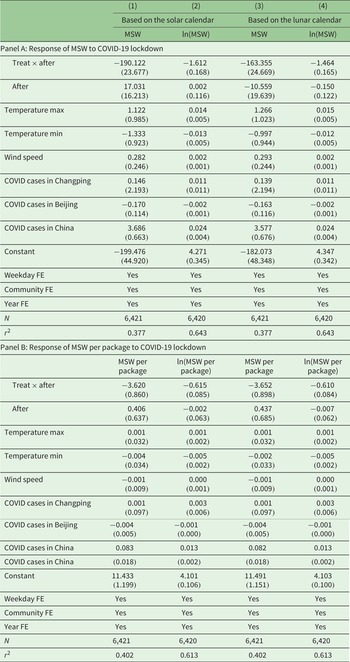
To test the short-term shifts in MSW discarding due to the information effects of COVID-19 cases, we refer to Brodeur et al. (Reference Brodeur, Cook and Wright2021) and include the lag variables of the new cases in Changping District, Beijing, and the entire country in equation (1). Table 3 reports the coefficients of the regression. Panel A reports the change in the total MSW, and panel B reports the effect of the average MSW. All the coefficients of the interaction are significantly negative. The coefficient based on the lunar calendar is −163.355 which is even lower than that in the baseline result (−134.157). This result makes sense, if the information on new cases prevents discarding, then we will see the gap in MSW before and after the lockdown widen when controlling the case information. Thus, our finding of the decrease in MSW is robust and is not driven by short-term shifts (table 4).
Robustness check: MSW response considering COVID cases

Notes: This table shows the robustness check of the effects of the COVID-19 lockdown on the weight of MSW. Standard errors are clustered at the community level and are reported in parentheses.
We next address the extreme situation that households shifted the time of discarding in a relatively long period and discarded all the garbage generated after the end of lockdown. We expect that the MSW will increase to a level higher than that before the lockdown in April. Therefore, we extend the post-lockdown window in the event study specification to 70 days after the lockdown, i.e., to April 2, when the lockdown policy was relaxed. The associated equation is

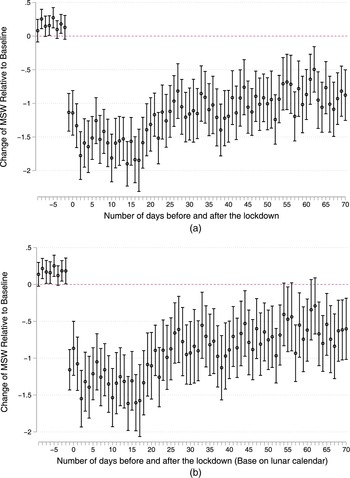
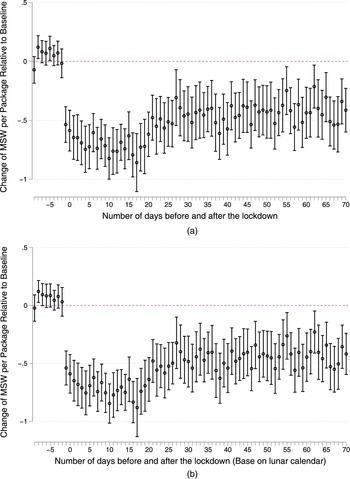
Figures 4 and 5 report the long-run event study analysis of the total MSW and average MSW per package, respectively. Both total MSW and average MSW decreased dramatically at the beginning of the lockdown day and then increased slightly after approximately 20 days. MSW remained relatively stable for nearly 50 days, and the MSW weight after the opening in April did not increase to the level before the lockdown. We refer to the model based on the lunar month, but the result stays robust. These findings refute the hypothesis that households shifted the MSW discarding in the long run. Instead, both the total MSW weight and average MSW weight remain low after 70 days of the lockdown, suggesting that the lockdown decreased the generation of MSW.
Long-term event study analysis: total MSW weight.
Notes: This figure reports the effects of the COVID-19 lockdown on the total weight of MSW and 95 per cent confidence intervals for the period from 9 days before to 70 days after the lockdown. The long-term window ends on April 2, 2020. Panel (a) reports the effect measured by the solar month model and panel (b) reports the results of the lunar month model. All models also include weather controls, community dummy, weekday dummy, and year dummy. The reference group is 10 days prior to the window. Standard errors are clustered at the community level

Long-term event study analysis: average MSW weight per package.
Notes: This figure reports the effects of the COVID-19 lockdown on the average weight of MSW per package and 95 per cent confidence intervals for the period from 9 days before to 70 days after the lockdown. The long-term window ends on April 2. Panel (a) reports the effect measured by the solar month model and panel (b) reports the results of the lunar month model. All models also include weather controls, community dummy, weekday dummy, and year dummy. The reference group is 10 days prior to the window. Standard errors are clustered at the community level.

4.3 Restriction of offline activities
To confirm that the decrease in MSW is the reduction of MSW generation and not the result of not being discarded, we further distinguish the effect of measures taken by the lockdown policy. In China, various measures were implemented, including restricting offline activities (e.g., dining, takeout, express delivery), closing workplaces and schools, and restricting public transportation. Although we could not distinguish the effect of each measure taken in January, the prevention measures to control a new round of the COVID-19 epidemic in Beijing offer an opportunity to test the effect of offline activity restriction.
After 56 consecutive days of zero new cases in Beijing, a new round of localized epidemics broke out at the Xinfadi market in Fengtai District, Beijing on June 12. The number of confirmed cases was 45 on that day, and several consecutive new cases were declared. The Fengtai District in Beijing rapidly took measures to control the epidemic on June 13. As for our sample community in Changping District, activities such as eating out and picking up express delivery were not restricted. However, mobility and public gathering activities were restricted, and schools closed again.
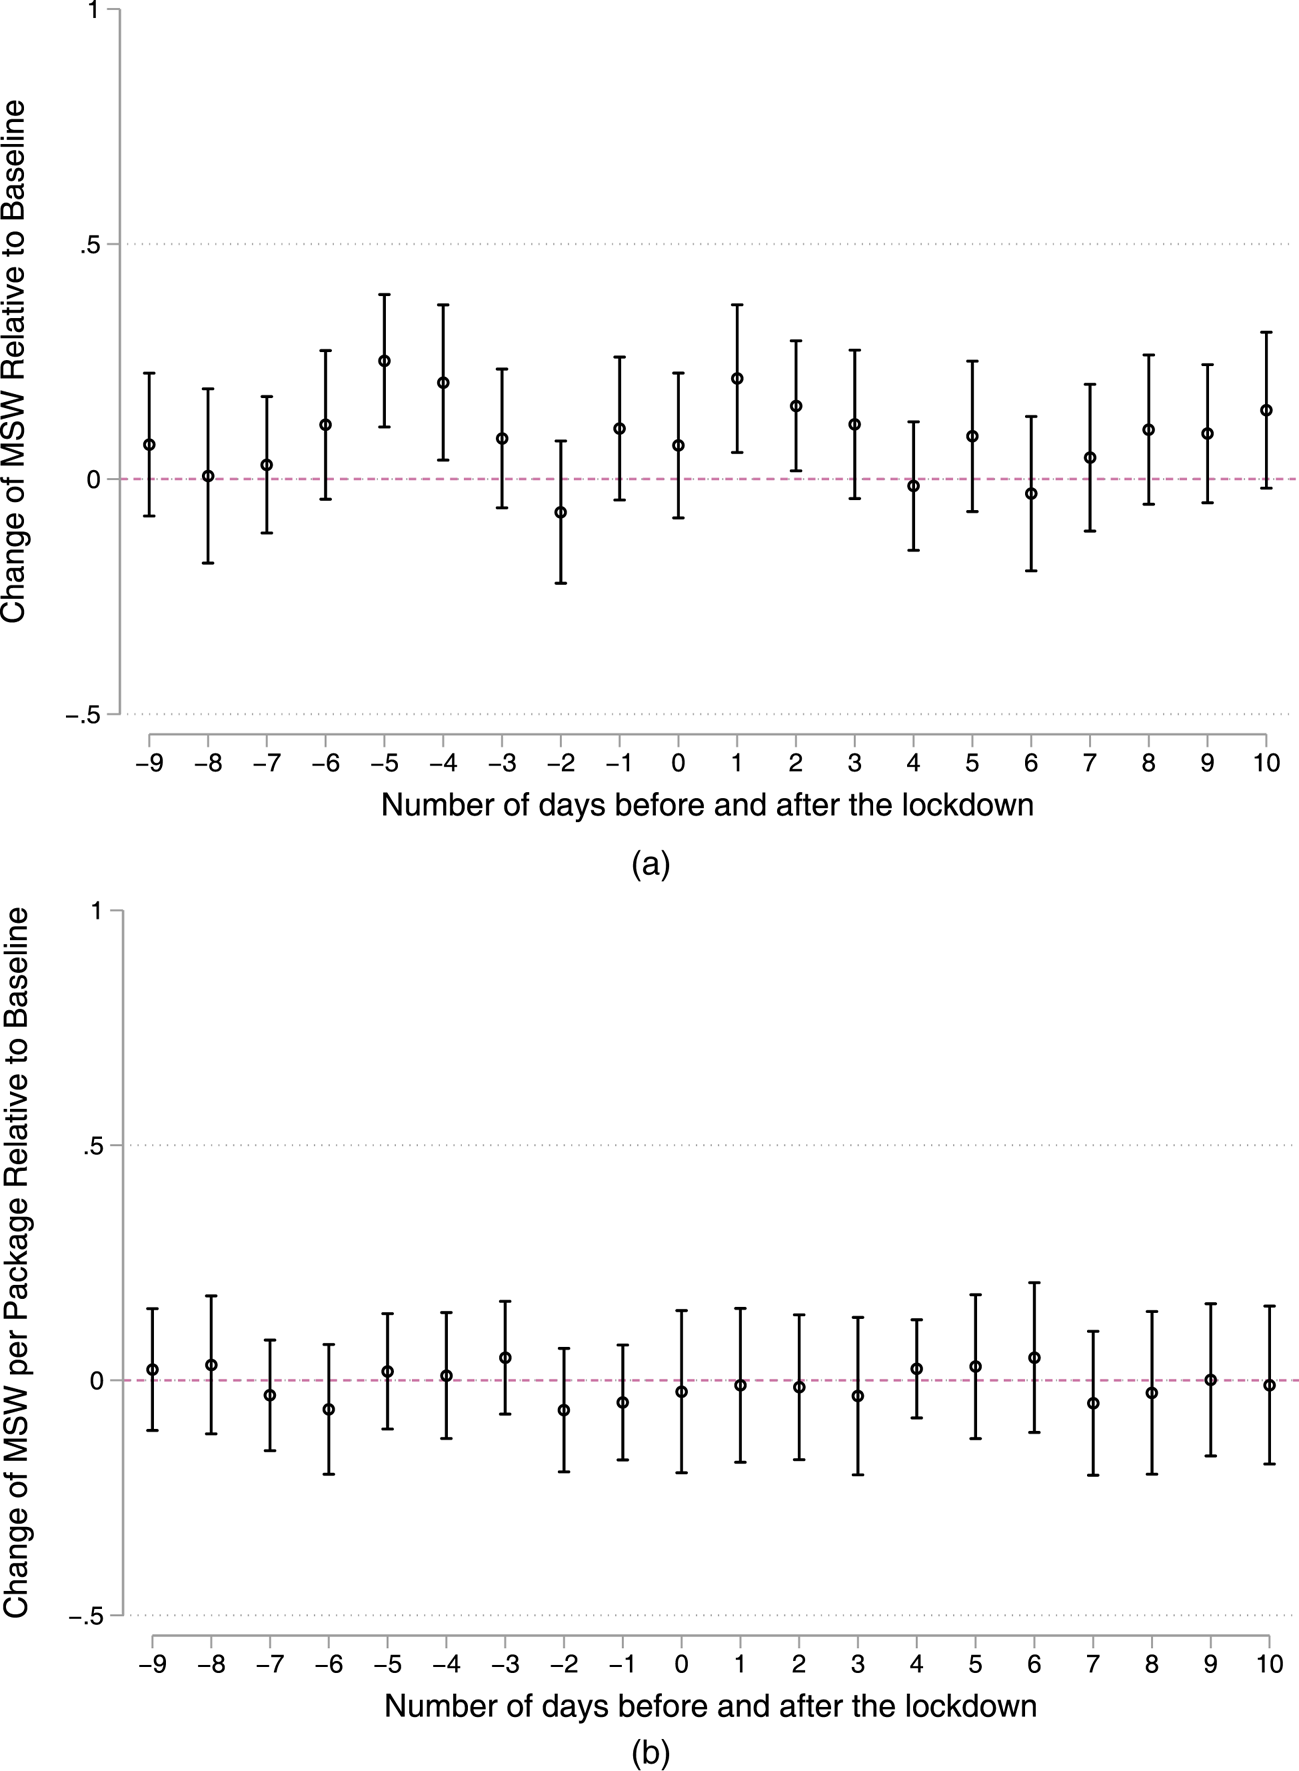
Utilizing this new round of control measures on June 13 as a placebo for the restriction of offline activities, we conduct the event study analysis with equation (2). Figure 6 reports the event study analysis of the placebo lockdown on June 13. We find insignificant decreases in both total MSW and average MSW per package after the new lockdown policy. The main difference between the June 13 lockdown and the first lockdown is that it did not strictly control offline activities, such as shopping, eating and express delivery. The insignificant coefficient in the placebo test indicates that offline activity restriction is the main driving force that reduces MSW. This finding implies that the lockdown changes consumer behavior and thus reduces the generation of MSW.
Placebo event study analysis.
Notes: This figure reports the effects of the placebo epidemic response on the weight of MSW and 95 per cent confidence intervals for the period from 9 days before to 10 days after the COVID-19 cases broke out without lockdown policy in Changping. Panel (a) reports the change in total MSW weight and panel (b) reports the change in average MSW weight per package. All models also include weather controls, community dummy, weekday dummy, and year dummy. The reference group is 10 days prior to the event window. Standard errors are clustered at the community level.

A multi-country survey has documented an increase in MSW in some countries other than China because of increased consumption of packaged food, fresh food, and food delivery during the lockdown (Leal Filho et al., Reference Leal Filho, Voronova, Kloga, Paço, Minhas, Lange Salvia, Dias Ferreira and Sivapalan2021), which is the opposite of our result. However, our empirical results of the second round of lockdown point out that MSW does not decrease if offline consumption activities are not restricted. Unlike most countries, China's lockdown limits almost all consumption, especially food takeout and express delivery. Our findings are in line with the descriptive analysis of Fan et al. (Reference Fan, Jiang, Hemzal and Klemeš2021), which finds a decrease in household waste in Shanghai and an increase in both Brno and Singapore. We provide evidence that the restriction of consumption decreases the amount of MSW at the source.
4.5 Fear of going out
A possible explanation for the decrease in MSW is that people are fearful of going out due to newly confirmed cases. We collect the geographical location and date of the local COVID cases to conduct an event-study analysis, which examines the effect of locally confirmed cases on MSW discarding behavior.

where $MS{W_{cd}}$ is the weight of MSW for community c on day d, which takes logarithmic form. $\textrm{COVI}{\textrm{D}_c}$
 is a dummy variable that takes the value of 1 if the community is within a certain range of the new case. We follow Liu and Tang (Reference Liu and Tang2021) and select the 3 km, 5 km, and 10 km communities near the newly confirmed cases as the treatment group because they have a high exposure risk of infection. The window of interest is 10 days before and after the date of the case report in 2020 and we omit the −10 day, which means that the reference group is 10 days prior to the occurrence of the new case. All the local cases in the Changping District are confirmed after the implementation of the lockdown policy.
Figure A3 in the online appendix reports the effect of confirmed cases. The insignificant change of the coefficients suggests that the newly confirmed local cases have no effect on the discard of MSW. We use various definitions of the high exposure communities and the results are robust. The average MSW per package shows a similar pattern (see figure A3b). This finding shows that the adjustment of discarding behavior because households avoid going out for fear of infection is not the main reason for the reduction of MSW.
4.4 Suspension of work and school
Finally, we simply address the effect of the suspension of work and school that moved people's daily activities from their workplaces and schools to their homes. The concern is that the shift in people's place of daily activity may also shift where they generate and throw away the garbage, which may also affect the changes in MSW after lockdown.
However, we find certain facts that make the effect of shifts in places of daily activities less problematic for our analysis. First, the winter holiday of primary and secondary school students began on January 18 in Beijing, which means that the impact of school suspension on their daily place of activity can be ignored. Second, if the suspension of work shifts the place where people generate and discard garbage, an upward bias of the MSW weight is anticipated after the lockdown. However, we find that the total MSW still significantly decreased after the lockdown. Moreover, the decrease in the average MSW indicates the reduction of MSW generation. Overall, even if we consider the effect of the shift in discarding place, the lockdown still significantly reduced MSW.
5. Further analysis: community characteristics
The preceding section established the causal relationship between lockdown and MSW generation. Next, we examine the heterogeneous effect of the MSW decrease. The lockdown policy reduced the generation of MSW because of stores closing and a reduction in household daily consumption.
At least three main factors affect the reduction effect of MSW, considering that daily consumption, such as express delivery and food takeaway, is the main source of MSW. First, purchasing power affects the reduction of MSW. In the counterfactual situation without a lockdown policy, households with strong purchasing power will consume more. After the implementation of the lockdown, consumption was difficult for all families, thus reducing the generation of MSW. Therefore, households with strong purchasing power reduced MSW more after the lockdown. Second, the commercial supply around the community affects the reduction of MSW. The lockdown policy restricted nearly all commercial activities so that communities with more complete commercial facilities had more supplies shut down. Those communities with more complete commercial facilities reduced MSW more after the lockdown. Third, households may initiate a reduction in consumption behavior to reduce exposure, even reducing food, water and other necessary consumption items.
To examine the above effect, we estimate the regression allowing the heterogeneous effects. Specifically, we interact the cross term with the community characteristics:

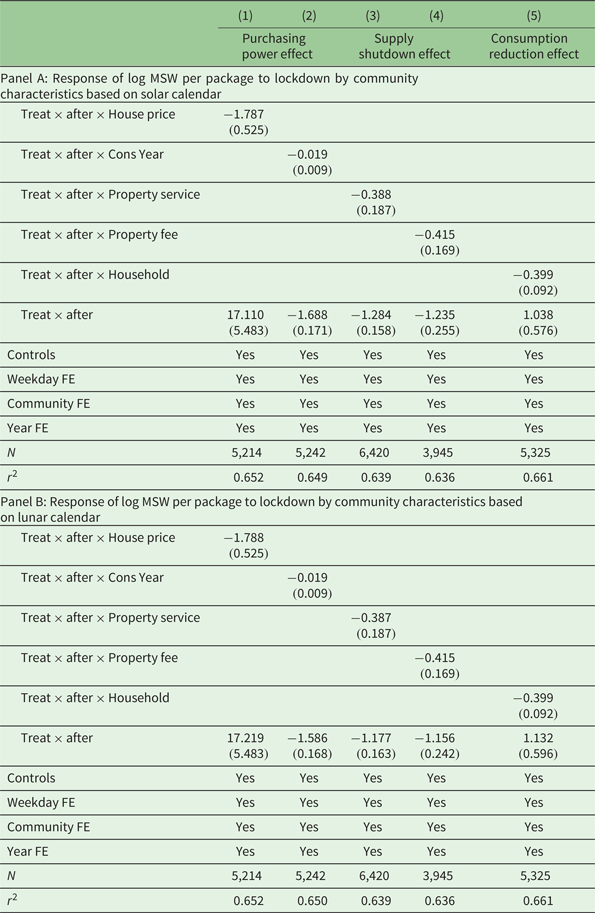
where $\textrm{Cha}{\textrm{r}_c}$ denotes the community characteristics, and all the other variables are defined similarly to equation (1). We take the logarithm of the average weight of MSW per package as the independent variable. Considering that we cannot directly measure household-level characteristics, we use community characteristics to represent family characteristics. Table 5 reports the heterogeneity effect of the MSW generation.
Further analysis: municipal solid waste responses and community characteristics

Notes: This table shows the effects of the COVID-19 lockdown on the average weight per package of MSW and the heterogeneity effects with different community characteristics. Standard errors are clustered at the community level and are reported in parentheses.
First, we use the average house price and the construction year of the house to proxy the purchasing power of the household.Footnote 13 The premise of this method is that the average house price and construction time are positively correlated with the household's purchasing power, which somewhat makes sense. Columns (1) and (2) report the estimation of purchasing power effect. The cross terms of house price and construction year are −1.787 and −0.019, respectively, and are statistically significant. These results indicate that households with high purchasing power will reduce MSW more after the lockdown.
Second, we take the dummy variables of whether the community has property services and the property service fees as proxy variables of the commercial supply.Footnote 14 This choice is reasonable because communities with sophisticated property services tend to have better commercial facilities, thereby anticipating many shops around. Columns (3) and (4) report the result of the cross terms of property service. The coefficients of property service dummy and property service are −0.388 and −0.415, respectively. The significantly negative coefficients suggest that the shutdown of shops around the community contributes to the reduction of MSW after the lockdown day.
Third, we estimate the effect of households actively reducing consumption to reduce disease exposure risk. We interact the cross term with the number of households in the community. Those who live with more neighbors face a higher exposure risk than those with fewer ones. Thus, they are more likely to reduce the opportunities for consumption and discarding. Taking the initiative to reduce consumption can reduce the generation of MSW, thus reducing the average weight of MSW per package. Taking the initiative to reduce the frequency of discarding will lead to the accumulation of garbage and increase the average weight of MSW per package. Column (5) reports the results of the cross term of household number, and the coefficient is −0.399, which is significant at the level of 1 per cent. This finding implies that households reduce their consumption and therefore reduce the generation of MSW.
6. Discussion
We have examined the effect of lockdown on MSW reduction and verified the underlying mechanism and various heterogeneity effects. Based on the previous findings, we discuss some important implications for the policy of MSW. First, our findings highlight the importance of MSW, which has not received considerable attention compared with the strong concerns over air and water pollution. MSW not only has a direct adverse health impact (Tomita et al., Reference Tomita, Cuadros, Burns, Tanser and Slotow2020) but also leads to air (Muller et al., Reference Muller, Mendelsohn and Nordhaus2011) and water pollution (Yu et al., Reference Yu, Sui, Lyu, Zhao, Liu, Cai, Yu and Barcelo2020). Therefore, our study compensates for the cost and benefit assessment of the lockdown policy by emphasizing the decrease in MSW.
Second, while the lockdown policy significantly decreased the generation of MSW, the high economic cost caused by the lockdown makes it hard to be considered as a long-term policy. Although MSW had not returned to the pre-epidemic level within half a year after lockdown, the gradually increasing trend suggests that taking a shutdown as a MSW management policy is unsustainable. A series of measures are being taken to reduce the adverse impact of MSW. From the perspective of end treatment, a series of environmental science research evaluated the environmental impact of MSW landfills and incineration (Assamoi and Lawryshyn, Reference Assamoi and Lawryshyn2012) and offered many engineering solutions. From the perspective of source governance, the 3Rs principles – reduce, reuse and recycle – all help cut down on the amount of waste. Environmental economics has slowly shifted its attention to waste management. Valente and Bueno (Reference Valente and Bueno2019) find that the Unit Pricing System leads to a 37.5 per cent reduction of household generation in Italy. Ek and Miliute-Plepiene (Reference Ek and Miliute-Plepiene2018) identify the positive spillover of household waste activities; they find that the Swedish food collection policy has promoted a 5–10 per cent reduction of packaging waste. Akbulut-Yuksel and Boulatoff (Reference Akbulut-Yuksel and Boulatoff2021) find that the green nudge policy increased households' recycling by 15 per cent and decreased the generation of MSW by 27 per cent. Compared with the above policies, we believe that the method of reducing MSW from the source is not limited to consumption restrictions, but also includes the price policy of internalizing pollution costs and green boost. Although we find that the reduction of MSW caused by the lockdown policy is among the largest (56.8 per cent), our findings provide an estimation of emission reduction potential for the source governance policy.
Third, we thus highlight the importance of source management in MSW governance. The COVID-19 lockdown offers us a natural experiment to test the effects of the change in consumption patterns on MSW. To control the outbreak of the COVID-19 pandemic, the lockdown policy closed nearly all the shops, banning regular daily consumption activities. Current evidence shows that the effect of the COVID-19 lockdown on MSW amount is ambiguous (Fan et al., Reference Fan, Jiang, Hemzal and Klemeš2021; Leal Filho et al., Reference Leal Filho, Voronova, Kloga, Paço, Minhas, Lange Salvia, Dias Ferreira and Sivapalan2021). Our findings suggest that the reduction of MSW in China during the lockdown was mainly driven by consumption restrictions that change people's consumption patterns and reduce the MSW generation. We thus highlight the importance of source management in MSW governance. Reducing the production activities of MSW, such as the use of disposable goods, large use of express delivery, and over-packaging, can help reduce the cost of MSW classification, the cost of landfill and incineration treatment, and the negative externality on both the environment and public health.
Finally, the practical implication of our study is to call on the public to pay full attention to the external cost of MSW they ignored before, while considering the private cost of consumption. We call on the public to reduce unnecessary consumption to reduce the negative welfare impact of MSW.
7. Conclusion
This study provides the first empirical evidence of the effect of the COVID-19 lockdown on MSW. With a unique database of daily records of MSW discarding in Beijing, we identify the causal effect of lockdown and MSW and investigate the underlying mechanism. We find that the COVID-19-induced lockdown significantly decreased MSW. The event study results verified the robustness of our results. We further examine various explanations for the reduction of MSW. Our finding provides suggestive evidence that lockdown not only leads to the reduction of MSW discarding but, more importantly, it reduces the generation of MSW by changing people's consumption patterns. We also document heterogeneous impacts for different community characteristics. Our empirical work contributes to the emerging economic literature that examined the impact of COVID-19 and adds to a small set of studies on MSW. Our findings also have practical implications for calling on MSW reduction at the source and supporting the 3Rs principle.
Supplementary material
The supplementary material for this article can be found at https://doi.org/10.1017/S1355770X22000353
Acknowledgments
We thank Susana Ferreira (the co-editor), the associate editor and two referees, and Shasha Liu, Rui Shen, Jian Zhang, Donghyun Kim, Jianan Lu and seminar participants at the 2nd Edinburgh-Shanghai Climate and Development Virtual Conference, Peking University, and Zhongnan University of Economics and Law for helpful comments. We thank Anqi Liu, Xiaodong Ma and Hengxing Yin for their excellent research assistance. Dongmin Kong acknowledges the financial support of the Major Project of National Social Science Foundation of China (grant no. 71772178). Ling Han acknowledges the financial support of the Project of National Natural Science Foundation of China (grant no. 7191101209). All authors contribute equally to this study. All errors are our own.
Conflict of interest
We, the authors of this paper, declare that: (1) we have no conflict of interest that could have appeared to influence the work reported in this paper, and (2) we have no competing financial interests or personal relationships that could have appeared to influence the work reported in this paper.