INTRODUCTION
The importance of biodiversity and the dangers associated with its decline are frequently emphasized (Cardinale et al. Reference Cardinale, Duffy, Gonzalez, Hooper, Perrings, Venail, Narwani, Mace, Tilman, Wardle, Kinzig, Daily, Loreau, Grace, Larigauderie, Srivastava and Naeem2012; Hooper et al. Reference Hooper, Adair, Cardinale, Byrnes, Hungate, Matulich, Gonzalez, Duffy, Gamfeldt and O'Connor2012), as is the vulnerability of crops associated with the continuous decline of diversity in the field (Esquinas-Alcázar Reference Esquinas-Alcázar2005; Hajjar & Hodgkin Reference Hajjar and Hodgkin2007; Keneni et al. Reference Keneni, Bekele, Imtiaz and Dagne2012). This is in open contrast with the tendency of modern plant breeding towards producing uniform varieties (Ceccarelli et al. Reference Ceccarelli, Galie, Grando and Kole2013). This contradiction appears even more striking when the likely scenario of climate change is considered. Climate change poses an interesting challenge to plant breeders because, contrary to the usual target objectives of a breeding programme, it represents a ‘moving target’ (Ceccarelli et al. Reference Ceccarelli, Galie, Grando and Kole2013). A strategy to cope with such a challenge, which could also maintain and increase agricultural biodiversity, is evolutionary plant breeding.
The idea is not new. In 1929, Harlan and Martini proposed the composite cross (CC) method for breeding barley (Harlan & Martini Reference Harlan and Martini1929). The method relies on bulking the F1 progenies obtained by hybridization of varieties of diverse origin and genetic make-up to generate a heterogeneous population of recombinant genotypes. The population should then be multiplied in the specific environments where locally adapted varieties are needed. The procedure should guarantee that the frequencies of adapted genotypes increase without creating a uniform population. In 1956, Suneson further developed the idea into a formal ‘evolutionary plant-breeding method’ (Suneson Reference Suneson1956). Using this method, Suneson (Reference Suneson1969) registered nine barley CCs meant to be used for generating new varieties as parental populations (PPs) and material for the study of population genetics (Suneson Reference Suneson1956). The success of such a breeding method depends upon recombination and segregation, and the extent to which survival over many generations in mass-propagated populations is positively correlated with agricultural value (Allard & Hansche Reference Allard and Hansche1964). Composite cross-derived populations (CCPs) can be useful as a dynamic reservoir of genetic diversity and especially of locally adapted diversity in an exploitable form, experimental materials for studying effects of natural selection on heterogeneous populations and as a source of locally adapted new varieties (for a review see Allard Reference Allard1988).
Recently, Morran et al. (Reference Morran, Parmenter and Phillips2009) used experimental evolution to test the hypothesis that out-crossing organisms are able to adapt more rapidly to environmental changes than self-fertilizing organisms, as suggested by Stebbins (Reference Stebbins1957), Maynard Smith (Reference Maynard Smith1978) and Crow (Reference Crow1992), explaining why the majority of plants and animals reproduce by out-crossing as opposed to selfing. The advantage of out-crossing is to provide a more effective means of recombination and thereby to generate the genetic variation necessary to adapt to a novel environment (Crow Reference Crow1992). Morran et al. (Reference Morran, Parmenter and Phillips2009) suggest that even extremely low out-crossing rates (e.g. <0·05 similar to those observed in self-pollinated crops such as barley, wheat and rice) allow adaptation to stressful conditions. Even though the results were obtained by studying nematodes, the evidence is relevant for both self- and cross-pollinated crops and provides justification for evolutionary plant breeding in highly self-pollinated crops such as barley or wheat (Ceccarelli Reference Ceccarelli2014).
The CCPs of several self-pollinated crops have been used as experimental populations in evolutionary studies aimed at understanding gene frequency dynamics across time and space. However, the usefulness of these populations as dynamic gene pools or to conserve germplasm resources is not yet completely clear. Studying the temporal evolution of hordein polypeptides of the barley Cambridge Cross Composite V after 9 years of multiplication, Ibrahim et al. (Reference Ibrahim, Hayter and Barrett1996) established that selection favoured certain allelic combinations at two hordein loci (Hor1 and Hor2). The observed shift was justified by the linkage of the two loci with some major mildew resistance genes, the selective advantage of resistance to mildew and the inbreeding nature of barley. Enjalbert et al. (Reference Enjalbert, Boeuf, Belcram and Leroy1999a, Reference Enjalbert, Goldringer, Paillard and Brabantb) used restriction fragment length polymorphism (RFLP) markers to compare the evolution of allelic frequencies in two wheat CCPs (A and B) that were multiplied for 10 years at four contrasting sites in France; they reported that, analysing the populations coming from the multiplication sites as a meta-population, no alleles were lost in A and only one in B. Hence, in both cases, the meta-population was efficient in maintaining the diversity at RFLP loci (Enjalbert et al. Reference Enjalbert, Boeuf, Belcram and Leroy1999a, Reference Enjalbert, Goldringer, Paillard and Brabantb). In a study performed in wheat populations using simple sequence repeat (SSR) markers, Rousselle et al. (Reference Rousselle, Thomas, Galic, Bonnin and Goldringer2011) reported that Nei diversity indexes were quite close in the populations of the 12th generation and in the 16 initial lines inter-crossed to produce them (Rousselle et al. Reference Rousselle, Thomas, Galic, Bonnin and Goldringer2011). The result indicated that, even considering each population separately (and not together as a meta-population), there was no marked loss of within-population diversity. Finally, the evolution of genetic diversity of a genomic region surrounding the Rht-B1 gene, in comparison with the rest of the genome, was investigated using a wheat composite multiplied for 17 years (Raquin et al. Reference Raquin, Brabant, Rhoné, Balfourier, Leroy and Goldringer2008). In spite of the selection that favoured the individuals carrying the tall allelic form of the Rht-B1 gene (wild form), and the consequent loss of diversity at the locus, selection reduced diversity around the gene mildly and only in the close vicinity due to the initial high frequency of the wild allele associated with different parental haplotypes.
Molecular markers have been invoked as the decisive tool for understanding population dynamics and the effects of competition in CCP studies (Phillips & Wolfe Reference Phillips and Wolfe2005). Different types of molecular markers are available in barley (Varshney et al. Reference Varshney, Marcel, Ramsay, Russell, Röder, Stein, Waugh, Langridge, Niks and Graner2007 and references therein). Simple sequence repeat markers have proven to be extremely powerful in breeding and genetic diversity studies because they are abundant, randomly interspersed in the genome, highly variable and informative, multi-allelic and co-dominantly inherited (Powell et al. Reference Powell, Machray and Provan1996; Gupta & Varshney Reference Gupta and Varshney2000). Many genetic diversity studies have been conducted in barley germplasm collections using SSR markers derived from anonymous regions of the genome (Varshney et al. Reference Varshney, Baum, Guo, Grando, Ceccarelli and Graner2010 and references therein). However, in recent years, it has been possible to identify, develop and use SSR markers from gene sequences or expressed sequence tags (ESTs) in barley (Thiel et al. Reference Thiel, Michalek, Varshney and Graner2003; Varshney et al. Reference Varshney, Grosse, Hähnel, Siefken, Prasad, Stein, Langridge, Altschmied and Graner2006; Andris et al. Reference Andris, Arias, Barthel, Bluhm, Bried, Canal, Chen, Cheng, Chiappero, Coelho, Collins, Dash, Davis, Duarte, Dubois, Françoso, Galmes, Gopal, Jarne, Kalbe, Karczmarski, Kim, Martella, McBride, Negri, Negro, Newell, Piedade, Puchulutegui, Raggi, Samonte, Sarasola, See, Seyoum, Silva, Solaro, Tolley, Tringali, Vasemägi, Xu and Zanón-Martínez2012) as in many other species (see reviews by Kalia et al. Reference Kalia, Rai, Kalia, Singh and Dhawan2011).
Simple sequence repeat markers are extremely powerful tools to determine the contribution of different parental lines in heterogeneous experimental populations, helping to understand the effects of competition on population dynamics. The question of assigning an individual to a population has been specifically addressed in several studies focused mainly on animals (Paetkau et al. Reference Paetkau, Calvert, Stirling and Strobeck1995; Cornuet et al. Reference Cornuet, Aulagnier, Lek, Franck and Solignac1996) and humans (Rannala & Mountain Reference Rannala and Mountain1997). In particular, the so-called ‘distance method’ assigns an individual to the ‘closest’ population. In contrast to other methods the distance-based method does not require Hardy–Weinberg equilibrium or absence of linkage disequilibrium among loci (Cornuet et al. Reference Cornuet, Piry, Luikart, Estoup and Solignac1999).
The present paper reports on the analysis of 147 barley individuals from seven PPs and from the CCP derived from their inter-crossing. The analysis was carried out with 13 genomic and nine EST-derived SSR, with the aim of (i) describing the genetic composition of the CCP in relation to PPs; (ii) estimating the level of diversity that was maintained in the CCP after 13 years of multiplication without conscious human selection; (iii) detecting signs of evolution of the initial diversity; and (iv) identifying genomic regions that experienced natural selection during multiplication.
MATERIALS AND METHODS
Plant material
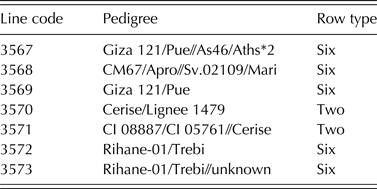
In 1997, a barley CCP was produced by crossing seven different F8 progenies, derived from seven crosses of cultivars, landraces and promising lines (hereafter parental populations or PP) that were good performers under low-input conditions in Central Italy (Negri & Petti Reference Negri, Petti, Santucci and Zanoli1995). The PPs were obtained from crosses produced at the International Center for Agricultural Research in the Dry Areas (ICARDA) in the early 1980s to combine different sources of adaptation and resistance to biotic and abiotic stresses (Table 1).
Codes of the seven PPs used to produce the CCP. The initial cross is indicated by a single slash (e.g. A/B), and the second cross by a double slash (e.g. A/B//C)

* Backcrosses and dosage of the recurrent parent.
Atlas 46 (abbreviated to As46), a six-row line resistant to powdery mildew and scald, was released in California in 1947 and is widely used in barley breeding programmes worldwide. Athenais (abbreviated to Aths) is an early six-row Greek variety used largely in barley breeding programmes in Cyprus. Cerise is a two-row variety released in the UK in 1980. The two Crop Introductions CI 05761 and CI 08887 are from the Ukraine and Turkey, respectively; the former is known to be very resistant to cold. A yellow dwarf virus-resistant and salt-resistant line CM67 (CM stands for California Mariout where Mariout is part of Cairo) was obtained in California from a crop introduction from Egypt. Giza 121 is a six-row variety adapted to irrigated conditions in Egypt. Lignee 1479 is a breeding line from France. Mari is a very early lodging-resistant and photoperiod-insensitive two-row mutant obtained by X-rays from Bonus, a variety registered in Sweden in 1950. Puebla (abbreviated to Pue) and Apro are six-row Mexican varieties. Rihane-01 is a six-row variety derived from the cross As46//Avt/Aths that was obtained in Lebanon and is adapted to high rainfall areas. Sv. 02109 is a breeding line from Sweden that flowers slightly earlier and is more lodging-resistant than Mari. Trebi, a pure line selection made in 1907 in Minnesota, has high-yield potential under irrigated conditions. Therefore, the seven F8 PP represent a very large array of germplasm of very diverse origin, and consequently the CCP resulting from their inter-crossing was expected to display the large level of genetic diversity needed for this type of study.
The CCP was developed as follows. A pollen bulk of all of the (other) PPs was used to manually pollinate each maternal parent (emasculated plant). The same number of plants from each of the seven PP was used as maternal parents. Accordingly, seven different F1 populations were produced. For each F1, over 200 seeds were obtained and, based on their minimum, a total of 1421 seeds (203 seeds × 7 PP) were bulked and sown to produce the F2. The population was then multiplied for 13 years at the experimental field of the Dipartimento di Scienze Agrarie, Alimentari e Ambientali in Perugia (43°02′N, 12°25′E, 174 m a.s.l.) under a low-input management system (i.e. approximately half of the normal nitrogen supply) and without any conscious human selection. Each year, c. 30 000 individuals were multiplied (300 seeds/m2 on a 100 m2 plot).
In 2011, 91 seeds from the CCP were chosen randomly and grown in the field as single plants named AUT DBA following a progressive numbering from 001 to 091 (AUT stands for ‘autumnal sowing’ and DBA is the former Department acronym). In the same year, the seven PPs were grown separately in a greenhouse using the seed stored in the Department genebank. Rainfall and monthly average maximum, minimum and mean temperatures (°C) were recorded during the 13 CCP multiplication seasons. In addition, for each month, the overall mean was calculated across the whole period. Soil texture, soil total organic carbon, available phosphorus and exchangeable potassium of the experimental field were measured using standard protocols.
DNA extraction and SSR genotyping
Approximately 50 mg of fresh leaf tissue was collected from eight randomly chosen individuals for each PP (56 single individuals) and from the 91 individuals representing the CCP for a total of 147 individuals. Considering the genetic composition of the PP (eight generations of selfing in a diploid species), eight individuals were considered sufficient to represent the major part of the residual allelic variability present in each PP. Genomic DNA was extracted using the DNeasy® 96 Plant Kit (Qiagen) and following the procedures suggested by the manufacturer. The DNA quality and concentration were assessed through spectrophotometry using NanoDrop 2000 (Thermo Scientific).
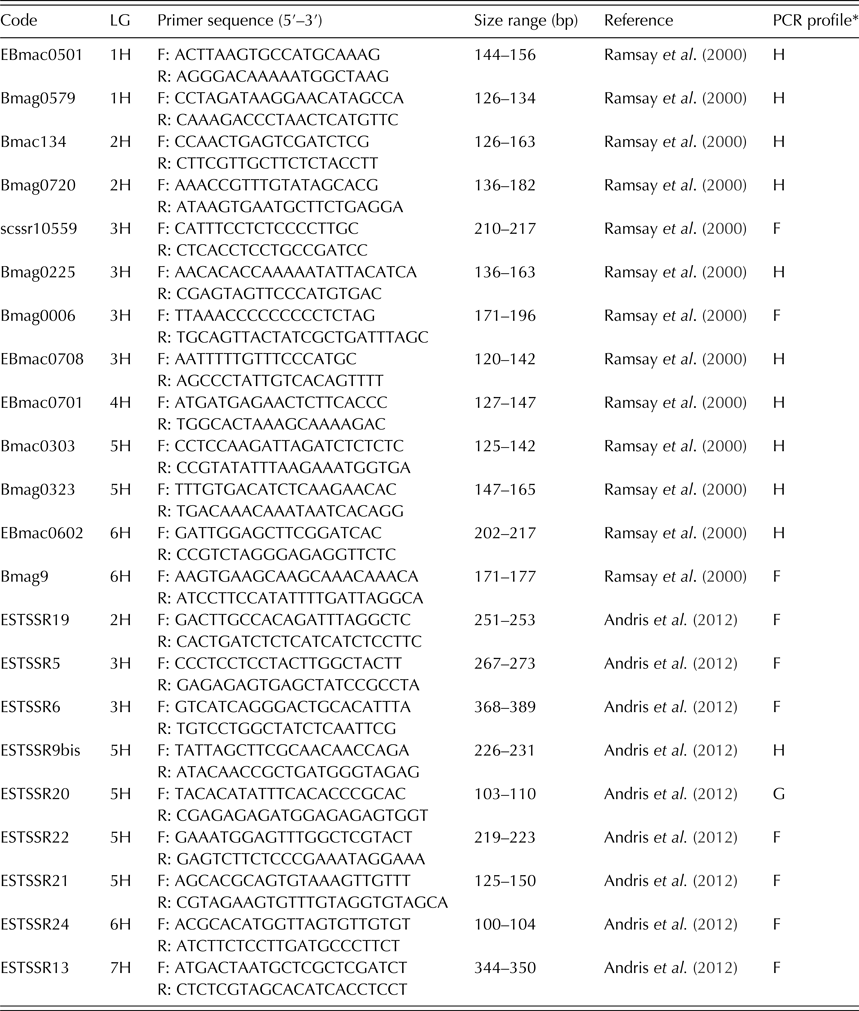
The molecular characterization of the 147 individuals was performed using 22 SSR markers: 13 genomic (gSSR) and nine EST-derived SSR developed in candidate genes for abiotic stress response and flowering control. The complete list of SSR markers, their position in the barley genome, repeat motif and bibliographic source are reported in Table 2. All the PCR reactions were performed in an Applied Biosystems 2720 Thermal Cycler in a volume of 12 μl containing the following: 20 ng of template DNA, 1× Type-it® Multiplex PCR Master Mix (Qiagen) and 0·4 μM of each primer and using three different cycling parameters called F, G and H (Table 2). Primers were combined into five triplexes, three duplexes and only one locus was amplified separately. The SSR fluorescent amplification, amplicon separation and genotyping were performed as described in Andris et al. (Reference Andris, Arias, Barthel, Bluhm, Bried, Canal, Chen, Cheng, Chiappero, Coelho, Collins, Dash, Davis, Duarte, Dubois, Françoso, Galmes, Gopal, Jarne, Kalbe, Karczmarski, Kim, Martella, McBride, Negri, Negro, Newell, Piedade, Puchulutegui, Raggi, Samonte, Sarasola, See, Seyoum, Silva, Solaro, Tolley, Tringali, Vasemägi, Xu and Zanón-Martínez2012) for the SSR markers developed in H. vulgare. To test the reliability of the analysis, three samples were separately analysed two times.
SSR locus, linkage group, primer sequence, size range of observed alleles, bibliographic reference and PCR profile of the 22 SSR markers used
* Described in Andris et al. (Reference Andris, Arias, Barthel, Bluhm, Bried, Canal, Chen, Cheng, Chiappero, Coelho, Collins, Dash, Davis, Duarte, Dubois, Françoso, Galmes, Gopal, Jarne, Kalbe, Karczmarski, Kim, Martella, McBride, Negri, Negro, Newell, Piedade, Puchulutegui, Raggi, Samonte, Sarasola, See, Seyoum, Silva, Solaro, Tolley, Tringali, Vasemägi, Xu and Zanón-Martínez2012) for Hordeum vulgare L. species.
Relationship among PP and CCP individuals
To assign each of the 91 CCP individuals to any of the seven PPs, on the basis of the ascertained multilocus genotype, several assignment criteria were used. A pairwise, individual-by-individual (N × N) genetic distance (GD) matrix was calculated for co-dominant data according to Peakall et al. (Reference Peakall, Smouse and Huff1995) and Smouse & Peakall (Reference Smouse and Peakall1999). The GD matrix was used to construct a phylogenetic tree using the neighbour joining (NJ) clustering method in MEGA4 software (Tamura et al. Reference Tamura, Dudley, Nei and Kumar2007) and to perform a principal coordinate analysis (PCoA) using Past software (Hammer et al. Reference Hammer, Harper and Ryan2001). A Bayesian approach was also used to calculate the genetic membership of each individual of the CCP using the STRUCTURE software (Pritchard et al. Reference Pritchard, Stephens and Donnelly2000). The number of clusters tested (K) was selected in agreement with the GD analysis results. Accordingly, a single run (K = 5) was performed using 650 000 MCMC repetitions and 400 000 burn-in periods, no prior information, assuming correlated allele frequencies and admixture; other parameters were set to the default value. All individuals were treated as having unknown origin. A graphical bar plot of membership for K = 5 was generated.
Allelic richness and diversity analyses of PP and CCP populations
To calculate allelic richness, a moment-based richness estimator was used, up to the number of individuals present in each population. A truncated binomial mixture model was used to extrapolate beyond the number of individuals and mean accumulation curves of estimated allelic richness, with confidence bounds, were produced. The calculations were performed using the R function for allelic richness estimation (ARES) from Van Loon et al. (Reference Van Loon, Cleary and Fauvelot2007). The per cent of polymorphic loci was estimated following the criterion of 95% of major allele frequency. Temporal variation of genetic diversity between PP and CCP populations was quantified in terms of number (Na) and effective number (Ne) of alleles per locus, expected heterozygosity (He), fixation index (F) and number of private alleles (P). All the above-mentioned parameters were calculated separately for gSSR and EST-derived SSR using GenAlex version 6 (Peakall & Smouse Reference Peakall and Smouse2006). Differences between PP and CCP populations and between gSSR and EST-derived SSR were tested with a Student's t-test. The number of rare alleles (i.e. alleles with a frequency <0·05) was also calculated. In addition, changes in allele frequencies, with respect to the PP, were worked out separately for alleles present at high (>0·2), moderate (0·2⩽ and >0·05) and low (⩽0·05) frequency.
Population differentiation and selective effects
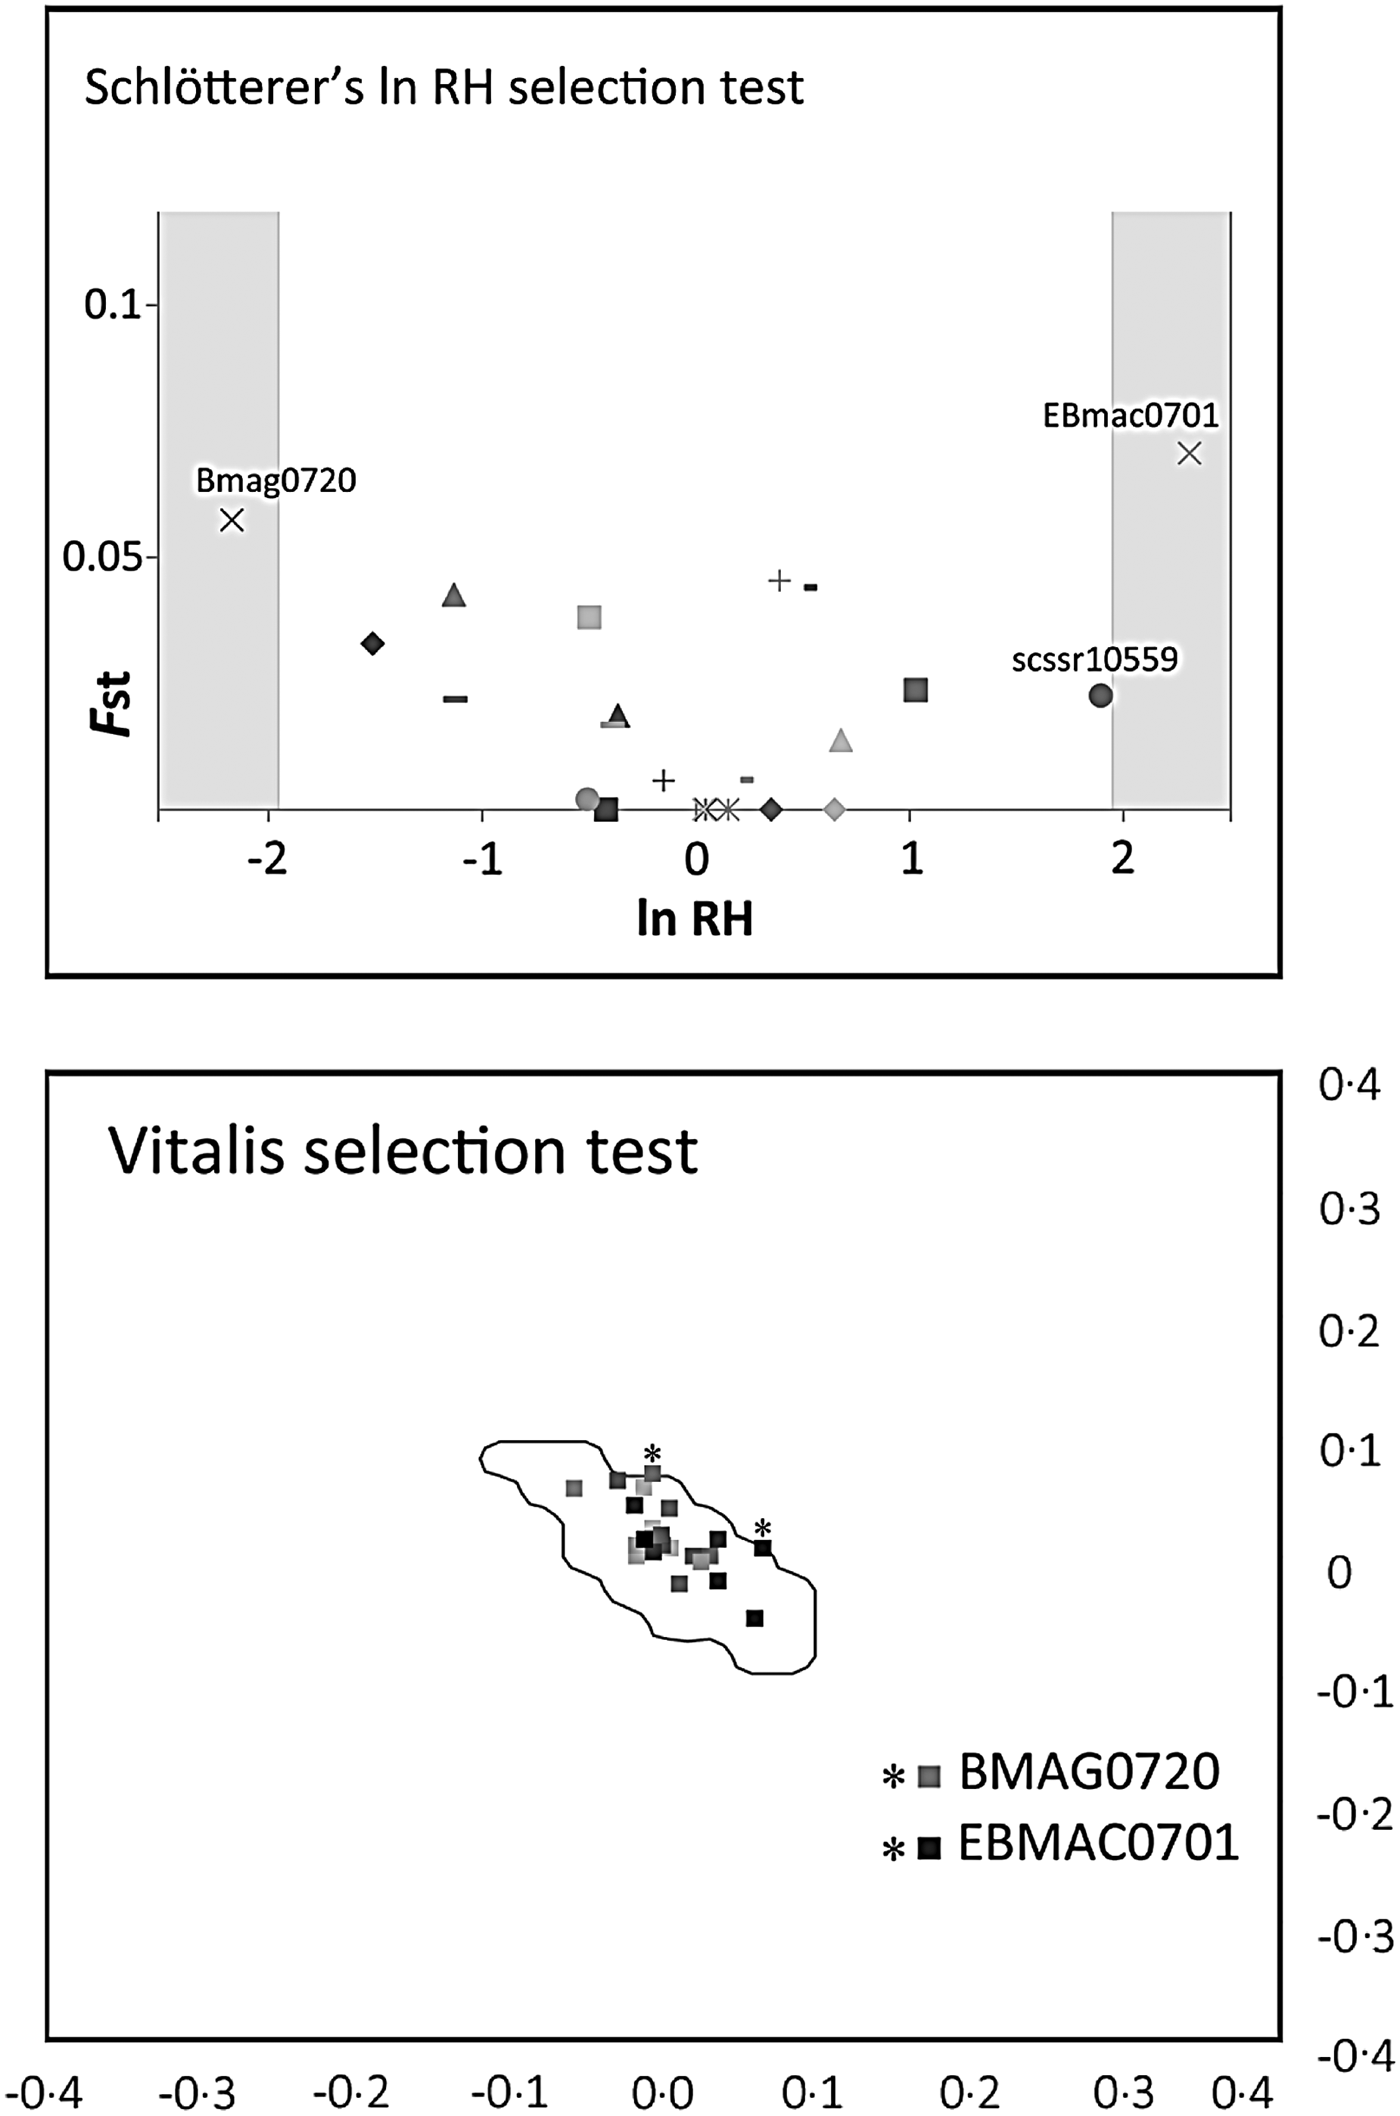
An analysis of molecular variance (AMOVA) was performed to test the significance of differentiation of PP and CCP populations using the GenAlex software. For this purpose 9999 permutations were used. Finally, two methods were used to detect loci putatively under selection in the two studied populations: one from Schlötterer (Schlötterer Reference Schlötterer2002; Schlötterer & Dieringer Reference Schlötterer, Dieringer and Nurminsky2005) and the other from Vitalis et al. (Reference Vitalis, Dawson and Boursot2001). Although the first method is based on the principle that adaptation to local conditions results in a reduction of within-population diversity, the second method is based on the principle that genetic differentiation between populations is expected to be higher for loci under divergent selection than for the rest of the genome. The latter method is implemented in the DetSel software (Vitalis Reference Vitalis2003); for the analysis used in the present study, a null distribution was obtained based on a range of nuisance parameters ( μ varying from 10−2 to 10−4, Ne from 103 to 5 × 10³, N 0 and t were set to 100 and 25, respectively. Fifty thousand realizations were performed and the level of significance was set at 0·99 to have the most conservative results.
RESULTS
Multiplication environment characteristics
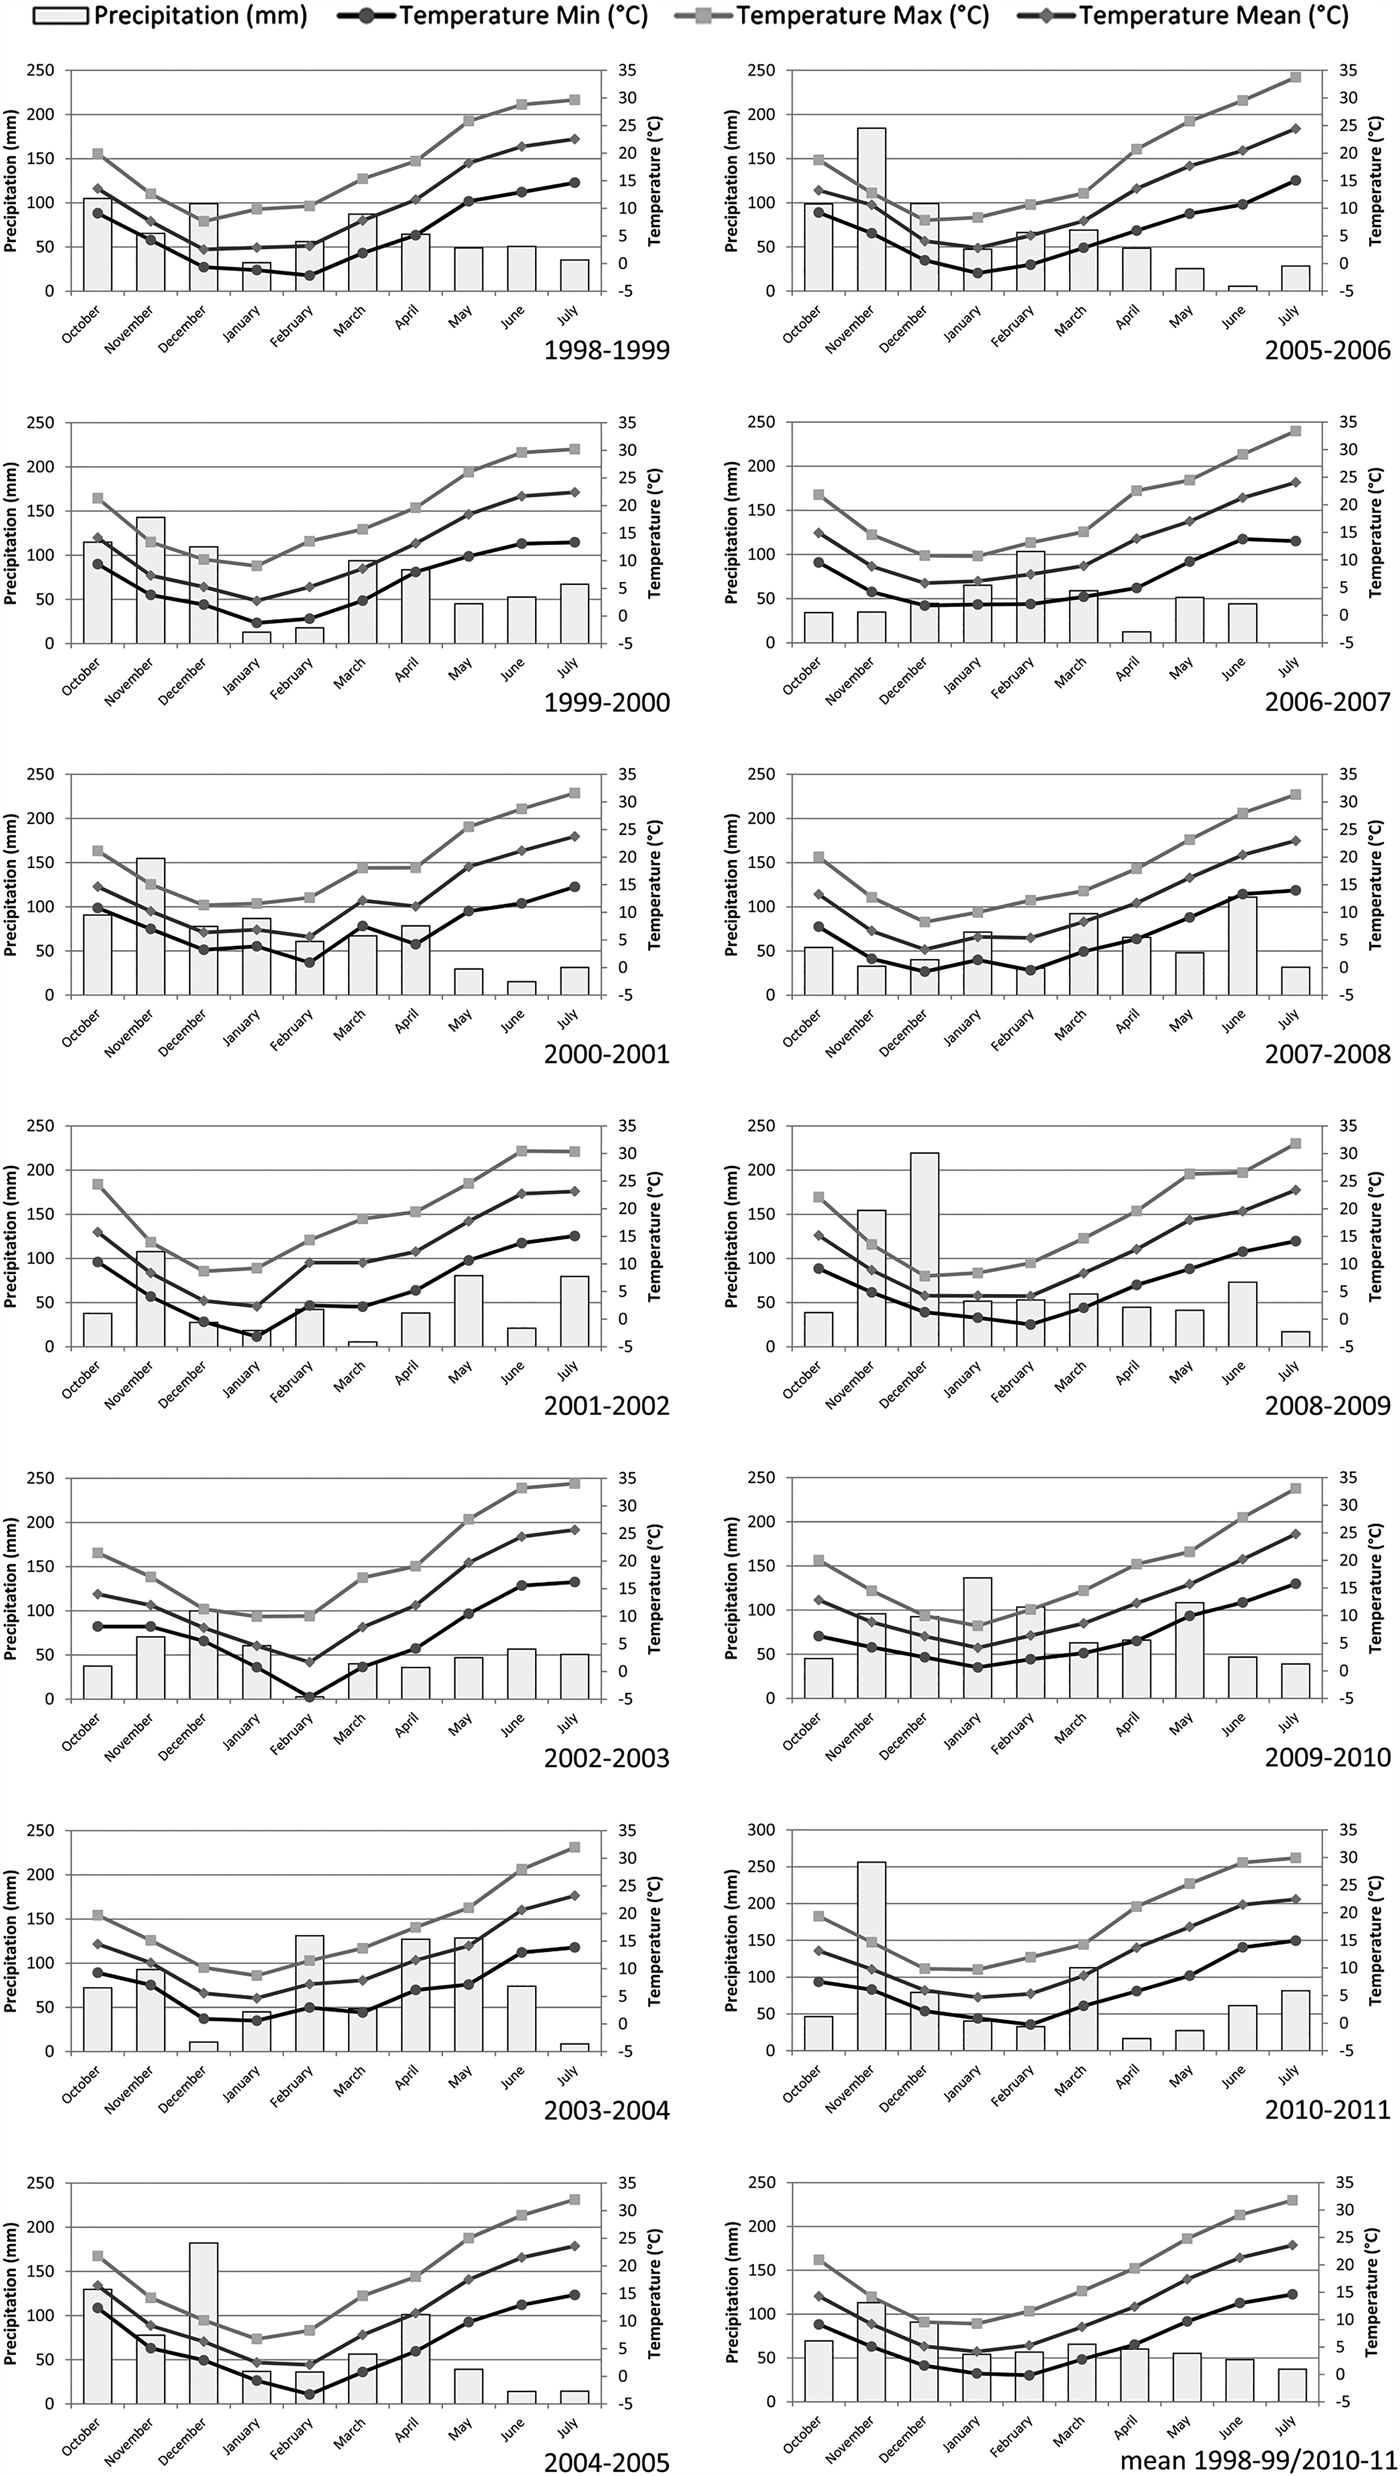
The climatic characteristics of the experimental field were generally favourable for growing barley (Fig. 1), with growing seasons that normally last from November to the end of July. However, during CCP multiplication, differences occurred from year to year, particularly in the precipitation distribution in months corresponding to critical stages of plant growth (e.g., April and May, when spike emergence occurs and filling begins). Rainfall in April was low and less than the crop requirement in seasons 2006/07 (12·4 mm) and 2010/11 (16·6 mm) and low in May in seasons 2000/01 (29·6 mm), 2005/06 (25·4 mm) and 2010/11 (27·4 mm) (Fig. 1). Considering the precipitations of the 2 months together, seasons 2000/01 and 2005/06 were particularly unfavourable for the late-flowering lines, due to drought stress at flowering, while 2010/11 was unfavourable for early flowering lines. Finally, the experimental field soil was mostly silty with clay, silt and sand contents of 28, 50 and 22% by volume (the sand fraction was composed of 32% coarse and 68% fine particles). The level of organic matter is low (13·1 g/kg), with a high level of available phosphorus and an average level of exchangeable potassium.
Monthly precipitation and mean minimum, maximum and average temperature (°C) during the 13 CCP multiplication seasons.
Relationships among PP and CCP individuals
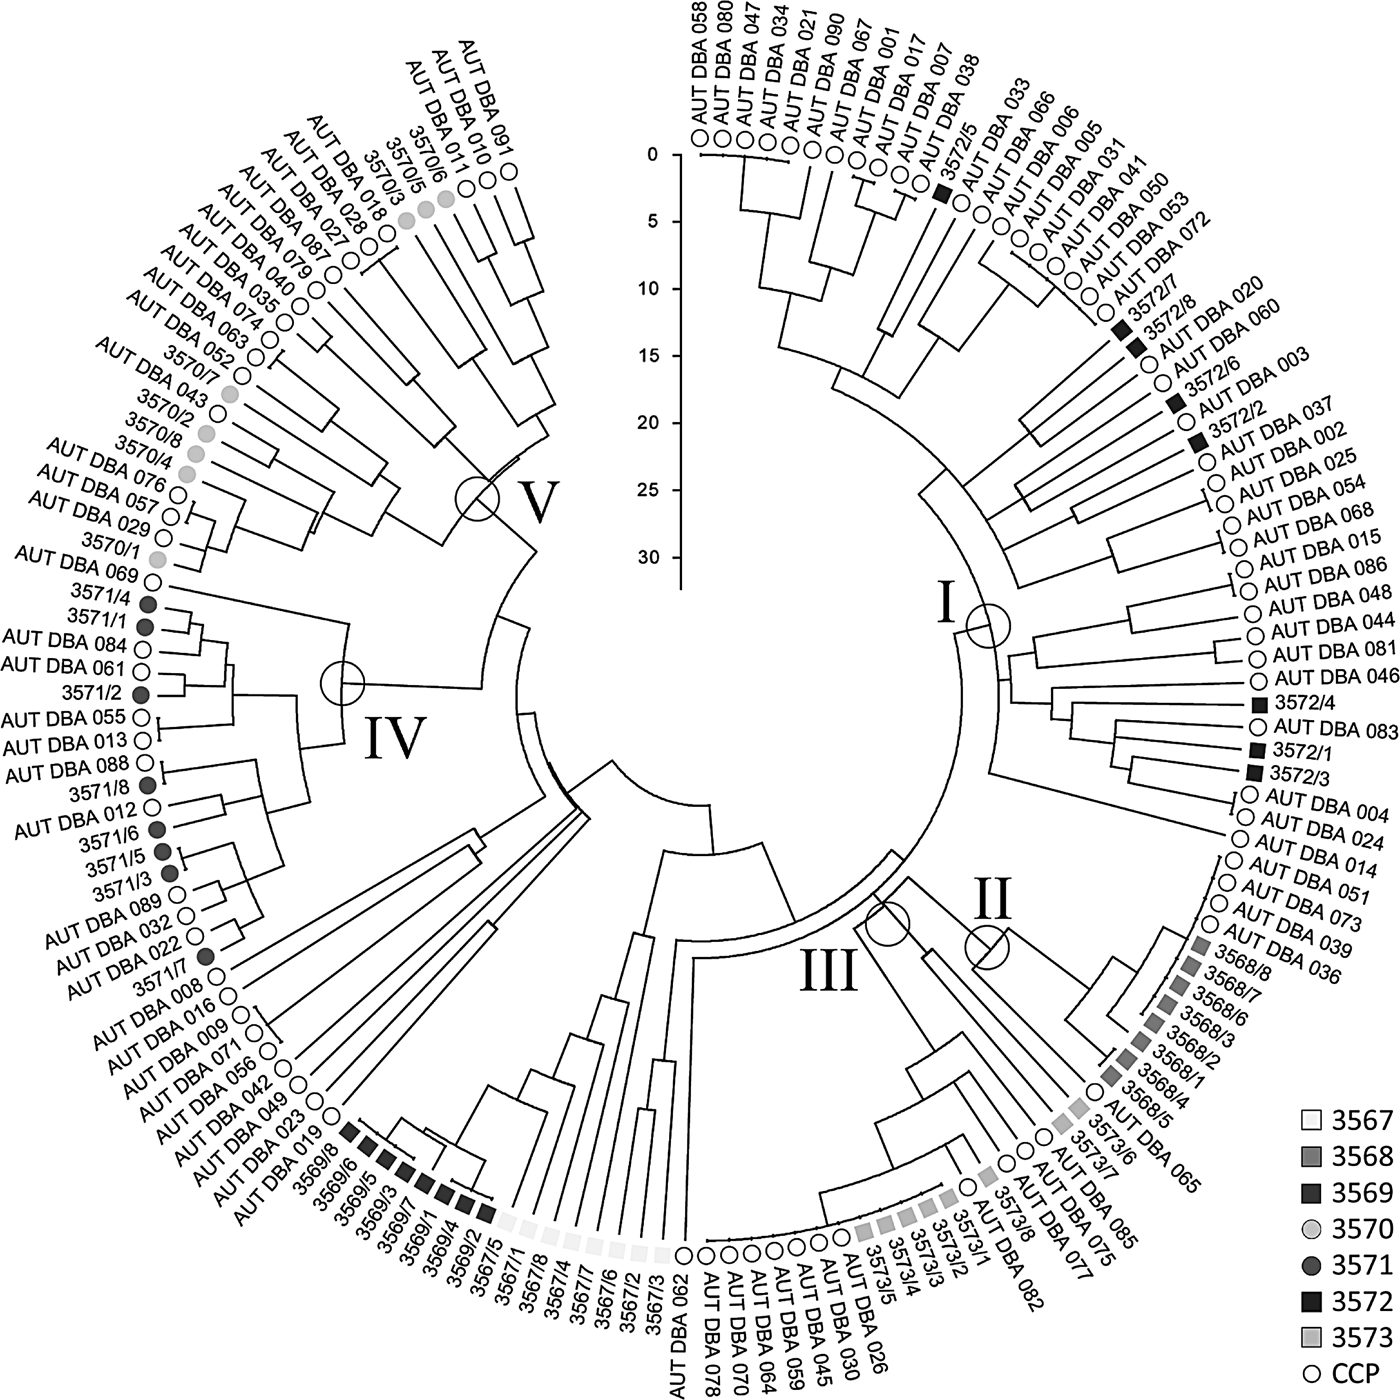
A graphic representation of the genetic relationships among individuals of the seven PP and of the CCP is shown in Fig. 2. According to the NJ tree, each PP was composed of a different number of related genotypes: populations 3572, 3567 and 3570 of eight genotypes each, population 3571 of seven, population 3573 of four, and populations 3568 and 3569 of three genotypes each for a total of 41 genotypes. The PP were divided into two major groups corresponding to the six-row (namely 3567, 3568, 3569, 3572 and 3573) and two-row types (namely 3570 and 3571).
Neighbour-joining tree of genetic distances of the 147 studied barley individuals. Individuals are represented according to the legend. Open circles refer to CCP individuals, solid circles and squares refer to two- and six-row PP individuals, respectively. The five major clusters, including CCP individuals are indicated by Roman numerals. The bar shows the GD scale.
The CCP individuals were mainly close to 3568, 3570, 3571, 3572 and 3573 populations and were grouped into five major clusters with the exception of ten individuals (namely AUT DBA 008, 016, 009, 071, 056, 042, 049, 023, 019 and 062) (Fig. 2). The five clusters differed in the number of individuals and the relative level of genetic diversity. Cluster I was the largest, including 38 CCP individuals (23 genotypes), followed by cluster V with 17 individuals (13 genotypes), cluster III with 11 individuals (five genotypes), cluster IV with 10 individuals (nine genotypes) and the smallest, cluster II, with only five individuals (two genotypes). None of the CCP individuals clustered together with those of 3567 and 3569 PPs. According to the different multi-locus genotypes identified, the CCP was composed of 60 genotypes with some individuals that shared the same profile with others in the same cluster. Only three genotypes of the CCP showed a multi-locus genotype identical to individuals from the PP (Fig. 2).
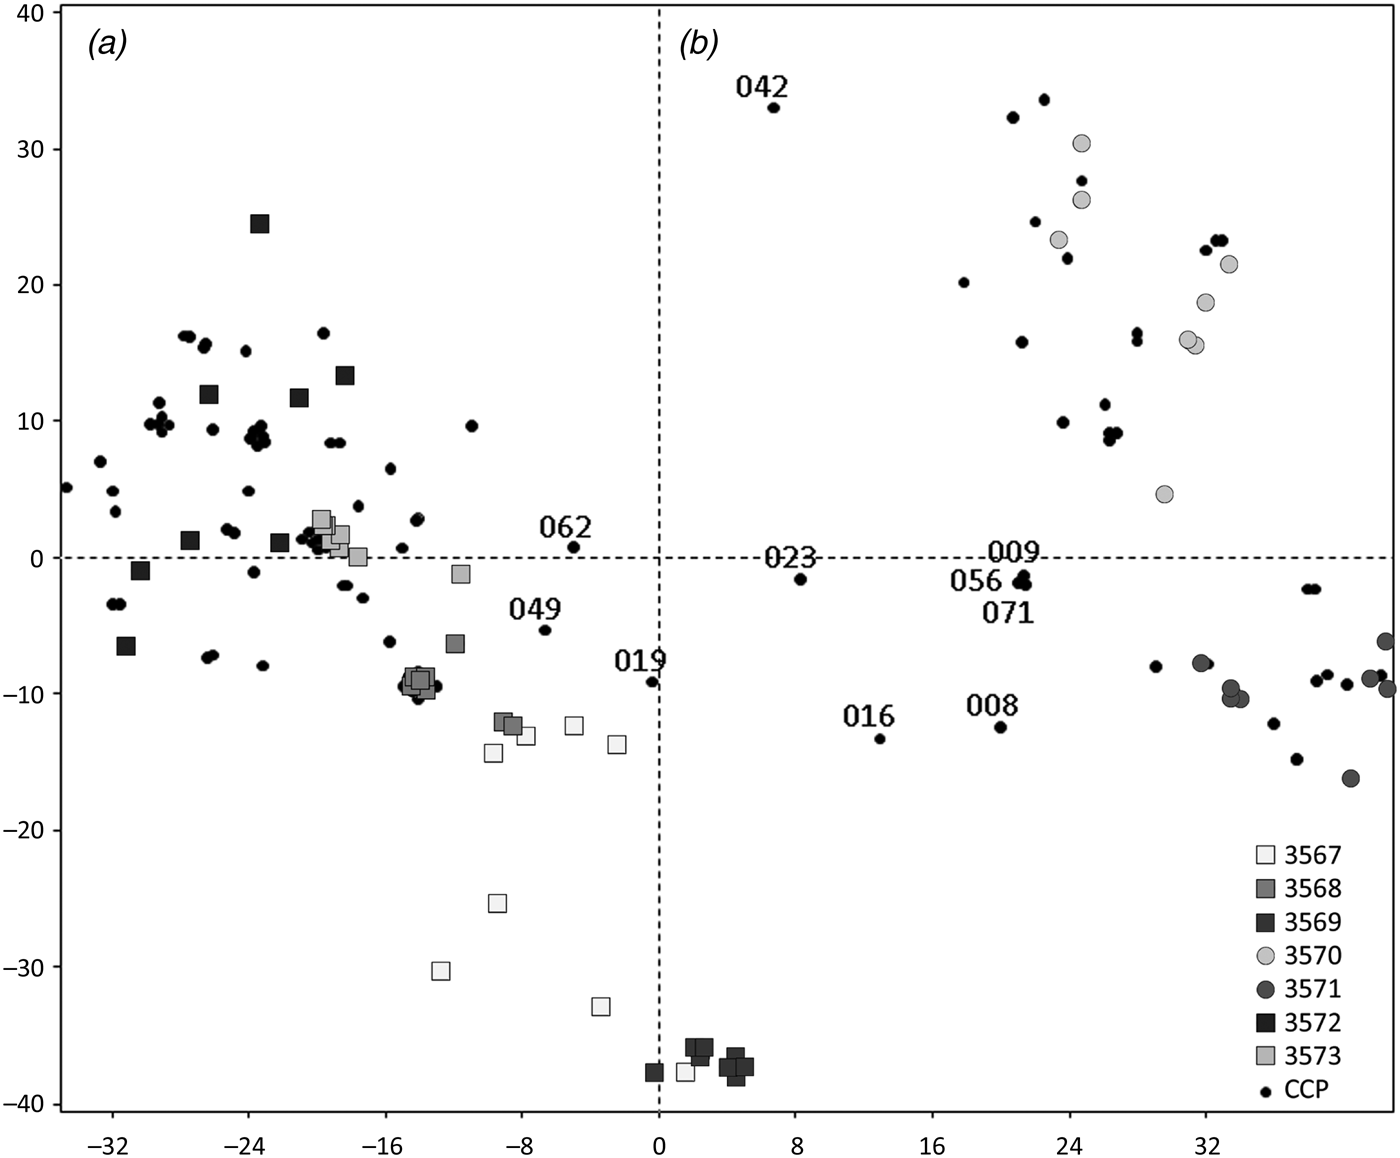
The genetic relationship between PP and CCP individuals was also investigated by PCoA (Fig. 3). The first two major axes explained 59·1% of the total variation. The PCoA also classified the individuals into two major groups (a and b), separating the two- and six-row plants. Although groupings were similar to those detected by cluster analysis, a better representation of the genetic similarity of the ten individuals not included in the NJ major clusters was obtained: AUT DBA 019, 049 and 062 were more similar to the six-row PP, AUT DBA 008, 009, 056 and 071 to the two-row PP, while AUT DBA 016, 023 and 042 remained between the two groups.
Scatter plot of the 147 studied barley individuals using the first two principal coordinates. Individuals are represented according to the legend. Small solid circles refer to CCP individuals, big solid circles and squares refer to two- and six-row PP individuals, respectively. The main groups detected are indicated with ‘a’ and ‘b’ letters. In some cases, to prevent complete overlapping and display the total number of individuals, symbols representing individuals with identical multilocus genotype were slightly detached in the PCoA representation (e.g. AUT DBA 009, 056 and 071 have identical multilocus genotype).
Finally, percentages of membership (q) of each individual of the CCP, estimated by the STRUCTURE analysis for K = 5 are shown in Fig. 4. According to STRUCTURE results, most of the individuals of the CCP were assigned to one of the five tested groups (from A to E). However, 15 individuals, representing 16·5% of the CCP, namely AUT DBA 003, 008, 014, 016, 019, 023, 037, 042, 049, 062, 065, 069, 081, 083 and 085 showed an admixed genetic profile (i.e. a membership assignment percentage below 0·8).
Percentage of membership (q) of each CCP individual to the five groups (from A to E) tested in STRUCTURE analysis. Each individual is represented by a vertical line divided into coloured segments, the lengths of which indicate the proportion of the genome that is attributed to the specific groups. Individuals with admixed genetic profile are indicated by an arrow.
Allelic richness and diversity analyses of PP and CCP populations
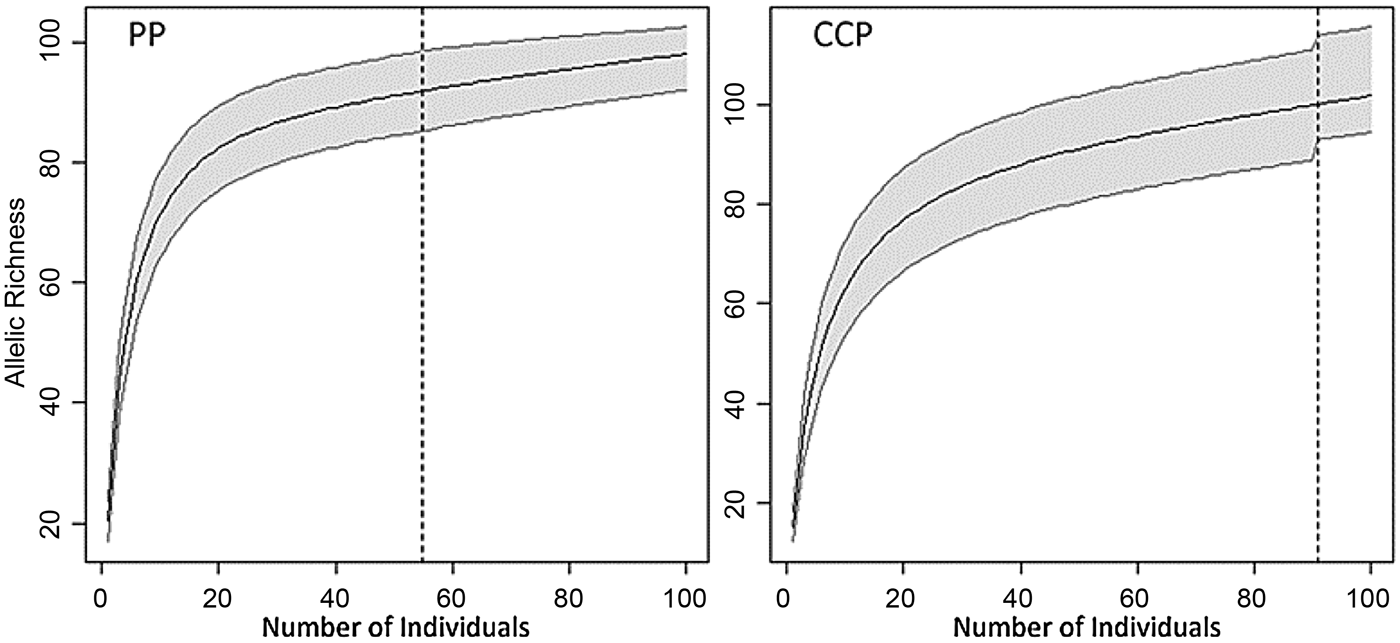
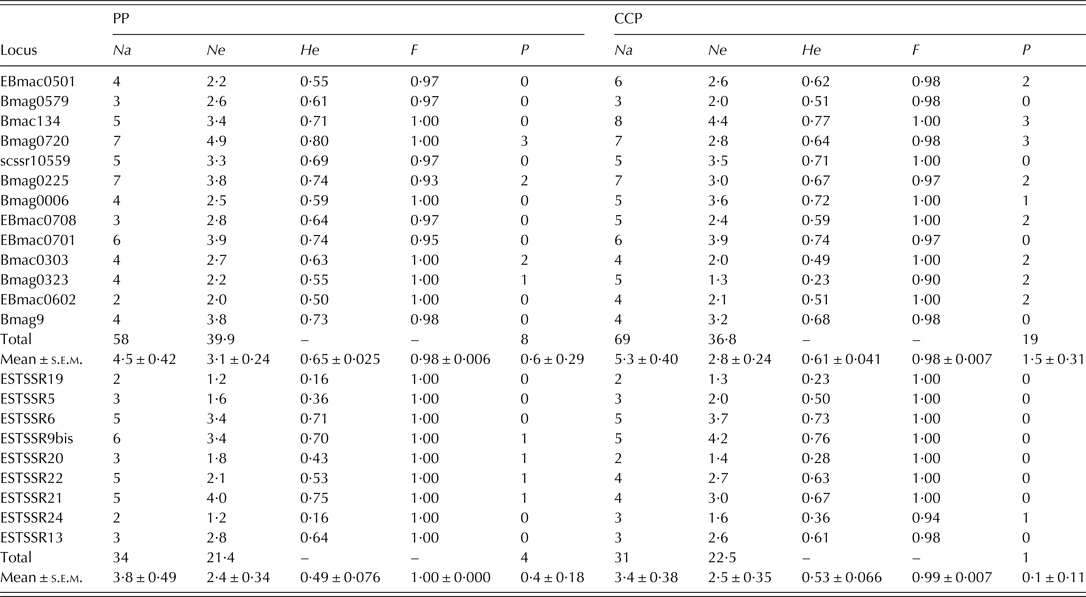
Ninety-two different alleles were detected in the PP and 100 in the CCP for a total of 112 different alleles. All the loci studied were polymorphic, since alleles with frequencies >95% were not observed. For both PP and CCP populations, as sample size increased, mean allelic accumulation curves were close to reaching the asymptote, showing that the highest proportion of alleles had been sampled (Fig. 5). Accordingly, very few new alleles would have been detected by increasing the sample size. Genetic diversity parameters, calculated separately for gSSR and EST-derived SSR in the PP and the CCP, are reported in Table 3. Comparing the two populations, the mean genetic diversity parameters were not statistically different (Student's t-test P ⩽ 0·05). However, in the CCP, the Na and P values were significantly higher for the gSSR than for EST-derived SSR.
Mean allelic accumulation curves for the PP and CCP with 95% confidence bounds as shaded area.
Genetic diversity indexes calculated for the gSSR and EST-derived SSR in PP and CCP populations. For each population and SSR type, total, mean and standard error of the mean (s.e.m.) values are also reported
Na, number of alleles; Ne, number of effectives alleles; He, expected heterozygosity; F, fixation index; P, number of private alleles.
The Na of gSSR ranged from 2 (EBmac0602) to 7 (Bmag0720 and 0225) and from 3 (Bmag0579) to 8 (Bmac134) in PP and CCP, respectively (Fig. 6(a)) while, in EST-derived SSR, it ranged from 2 (ESTSSR19 and 24) to 6 (ESTSSR9bis) and from 2 (ESTSSR19 and 20) to 5 (ESTSSR6 and ESTSSR9bis) (Fig. 6(b)). The Ne values of gSSR ranged from 2·0 to 4·9 (Bmag0720) and from 1·3 to 4·4 (Bmac134) in PP and CCP, respectively (Fig. 6(c)), while, in EST-derived SSR, values ranged from 1·2 to 4·0 (ESTSSR21) and from 1·3 to 4·2 (ESTSSR9bis) (Fig. 6(d)). In the gSSR markers, eight and 19 private alleles were detected in the PP and the CCP, respectively, while four and one, respectively, were detected in EST-derived SSR. The number of rare alleles was 12 and 23, with an average of 0·54 and 1·04 rare alleles per locus in the PP and the CCP population, respectively. The F values were generally high in all the loci studied, as expected for an autogamous species (Table 3) and the two populations are essentially mixtures of homozygous lines.
Radar chart representation of the PP (dark grey) and the CCP (light grey) diversity parameters. Na and Ne values observed in gSSR (a and c) and EST-derived SSR (b and d) in the two studied populations are reported.
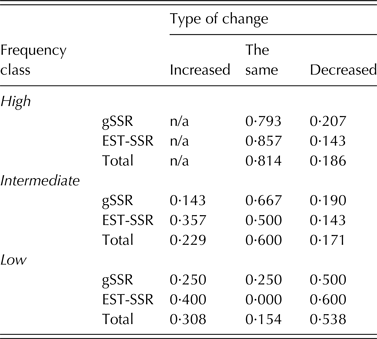
Among the 92 alleles detected in the PP, 44 were present at high, 35 at intermediate and only 13 at low frequency: 93·2 and 94·3% of the high- and intermediate-frequency alleles survived in the CCP, while the situation was extremely different for the 12 alleles present at low frequency. In fact, only 46·1% of these survived in the CCP. Overall, 11·1% of the alleles observed in the PP were not recovered in CCP and almost half of these were rare in the PP. Allele frequency changes between PP and the CCP are reported in Table 4. The largest part of the high- and intermediate-frequency alleles did not change their frequency from PP to the CCP, while 84·6% of the low-frequency alleles changed.
Proportion of alleles that increased, remained the same or decreased their frequencies from PP to CCP populations. Changes of alleles present at high, intermediate and low frequency in the PP are presented separately. According to class definition, alleles already present at high frequency in PP cannot increase in frequency
Population differentiation and selective effects
The AMOVA results indicated that the largest proportion of variation is within rather than between populations; however, the genetic differentiation of PP and CCP is statistically highly significant (Table 5). Schlötterer's ln RH selection test, carried out on PP v. CCP, showed that Bmag0720 and EBmac0701 are putatively under selection (P ⩾ 0·99) and scssr10559 is close to significance (Fig. 7). SSR Bmag0720 and EBmac0701 were confirmed as loci putatively under selection (at P ⩾ 0·99) by the Vitalis test (Fig. 7). None of the EST-derived SSR were indicated as potentially under selection.
Selection test results of the comparison between the PP and the CCP. Schlötterer's ln RH selection test: each symbol represents an SSR marker, the vertical lines represent the 95% confidence envelope (white area) and shaded areas contain markers putatively under selection. Vitalis selection test: plot of F1 v. F2 estimates, each square represents an SSR and the line represents the 95% confidence envelope.
AMOVA of the parental and composite cross-derived barley populations based on the 22 analysed SSR markers.
DISCUSSION
Relationship among PP and CCP individuals
According to the cluster and PCoA analyses, the seven PP are well distinguished and have different levels of among-individuals diversity, which is consistent with the available pedigree information. In particular, 3567, 3570 and 3572 PP, the most heterogeneous, are composed of eight different genotypes. Confirming what has already been reported, the two- and six-row PP are also clearly separated due to the long breeding history for different uses (i.e. for malting/human use or for fodder) (Malysheva-Otto et al. Reference Malysheva-Otto, Ganal and Röder2006). Among the PP, 3572 gave origin to the highest proportion of CCP individuals and genotypes (cluster I). The success of the 3572 PP progeny can be related to the high-yield potential of Trebi and to the adaptation of Rihane-01 to high rainfall areas, both present in its genealogy. Together with Coast, Trebi was one of the best competitors as also reported by Harlan & Martini (Reference Harlan and Martini1938). Cluster V (3570 PL) including 18·7% of all CCP individuals, was the second in terms of dimensions.
After 13 years of multiplication the progenies of all PP were present in the CCP, with the exception of 3567 and 3569 PP. Indeed ‘selection for competition ability’ can produce dramatic changes in the composition (i.e. proportion of different lines) of barley heterogeneous populations even in a time frame much shorter than the one considered in the present study (Harlan & Martini Reference Harlan and Martini1938; Blijenburg & Sneep Reference Blijenburg and Sneep1975). Nevertheless, the high number of different multi-locus genotypes still present in the CCP (60, almost two thirds of the total individuals analysed) suggests that the short time elapsed or the characteristics of the multiplication environment did not always lead to strong selection. Considering that 95% of the CCP multi-locus genotypes were different from those of PP (57 out of 60) and that 25% of these genotypes showed a high admixture level (15 out of 60), a high multi-locus genotype diversity still exists in the CCP. This high number of genotypes can be related to the characteristics of the PP used to produce the CCP. In fact, these populations were initially selected, among a range of others, after testing their yield potential under a low-input management system for 4 years (Negri & Petti Reference Negri, Petti, Santucci and Zanoli1995) and the same cultivation conditions were used for the subsequent multiplication of their progenies. In a seed-propagated species such as barley, the highest yielding are often the most fit genotypes: fitness largely depends on the number of seeds produced which, in turn, is a component of yield. Since all the parental genotypes were fit to the environment, their progenies likely experienced low selection pressure during the successive multiplications. In addition, weather variation across years could have played a relevant role in maintaining genetic diversity favouring different lines in different years in particular due to water availability at flowering time. Differences in flowering time are quite relevant in the CCP with the earliest lines (mainly six-row) flowering 3 weeks before latest (mainly two-row) (L. Raggi, personal communication). According to the literature, environmental variation (either in time or space) contribute to the maintenance of diversity in heterogeneous populations for a long period of time due to a less severe selection pressure on genotypes performing best away from the environmental mean (Rhoné et al. Reference Rhoné, Remoué, Galic, Goldringer and Bonnin2008; Döring et al. Reference Döring, Knapp, Kovacs, Murphy and Wolfe2011).
Allelic richness and diversity analyses of PP and CCP populations
For the specific aim of assessing genetic diversity within a population or genetic structure among populations, an accurate estimate of allele frequencies is more significant than detecting all the alleles (Hale et al. Reference Hale, Burg and Steeves2012). Considering that estimates of allelic richness are greatly dependent on sample size, rarefaction methods have been suggested to compare uneven samples. However, using this approach, large amounts of valuable information can remain unused (Melo et al. Reference Melo, Pereira, Santos, Shepherd, Machado, Medeiros and Sawaya2003). As a consequence, extrapolating small samples can be more convenient rather than rarefying large samples (Colwell & Coddington Reference Colwell and Coddington1994; Melo et al. Reference Melo, Pereira, Santos, Shepherd, Machado, Medeiros and Sawaya2003). Using the extrapolation approach the sample size in the present paper was found to be adequate since the calculated accumulation curves showed that the greatest proportion of alleles had been sampled from both PP and CCP populations. Therefore, it can be said with confidence that calculated allele frequencies are representative of the true population frequencies and, consequently, that also the estimates of genetic diversity parameters and AMOVA are reliable.
The mean values of the most frequently used descriptors of genetic diversity were not significantly different between the PP and CCP populations. In particular, high- and intermediate-frequency alleles in the PP largely survived many cycles of multiplication (only four of them were lost), whereas most of the rare alleles disappeared. It was observed that the frequency of some intermediate and low-frequency alleles, particularly in some EST-derived SSR, increased significantly (becoming high- and intermediate-frequency alleles, respectively), which suggests they have an adaptive value (see below). In general, the useful genetic variation (i.e. the variation maintained in high- and intermediate-frequency alleles) was preserved in the CCP.
In the CCP, the loss of rare alleles of PP was more than compensated for by the gain of new alleles that resulted in an increased total number of alleles. The new private CCP alleles could have arisen from mutation or gene flow. Considering (i) that most of them (19 out of 20) were detected in gSSR, (ii) that barley is a highly selfing species, and (iii) that the experimental field was isolated from other barley fields, the former is the most likely hypothesis, also consistent with the fact that gSSR are generally more prone to mutation than EST-derived SSR (Chabane et al. Reference Chabane, Ablett, Cordeiro, Valkoun and Henry2005). Regarding the low frequency of the new CCP alleles, their condition can be due either to little effect on adaptation (see the discussion above) or to lack of time to show a selective advantage.
Population differentiation and selective effects
While no substantial loss of alleles was observed comparing the two populations, the AMOVA results showed that the PP and CCP populations are differentiated and this clearly indicates that evolution occurred in the CCP over 13 years of multiplication. This evidence is confirmed by the significance of selective tests for EBmac0701, Bmag0720 and scssr10559. It is worth noting that EBmac0701 has been reported as co-localized with quantitative trait loci (QTLs) for relative leaf water content on chromosome 4H (Mohammed Reference Mohammed2004). The SSR markers EBmac0701 and Bmag0720 have also been reported as co-localized with important QTLs for peduncle extrusion and for plant height, respectively, in QTL analysis for agronomic traits under drought in recombinant inbred lines (RILs) from Arta × Keel cross (Rollins et al. Reference Rollins, Drosse, Mulki, Grando, Baum, Singh, Ceccarelli and von Korff2013). In the same study, scssr10559 was associated with a chromosome region controlling grain yield. Rapid evolution of plant height in heterogeneous populations, due to competition for light among individuals, has been reported by several authors (Mak & Harvey Reference Mak and Harvey1982 and references therein; Enjalbert et al. Reference Enjalbert, Dawson, Paillard, Rhoné, Rousselle, Thomas and Goldringer2011).
It is also worth noting that the frequency of EST-SSR22 (220 bp) and EST-SSR9bis (230 bp) rare alleles increased from rare in the PP to intermediate in the CCP, suggesting they could have some adaptive value. EST-SSR22 (namely Hv_gene-SSR22 in Andris et al. Reference Andris, Arias, Barthel, Bluhm, Bried, Canal, Chen, Cheng, Chiappero, Coelho, Collins, Dash, Davis, Duarte, Dubois, Françoso, Galmes, Gopal, Jarne, Kalbe, Karczmarski, Kim, Martella, McBride, Negri, Negro, Newell, Piedade, Puchulutegui, Raggi, Samonte, Sarasola, See, Seyoum, Silva, Solaro, Tolley, Tringali, Vasemägi, Xu and Zanón-Martínez2012) tags the CBF10B gene (located on the long arm of chromosome 5H, Bin 9-10). This gene is a transcription factor (TF) belonging to the C-repeat binding factor (CBF) family that has been shown to have a prominent role in cold acclimation. A cluster of six CBF genes exist in chromosome 5H, which is co-localized with a region rich in QTLs related to abiotic stress (Cattivelli et al. Reference Cattivelli, Baldi, Crosatti, Di Fonzo, Faccioli, Grossi, Mastrangelo, Pecchioni and Stanca2002; Tondelli et al. Reference Tondelli, Francia, Barabaschi, Aprile, Skinner, Stockinger, Stanca and Pecchioni2006; Francia et al. Reference Francia, Barabaschi, Tondelli, Laidò, Rizza, Stanca, Busconi, Fogher, Stockinger and Pecchioni2007). EST-SSR9bis (namely Hv_gene-SSR9bis in Andris et al. Reference Andris, Arias, Barthel, Bluhm, Bried, Canal, Chen, Cheng, Chiappero, Coelho, Collins, Dash, Davis, Duarte, Dubois, Françoso, Galmes, Gopal, Jarne, Kalbe, Karczmarski, Kim, Martella, McBride, Negri, Negro, Newell, Piedade, Puchulutegui, Raggi, Samonte, Sarasola, See, Seyoum, Silva, Solaro, Tolley, Tringali, Vasemägi, Xu and Zanón-Martínez2012) tags a TERMINAL FLOWER 1 (TFL1) barley homologue that is located on the centromeric region of chromosome 2H (Comadran et al. Reference Comadran, Kilian, Russell, Ramsay, Stein, Ganal, Shaw, Bayer, Thomas, Marshall, Hedley, Tondelli, Pecchioni, Francia, Korzun, Walther and Waugh2012).
Overall, the present data then hint at selective effects for genes and chromosome regions involved in determining plant height determination and response to abiotic stress (drought and cold). More exhaustive evidence of selection effects in the studied CCP could be obtained through the analysis of morphological traits, especially those controlled by QTLs detected as under selection in the present study, together with molecular data.
CONCLUSIONS
Although many studies have highlighted the continuously increasing need for a higher level of genetic diversity in the field, little is known about the genetic diversity that can be conserved using CCPs and their values for future breeding activities. Furthermore, their usefulness as reservoirs for genetic diversity is still a matter of debate. In early studies on heterogeneous barley populations, the experimental data suggested that the competitive elimination and differential seed production rapidly reduced the genetic diversity in mixtures (Harlan & Martini Reference Harlan and Martini1938; Suneson & Wiebe Reference Suneson and Wiebe1942) and in CCPs (Suneson Reference Suneson1956) with the remaining spectrum of diversity depending on the achievement of adaptation to the environment (Allard Reference Allard1996). However, recent evidence, mainly produced in evolving wheat CCPs, suggests that the emergence of new alleles together with temporal variable or frequency-dependent selection allows the maintenance of within-population diversity despite local genetic drift and natural selection (Rhoné et al. Reference Rhoné, Remoué, Galic, Goldringer and Bonnin2008; Enjalbert et al. Reference Enjalbert, Dawson, Paillard, Rhoné, Rousselle, Thomas and Goldringer2011). Evidence provided here for barley is in accordance with these findings.
In fact, after 13 years of multiplication, no substantial loss of alleles and a high number of different multi-locus genotypes were observed in the barley CCP studied, due to a complex interaction of factors: (i) the PP inter-crosses were selected according to their high-yield potential under a low-input management system; (ii) the CCP was then multiplied using the same management system and under the same environment of selection; (iii) the multiplication environment was not characterized by extreme conditions (i.e., mean temperature and precipitation) but variations, especially in precipitation distribution, occurred across the 13 years of multiplication; and (iv) a high number of individuals were multiplied each year. Nevertheless, evidence of evolution was provided for key genome areas known to be involved in abiotic stress response and in controlling plant height in cereals.
Therefore, heterogeneous populations produced and maintained as described in the present study can be useful in maintaining crop biodiversity in-situ and as sources of genes for breeding purposes. These findings should help in further increasing the consciousness of the utility of evolutionary populations for the conservation and enhancement of crop genetic diversity. If climate change poses an interesting challenge to plant breeders, because the breeding objectives now represent a ‘moving target’, natural selection helps to efficiently hit the centre of this target. Study of association between the molecular and the agronomic quantitative variation will further increase our knowledge of the utility of heterogeneous populations not only as experimental populations for evolutionary studies, but also as a rippled pool for gene fishing.
The research leading to these results received funding from the European Community's Seventh Framework Programme (FP7/2007–2013) under grant agreement no. 245058 SOLIBAM. Thanks are due to Isabelle Goldringer and Jérome Enjalbert for useful comments on data analysis.