I. INTRODUCTION
Thermoelectric (TE) materials have well-known potential applications in waste heat recovery, air conditioning, and refrigeration. Cooling and power generation based on TE effects have several advantages over other methods, such as absence of moving parts (vibrations are avoided), low maintenance, long life, and high reliability.Reference Riffat and Ma1 Their obvious disadvantage is their usually poor thermodynamic efficiency. The efficiency of TE devices is determined by the dimensionless figure of merit (ZT), defined as ZT = (α2/ρκ)T, where α, ρ, κ, and T are the Seebeck coefficients, the electrical resistivity, the thermal conductivity, and the absolute temperature, respectively. Unfortunately, all three (α, ρ, κ) are functions of the carrier concentration, so optimizing all the parameters together turns out to be a difficult challenge.Reference Rowe2 For design and in-use reliability of TE systems in many applications, such as heat recovery in vehicles, enhancement of the mechanical properties of TE materials is of paramount importance too, as they are brittle materials.
Nanostructuring a TE material leads to a substantial ZT enhancementReference Minnich, Dresselhaus, Ren and Chen3 because phonons are scattered at the boundaries of crystals when the phonon mean free path approaches the grain dimensions. Many studies report a significant reduction of the thermal conductivity as a result of the phonon-grain boundaries scattering.Reference Kim and Mitani4,Reference Zhang, Sharma, Lavernia and Yang5 For instance, Zhang et al. studied the effect of the grain size on the thermal conductivity of pure Bi2Te3. According to their results, the thermal conductivity at 300 K in the direction parallel to the cleavage plane (i.e., perpendicular to c axis) is 2.0, 1.4, and 1.3 W/m·K when the mean grain size is 5, 1, and 0.2 µmReference Zhang, Sharma, Lavernia and Yang5 respectively, i.e., the thermal conductivity drastically decreases for ultrafine grain sizes (≤1 µm).
Bi2Te3 has a rhombohedral structure with R3m space group; the crystal is composed of atomic layers in the order of Te(1)–Bi–Te(2)–Bi–Te(1) along the c axis. Bi–Te(2) and Bi–Te(1) bonds are ionic-covalent type, while bonding between Te(1)–Te(1) layers is due to van der Waals interaction. As a result of the weak van der Waals bonding, Bi2Te3 is easily cleaved along the c-plane, and consequently, it is an extremely brittle material. As grain refining has a toughening effect in brittle polycrystals, nanostructuring Bi2Te3 is expected to have a mechanical benefit besides its benefit on the ZT figure of merit. Similarly, the weak bonding across the Te(1)–Te(1) layers makes the c-slip very easy; nanostructuring is expected to strengthen the plastic resistance of Bi2Te3 through the Hall–Petch effect too. The elastic anisotropy of Bi2Te3 is also significant, its shear stiffness being low on its basal plane.Reference Jenkins and Rayne6 Due to the layered rhombohedral structure, the TE properties are also very anisotropic. The electrical and thermal conductivities along the cleavage plane are respectively about four and two times larger than those along the c-axis, therefore, ZT in the c-plane is approximately two times larger than along the c axis.Reference Rowe7
Crystals, which are grown by unidirectional crystal-growing, such as zone-melting, Czochralsky, or Bridgman techniques, have optimal TE properties when properly cut; nevertheless, they exhibit poor mechanical properties because the van der Waals interaction leads to the ingots being easily cleaved along their basal plane.Reference Jeon, Ha, Hyun and Shim8–Reference Jiang, Chen, Bai, Yao and Wang10 This fact is an important drawback because, first, it complicates the fabrication process of the TE modules, and second, the modules being subjected to mechanical and thermal stresses during their operation life, brittle fractures of their dies are a prominent risk. To improve the mechanical properties, bulk polycrystalline Bi2Te3 alloys are often prepared by powder/sintering methods like ball milling plus hot pressing (HP)or spark plasma sintering (SPS), although their TE properties are not as good as those of optimally oriented single-crystalline materials because of the difficulties in achieving a strong crystallographic texture via conventional powder processing.Reference Kim, Kim, Je, Ha and Kim11
High-pressure torsion (HPT) is a well-known severe plastic deformation (SPD) technique that produces ultrafine-grained (UFG) structures in bulk crystalline materials, irrespective of their initially coarse grain size.Reference Valiev, Islamgaliev and Alexandrov12 The process consists of introducing a thin disk-shaped sample between two anvils, which applies a high pressure of several GPa and rotates one of the anvils. By this way, the sample is strained under quasi-hydrostatic compression; consequently, even relatively brittle materials can be processed without fracture. This “top-down” HPT approach minimizes the introduction of either contaminants or porosity by processing at low or moderate temperature, a bulk solid material under high pressure. This fact is a significant advantage, since conventional powder sintering methods are based on producing fine powders by ball milling and then fabricate bulk materials by sintering or HP. Therefore, contamination or/and grain grown is expected during the process. The starting HPT sample can be a bulk sample or a powder compact that reaches alloying and full density under the combination of huge shear plastic deformation and high hydrostatic pressure at low or moderate temperature, which facilitates the preparation of alloys from powder mixtures without the inconveniences of more conventional powder compaction methods.
At a distance r of the HPT torsion axis in a disk of thickness t, the simple shear strain γ after N revolutions of the rotating anvil is given by:
 $$\gamma = {{2\pi rN} \over t}\quad .$$
By using a disk shaped sample, r » t, an enormous amount of plastic strain is undergone by the sample after several anvil revolutions.
In the present work, pure (undoped) Bi2Te3 disks were prepared by two different processing routes: either by powder HP sintering or by combining HP + HPT. We present here only their mechanical behavior together with their thermal conductivity, and we show that HPT is very promising for improving Bi2Te3 materials in view of their TE use. The full TE properties of HP and HPT-produced doped Bi2Te3 alloys will be the object of another publication (in preparation).
Although the TE properties of Bi2Te3 alloys have been extensively studied,Reference Kim and Mitani4,Reference Rowe7,Reference Zhao, Zhang, Liu, Zhang and Li13,Reference Hu, Liu, Xie, Shen, Zhu and Zhao14 their mechanical properties are not known in detail. Usually, their mechanical properties have been evaluated by a three-point bending method,Reference Zhao, Zhang, Li, Zhang and Liu15,Reference Böttner, Ebling, Jacquot, König, Kirste and Schmidt16 and to our knowledge, nobody has studied the anisotropy of their plastic properties. Here we have used micropillar compression testing. Since the samples processed by HP have a rather coarse grain size, single-crystalline pillars with three different orientations have been fabricated by focused ion beam (FIB) from the surface of HP samples. In the case of the HPT samples, which develop a strong fiber texture, axially oriented pillars have been fabricated on the subsurface and tangentially oriented ones on the cross-sectional surface of HPT samples. The microcompression results have been analyzed with the help of finite element (FEM) elasto–plastic simulations accounting for their real geometry.
The specimens produced by HPT are most often of reduced dimensions so that only a limited volume of material is available to perform mechanical tests. Hence micromechanical testing techniques of specimens milled by FIB are very convenient to assess the mechanical properties of our HPT specimens.Reference Uchic and Dimiduk17,Reference Volkert and Lilleodden18
II. EXPERIMENTAL
A. Materials and sample preparation
High-purity Bi2Te3 powder (99.999% Bi2Te3, <1 mm, American Elements) was used as raw material. To produce disk samples of undoped Bi2Te3, the powder was compacted by HP at 723 K under an axial compressive stress of 40 MPa in Ar atmosphere (Sintris 10STV HP press). Holding time under load was 3 min. The resulting bulk samples were 13 mm diameter and 2 mm thick disks. The graphite punches in contact with the sample were covered with a boron nitride layer to avoid any reaction with the material. After that, some HP samples were processed at 423 K by HPT under a hydrostatic pressure of 3 GPa. The disks were deformed by applying 5 revolutions with a rotational speed of 0.29 rpm. The maximum plastic shear strain applied was about 160 at the disk rim (Von Mises tensile equivalent true strain of about 90).
Other HP samples were annealed in argon atmosphere at 450 K for 48 h to allow grain growth. This annealing temperature was carefully selected high enough to permit grain growth but low enough to prevent tellurium sublimation. Because of the low vapor point (550 K at 10−4 Torr) of tellurium,Reference Kavei and Karami19 compositional changes are easily produced during annealing at higher temperatures.
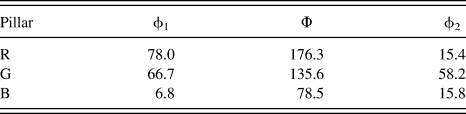
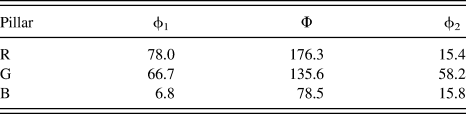
After metallographic preparation (ended by polishing with 1 μm diamond suspension followed by prolonged polishing with colloidal silica), grain size and crystal orientations were determined by electron backscatter diffraction in a JEOL JSM-7000F scanning electron microscope (Tokyo, Japan). In the case of HP samples, single-crystalline micropillars were prepared from three large grains (grains R, B, and G). Their crystallographic orientation is described by their three Euler angles (Bunge convention, Table I). The selected orientations were expected to show large differences in mechanical behavior. The (0001) plane of grain R is nearly parallel to the disk plane (see Fig. 6), whereas the [0001] direction of grain G is not far from normal to the disk axis, and that of grain B is tilted about 45° from the disk axis.
Crystallographic orientations of the micropillars. Euler angles, Bunge convention.
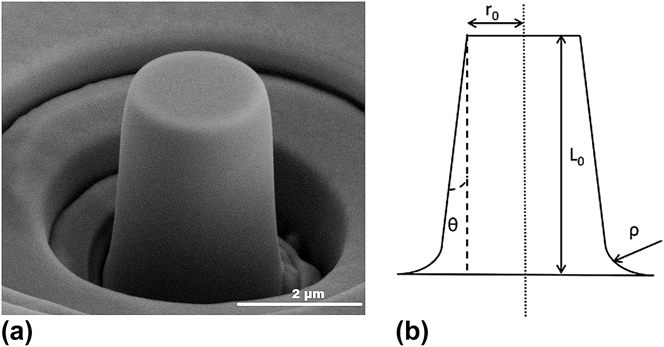
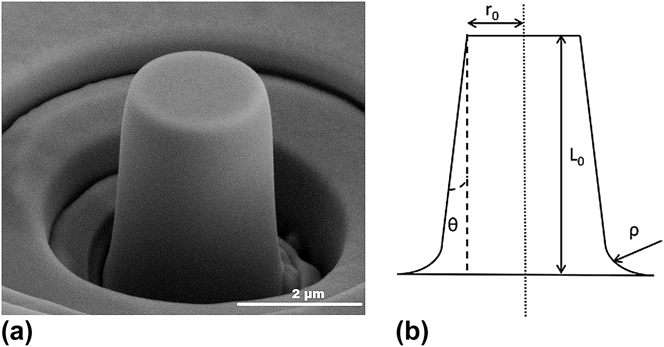
The micropillars were fabricated by a FEI Quanta 3D dual beam microscope FIB/field emission gun (Hillsboro, OR) scanning electron microscopy (FEG-SEM) by a two-step process as described by Volkert and LilleoddenReference Volkert and Lilleodden18: first, the surface of the bulk sample was oriented normal to the FIB gun, and using concentric annular patterns, a cavity of 20 μm in outer diameter leaving a cylinder of inner diameter of 8 μm was carved. The purpose of machining such a large cavity was to ensure no contact of the flat indenter tip with any other surfaces than the micropillar. In second step, the beam current was progressively reduced as decreasing the pillar diameter. So when we finished with the milling process, we got several pillars of approximately 2 μm in diameter and 4.5 μm in height. The aim of reducing the beam current was to minimize Ga+ ion damage, material redeposition, and taper angle of the pillars; the final step was performed using an accelerating beam voltage and a bean current of 30 kV and 10 pA, respectively. As a result, the taper angle of the pillars was approximately 5.5° (Fig. 1). It is well-known that the mechanical properties of the micropillars could be affected as a result of the Ga+ ion bombardment. The milling was performed at high-incident angles, which reduces the thickness of the damaged layer.Reference Mikmeková, Matsuda, Watanabe, Ikeno, Müllerová and Frank20 However, many reports show that for different soft metals, such as copper or magnesium, the affected layer is less than ∼20 nm when the milling is performed at high-incident angles and using an accelerating voltage of 30 kV.Reference Mikmeková, Matsuda, Watanabe, Ikeno, Müllerová and Frank20,Reference Kiener, Motz, Rester, Jenko and Dehm21 Rubanov and MunroeReference Rubanov and Munroe22 reported that the side walls of FIB-milled silicon trenches at 30 kV revealed very uniform amorphous layers, which were about 30 nm in thickness. The damaged layer can contain point defects, dislocations, and Ga-based precipitates, which may increase the flow stress.Reference Kiener, Motz, Rester, Jenko and Dehm21,Reference Soler, Molina-Aldareguia, Segurado, Llorca, Merino and Orera23 The ion damage should not be very significant for HPTed samples, since SPD processing results in a high density of crystal lattice defects.Reference Zhilyaev and Langdon24 Thus, for specimens of micrometer size, the ion damage contributes only in a minor way, since the affected layer is small compared with the pillar volume; however, for submicrometer samples, this artifact can become significant.Reference Kiener, Motz and Dehm25
(a) A 2 μm diameter microcompression sample machined into a Bi2Te3 single-crystal. (b) Scheme of the approximate geometry for FIB-milled microcompression sample.
The few studies that exist up to date on the application of the micropillar compression test to multilayered materials suggest that when the behavior is dominated by a characteristic length scale (the layer thickness) smaller than the sample dimensions, then the results are independent of the pillar diameter.Reference Li, Mara, Wang, Nastasi and Misra26–Reference Greer and De Hosson29 Since the grain size of HPT samples is close to 200 nm, no plastic size effect is expected for polycrystalline samples. In contrast, single-crystal micrometer-sized pillars may present an important size effect; the measured compressive strengths, therefore, should be considered as an upper bound of the actual strengths of single-crystalline Bi2Te3.
B. Microcompression tests
Micropillars were tested ex situ in uniaxial compression using a commercial nanoindentation system (TriboIndenter™, Hysitron, Minneapolis, MN). The compression tests were carried out using a flat diamond tip of 2.5 μm in diameter. Thanks to the contact scanning mode imaging technique of the nanoindentation system, the indenter tip was accurately centered on the pillar.
To transform the raw load–displacement data, either experimentally obtained using the nanoindenter or calculated by FEM modeling into a stress–strain curve, we have used the procedure described by Greer et al.Reference Greer, Oliver and Nix30
For each orientation, at least four pillars were tested until a nominal compressive strain of 5% or until failure under a constant displacement rate of 10 nm/s (i.e., at a nominal equivalent strain rate of 2.2 × 10⁻³ s−1). After that, the load–displacement data were corrected taking into account the machine compliance. Then, the stress–strain curves were either estimated by using an analytical approximation or by comparison with FEM calculations using the real geometry of the pillar and trying to reproduce the elastic slopes and the plastic strength level with a set of tentative material parameters taken from a matrix of flow stresses and several angles of inclination between the top sample surface and the flat tip of the indenter, as explained below.
C. Microhardness and nanoindentation tests
To have an insight on the overall mechanical properties, additional microhardness and nanoindentation tests were carried out on the surfaces of the disks. To account the strain-dependence hardness of HPT samples [Eq. (1)], Vickers hardness (load 1.96 N) measurements were performed along the diameter of the disk. Moreover, at the disk rim (i.e., at maximum imposed shear strain), nanoindentation test, with 40 indentations per load (maximum load 1 and 8 mN, respectively) was performed to assess both, Young's modulus and nanohardness, by the technique proposed by Oliver and Pharr.Reference Oliver and Pharr31
D. Measurement of thermal conductivity
Thermal diffusivity coefficient (D) of the disk-shaped samples was measured as a function of temperature along the axial direction by the laser flash technique (by means of equipment Netzsch LFA 427, Selb, Germany). Square samples of ∼10 × 10 × 1.5 mm3 were cut from the disk samples. Density (d) was measured at room temperature by water immersion technique (Archimedes' method). The thermal expansion of Bi2Te3 was taken into account for calculating the density in all the considered temperature range by using the equation proposed by Pavlova et al.Reference Pavlova, Shtern and Mironov32 The specific heat (C p) was estimated according to the literature,Reference Landolt, Börnstein, Hellwege, Clasen, Schulz, Weiss and Madelung33 and it was in good accordance with indirectly derived values using a Pyroceram 9606 standard. The thermal conductivity (κ) was then calculated as κ = DC pd.
III. FEM SIMULATIONS
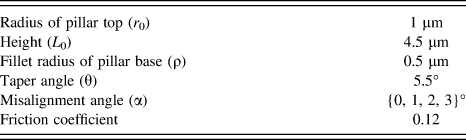
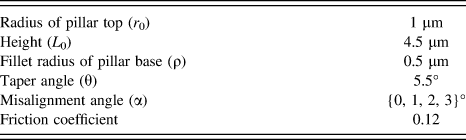
FEM simulations of the mechanical response of micropillars were performed to study the influence of contact misalignment between the pillar top surface and the indenter tip. The real pillar geometry was approximated by assuming a taper angle of 5.5° and a fillet radius of 0.5 µm (see Fig. 1), on account of measurements taken on the real pillars milled by FIB. All simulations have been performed using ABAQUS/Standard 6.13-3. In the model, anisotropic elastic behavior and rate-independent elastic–plastic behavior have been assumed. The six independent elastic constants, C 11, C 66, C 33, C 44, C 13, and C 14, that define the anisotropy of a trigonal crystal system, were taken from the literature.Reference Jenkins and Rayne6
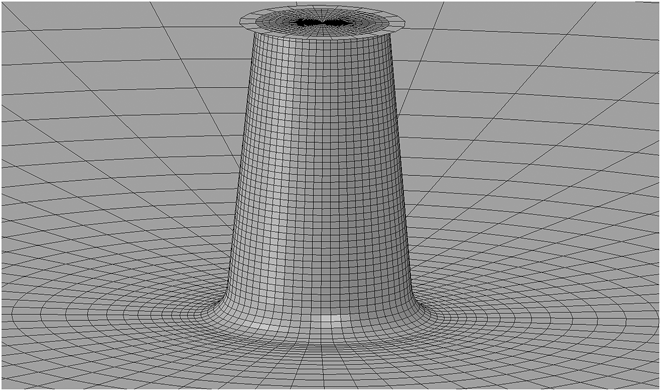
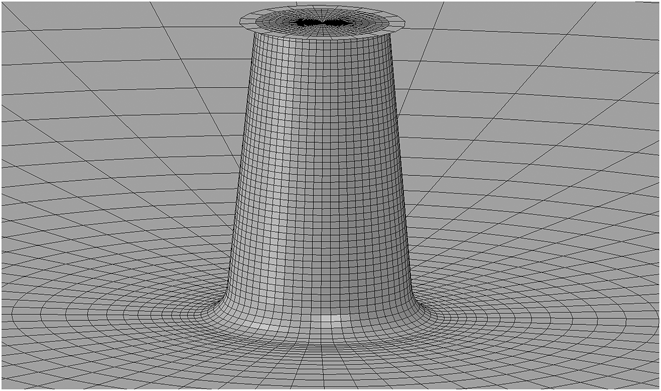
To understand the influence of experimental uncertainties, pillar–indenter tip misalignment was systematically varied from 0° up to 3°. The size of the substrate was large enough to neglect edge effects on the calculated results. Figure 2 shows the 3D scheme. The indenter tip was modeled as a rigid surface. Coulombian friction, with a friction coefficient of 0.12, was assumed to model the contact between the pillar top surface and the flat indenter tip; the friction coefficient between diamond and a well-polished metallic surface is typically between 0.1 and 0.15.Reference Spear34 The geometrical parameters used in the simulations are summarized in Table II. The misalignment degree (α) has been quantified as the angle between the pillar axis and the normal axis of the rigid surface. For model discretization, eight-node linear hexahedron elements (C3D8R) with reduced integration were used.
Scheme and FEM discretization used in the FEM simulations.
Range of parameters explored in the FEM simulations.
IV. EXPERIMENTAL RESULTS AND DISCUSSIONS
A. Structure and crystallographic texture
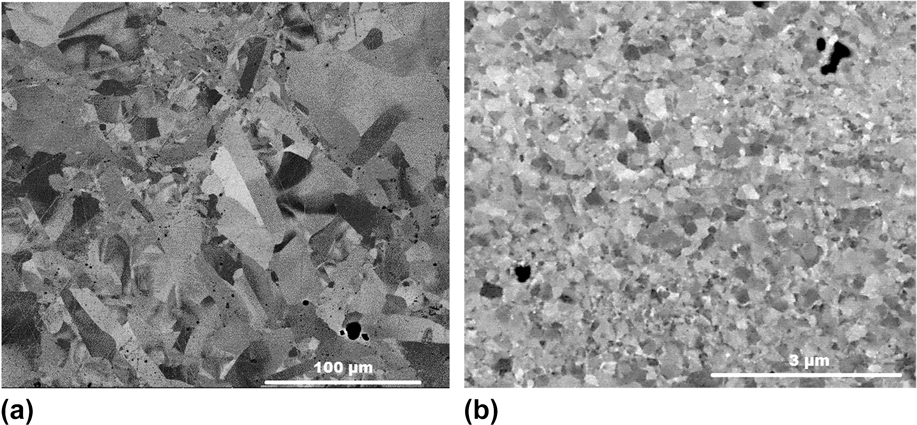
The HP samples show a polycrystalline structure with coarse grain size [20 ± 3 μm mean linear intercept, Fig. 3(a)].
FEG-SEM images of disk subsurfaces: (a) HP sample (100 µm scale bar). (b) HPT sample, disk rim after 5 revolutions at 150 °C (3 µm scale bar).
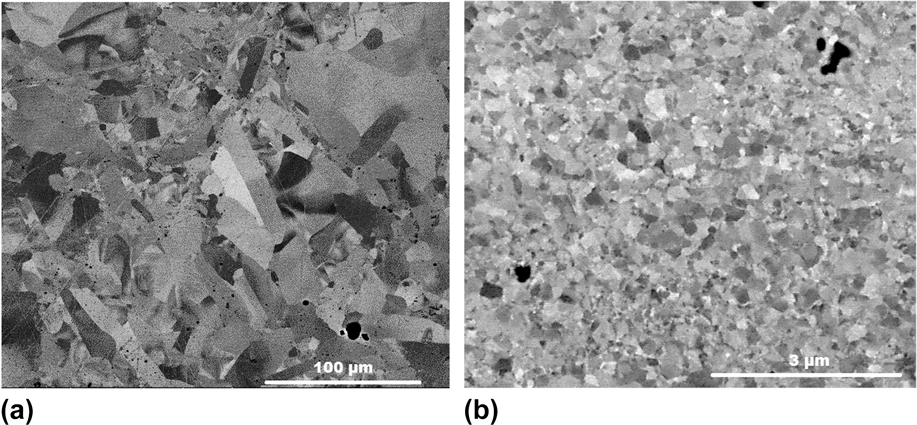
After HPT, the grains appear equiaxed on the shear plane, and their size distribution is narrow [Fig. 3(b)]. The mean grain size has been extraordinarily reduced from tens of micrometers (HP samples) to the submicrometer level (∼200 nm). The samples have a very strong (0001) fiber texture (basal plane normal coincident with the normal to the disk plane, Fig. 4). Such a texture is to be expected from the easy glide on the (0001) plane; it is observed, for instance, after HPT of hexagonal close packed (HCP) metals like Zn where glide on the basal plane is preferred to prismatic or pyramidal glide systems.Reference Zühlke35,Reference Srinivasarao, Zhilyaev, Langdon and Pérez-Prado36
0001 and  $11\bar 20$ pole figures of HPT sample. The pole figure is projected on the disk plane of the sample. A very strong 0001 fiber textured is observed.

B. Microcompression of single-crystalline pillars
In Fig. 5, the engineering stress–strain curves of the three different crystallographic orientations are shown, together with images of pillars after the tests. At least four individual samples have been tested per orientation. Substrate compliance must be properly accounted to assess analytically the Young modulus. Such substrate compliance can be estimated using an analytical approach proposed by SneddonReference Sneddon37 to compute the depth of penetration of a rigid circular flat punch indenting an isotropic elastic half space.
Engineering stress–strain curves and SEM images of deformed micropillars for the studied 3 orientations. (a, b) G orientation, (c, d) B orientation, and (e, f) R orientation.
On the basis of the equation proposed by Sneddon and taking into account the actual geometry of each tested pillar (Fig. 1), we have used the following equation:
 $${C_{{\rm{sneddon}}}} = {{1 - {\nu ^2}} \over {2E\left[ {{a_{\rm{c}}} + {L_0}\tan \left( \theta \right)} \right]}}\quad ,$$
where, ν is the Poisson ratio, E is the elastic modulus, L 0 is the initial length of the pillar, and a c is the contact radius, [a c = η(r + ρ)]; η is the constant proposed by Zhang et al.,Reference Zhang, Schuster, Wei and Ramesh38 which takes into account the actual geometry of the pillar–substrate connection. By comparison with FEM simulations, setting η = 1.53 delivers the best results. Prior to testing, the top radius (r) of each pillar was measured by SEM. The top surface was placed normal to the electron gun to determine r by the mean of the measured two diameters. After that, we tilted the sample until we observed the base of the pillar; at this point, we were able to measure accurately the initial length of the pillar (L 0). Finally, two pillars were cross-sectioned to measure the fillet radius (ρ) and base radius (r b) as suggested by Lilleodden.Reference Lilleodden39 The pillar stiffness is calculated by subtracting Sneddon compliance from the compliance measured in the elastic zone of the load–displacement curve:
 $${S_{{\rm{pillar}}}} = {1 \over {{C_{{\rm{measure}}}} - {C_{{\rm{Sneddon}}}}}}\quad .$$
Therefore, the Young modulus of a pillar with a taper angle of θ can be estimated by:
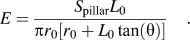 $$E = {{{S_{{\rm{pillar}}}}{L_0}} \over {\pi r{_0}\left[ {r{_0} + L{_0}\tan \left( \theta \right)} \right]}}\quad .$$
As it is evident from Figs. 5(a), 5(e) and 8, the initial elastic loading slopes differ significantly from the unloading slopes. The reason for this difference is the effect of the initial misalignment between the pillar and the substrate. FEM calculations show that this effect is very strong on the initial, elastic, loading slope. The results show that a misalignment angle of 2° better fits the experimental results obtained. This misalignment, however, is not critical for the unloading case, since plastic deformation of the pillar in the neighborhood of the contact zone promotes a correct surface alignment, as it will be shown below.
1. Elastic modulus
Figure 6 shows the Young's modulus contour plot of Bi2Te3 at 300 K constructed from the single-crystal elastic constants measured by Jenkins and Rayne.Reference Jenkins and Rayne6 The plot makes evident the strong elastic anisotropy of Bi2Te3. The elastic modulus ranges from 31.5 MPa [along (0001)] to 86.3 GPa. The values calculated for the orientations of micropillars R, B, and G are 31.7, 34.9, and 37.9 GPa, respectively (see Table III).
Contour plot (stereographic projection) of the Young's modulus of Bi2Te3 at 300 K calculated based on the elastic constants measured by Jenkins.Reference Jenkins and Rayne6
Analytically expected Young's modulus of simulated pillars using the Sneddon's correction without and with a misalignment degree of 2° (E mis0° and E mis2°). Experimentally obtained modulus calculated using the loading (E load) and unloading (E unload) slope. Apparent yield stress measured using the 0.2% offset method (σy0.2%).
a Reuss average.
The apparent elastic moduli obtained from the loading slopes of the microcompression tests by applying Eq. (5), i.e., considering Sneddon's correction and actual geometry of the pillars14 ± 3, 11 ± 2, and 13 ± 3 GPa for, respectively, R, B, and G orientations, are in good accordance with the apparent elastic modulus calculated by FEM with 2° of misalignment angle, but they are well below the expected Young's modulus (see Fig. 6 and Table III). This confirms the strong effect of small misalignments on the experimental elastic loading slopes. However, the elastic moduli calculated from the unloading slopes fit perfectly with the expected values according to Table II (orientations R and G). Unfortunately, in the case of single-crystal pillars with B orientation, premature catastrophic fracture did not permit a correct measurement of the unloading curve.
2. Plastic response and failure
In Fig. 7, the measured stress–plastic strain flow curves for the three orientations are shown (the apparent elastic strain has been subtracted from the total strain). The superposed dashed lines correspond to simulations assuming the actual geometry and an ideal plastic behavior (the apparent plastic strain hardening is a consequence of the taper angle). Two facts stand out: the big plastic anisotropy of Bi2Te3 and the different behaviors of orientation, R, with respect to orientations G and B.
Plastic stress–strain curves of the three orientations. Red color corresponds to R orientation, green color to G, and blue color to B. The dashed lines correspond to FEM simulations assuming an ideal plastic behavior.
As for the anisotropy, the yield strength of the three crystals scales inversely with the angle between their [0001] direction and the compression axis, a confirmation that the basal plane is an easy glide plane. FEM analyses suggest yield stresses of about 320, 270, and 150 MPa, respectively for R, G, and B orientations. After an initial short period of strain hardening, the flow stresses of the three crystals reach a rather constant value of their flow stresses amounting to about 550, 350, and 200 MPa, respectively, for the R, G, and B orientations. Crystal B suffers a plastic collapse after several episodes of localized (0001) basal slip as shown in Fig. 5(d); in the stress–strain response, Fig. 5(c), the repeated relaxations should correspond to the successive slip avalanches. In crystal G, slip on the (0001) plane is very difficult as the normal to this easy glide plane and the compression axis form an angle of 80°; the G micropillars undergo a rather uniform plastic deformation at nearly constant stress, Fig. 5(a), until basal cleavage occurs, Fig. 5(b); no external signs of the active plastic mechanisms are evident in the surface of the broken micropillar. Nonbasal slip or twinning is most probably taking place in crystal G. Finally, in crystal R, the basal (0001) plane normal is nearly parallel to the compression axis, i.e., again basal slip is not favored, and other plastic mechanisms must be activated; each relaxation by a plastic event of this crystal (partial unloading) is followed by a strong hardening increment, in contrast with the behavior of the two other crystal orientations; nonbasal slip or rhombohedral twinning could be happening here too. In fig. 5(f), a nonbasal slip band or crack compatible with the angle between the  $\left( {0\bar 112} \right)$ plane and the basal one (57.6°) is crossed by a short cleavage propagation on the basal plane. It is to be noted that a very small deviation from the ideal [0001] orientation (here such deviation is approx. 4°) allows for basal slip to occur in Mg,Reference Kelley and Hosford40 i.e., such basal cleavage could have been triggered by a burst of basal slip associated to the passage of the nonbasal slip band or crack.
C. Microcompression of UFG pillars (HPT material)
In the case of HPT samples, since during the SPD process, a very strong (0001) fiber texture is developed, UFG polycrystalline micropillars were machined on the disk surface (S) and on its cross section (CS) of the disk-shaped samples in tangential direction. The obtained stress–strain curves are plotted in Figs. 8 and 9. As expected, because of the strong basal texture, the elastic moduli are quite similar for the two orientations, but their plastic strengths are very different.
Engineering stress–strain curves of the UFG pillars. Black color corresponds to S orientation and magenta color to CS.
Plastic stress–strain curves of the UFG pillars. Black color corresponds to S orientation and magenta color to CS. The dashed lines correspond to FEM simulations assuming an ideal plastic behavior. In the case of S orientation, a strong strain hardening is observed, while in CS orientation, a softening behavior is observed.
1. Elastic modulus
In the case of the HP + HPT samples, to estimate the Young's modulus based on the elastic constants measured by Jenkins, a perfect fiber texture was considered with grains of (0001) planes perfectly parallel to the disc plane and randomly rotated around their common [0001] direction. The calculated surface values (S) and cross-sectional values (CS) were 31.5 and 43.2, respectively; (Reuss average).
The estimations based on the experimental stress–strain curves agree very well with the values expected from the measured texture. The elastic moduli, after the Sneddon correction of the experimental stress–strain slope and accounting for the actual geometry, are 32 ± 2 and 43 ± 2 GPa for, the S and CS samples, respectively. Such agreement gives confidence on the validity of the analysis of the plastic flow stress that follows below.
2. Plastic response and failure
The apparent yield stresses (0.2% offset method) for S and CS orientations are 590 ± 30 MPa and 390 ± 20 MPa, respectively. The actual corresponding yield stresses according to FEM analysis assuming perfect plastic behavior beyond the yield stress (no plastic strain hardening) would be 500 ± 30 and 340 ± 20 MPa (Table III). The orientation S, with most of its grains with the c axis axially oriented, shows much work hardening after yield, as it occurred with its single-crystal counterpart, R, of <0001> axial orientation.
A comparison with the strengths of the single-crystalline micropillars suggests significant Hall–Petch strengthening effect obtained from grain refinement. Single-crystalline pillars with B orientation provide with a measure of the critical resolved shear stress (CRSS) for the basal slip system: as the assumed slip plane is tilted 45° from the pillar axis, a lower bound (because of our ignorance on the orientation of the slip direction), although very close to the actual value of such CRSS (on account of the symmetry of the basal plane), is a half of the measured compressive yield or flow stress (Sec. IV. B. 2, above), i.e., 75 MPa at yield and 100 MPa at saturation, respectively. Similarly, the results of pillars with G or R orientation furnish an estimation for the CRSS of the hard, nonbasal slip, or twinning systems; assuming again an orientation factor of 2 (it will provide us now with an upper bound), the CRSS of the hard systems is estimated to be 160 MPa at yield and 275 MPa at saturation. If there was any effect of grain size, one would expect for the yield stress of polycrystalline pillars to be between 150 MPa (basal slip, softest orientation) and 480 MPa (hard slip or twinning systems, random orientation with a factor of 3). The actually measured values range from 390 to 590 MPa. As the measurements of the yield or flow stresses of the single crystals or polycrystals have been obtained from micropillars of the same size, such strengthening is only attributable to a Hall–Petch type effect and not to some micropillar size effect. The same conclusions are derived if the saturation stresses of both materials are compared.
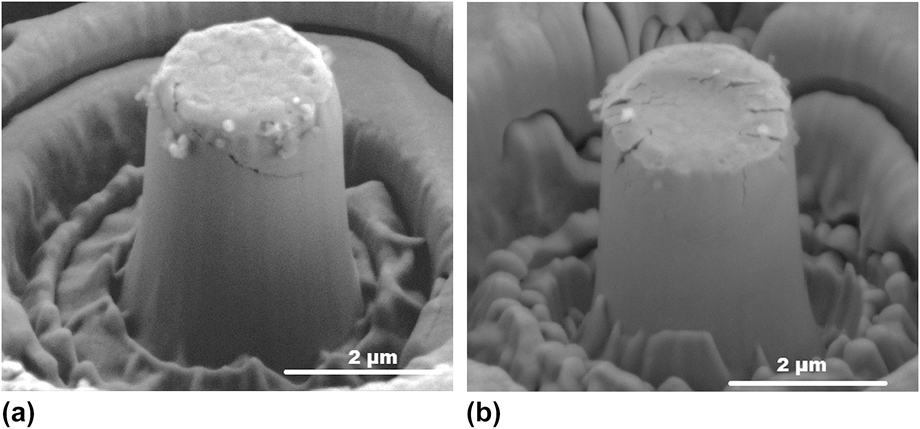
After the compression tests, Fig. 10, the polycrystalline micropillars show microcracks below the contact zone, oriented parallel to the axis in the CS specimen and tilted a small angle with it in sample S, in both cases as expected from the preferred orientation of the cleavage planes in their grains. Comparing Figs. 5(b) and 10(b), the toughening effect of the nanostructuration of Bi2Te3 by HPT is evident; the microcracks in sample CS have not propagated catastrophically as in single crystalline sample G, Fig. 5(b).
FEG-SEM images of the UFG pillars after performing the microcompression test: (a) S orientation and (b) CS orientation.
D. Additional mechanical characterization: Hardness and indentation toughness
Additional mechanical characterization has been performed by using Vickers hardness (200 g) and nanoindentation. The Vickers hardness furnishes an estimation of the critical stress intensity factor for crack propagation, K IC, because crack propagation from the corners of the Vickers imprints was observed and measured.
The Vickers hardness increases from about 600 MPa for the undeformed HP samples to 1300 MPa for the HPT severely deformed ones (Fig. 11), i.e., again the strong effect of nanostructuring is confirmed. Note that, although the imposed shear strain is null in the center of HPT, all the samples are subjected to compression, and therefore, strain hardening is also expected in the center of the disk. The hardness values of HP samples are in accordance with those published for single-crystalline or polycrystalline Bi2Te3-based alloys (200–620 MPa).Reference Zhao, Zhang, Li, Zhou, Liu and Liu41,Reference Kim and Hong42
Vickers hardness against imposed equivalent torsional strain for HPTed sample.
Multiple cracking around the Vickers indentations was observed around the indentations in the HP samples; the cracks emanate not only from the diagonals of the indentations, suggesting high brittleness and precluding any quantitative calculation of the toughness. By contrast, only cracking from the indentation corners was observed after HPT, and the propagation was short and with some branching; assuming the cracks to be median cracks and employing the classical formula proposed by Niihara et al. for median cracks,Reference Niihara, Morena and Metals43 a value of K IC = 1.15 ± 0.05 MPa m1/2 is obtained. This value is similar to the toughness for a fine grain Bi2Te3 obtained by SPSReference Zhao, Zhang, Li, Zhou, Liu and Liu41 and significantly higher than the measured one in other promising TE materials, such as PbTe-based alloys and filled skutterudites.Reference Ni, Case, Khabir, Stewart, Wu, Hogan, Timm, Girard and Kanatzidis44,Reference Eilertsen, Subramanian and Kruzic45
Nanoindentation test suggests that there is a size effect. Nanohardness of HPT samples measured with 1 mN load is slightly higher than the hardness measured with 8 mN, 2.344 ± 0.02 GPa and 2.104 ± 0.06 GPa, respectively, and both are much higher than the Vickers microhardness. This effect has been repeatedly observed in many different materials, and it has been attributed to the strong strain gradients at small indentations that promote a high density of geometrically necessary dislocations.Reference Nix and Gao46,Reference Alkorta, Martínez-Esnaola and Gil Sevillano47
The Young’s modulus of Bi2Te3 has also been extracted from the nanoindentation tests. Mean values of 34 ± 4 GPa and 48.0 ± 0.5 GPa have been obtained for the HP and HPT materials, respectively. The higher value of HPT can be attributed to its higher density (relative density of HP and HPT samples ∼97.0 and 99.9%, respectively). The Young’s modulus of HPT sample is of the order of the isotropic modulus that can be calculated from the single-crystal elastic constants calculated by Jenkins (50.39 GPa, averaging the Voigt and Reuss modulus).Reference Jenkins and Rayne6 Although it seems that porosity decreases in the same way the electrical and thermal conductivity,Reference Yang, Wu and Zhang48 it does not affect notoriously to ZT. However, it is well-known that degrades significantly the mechanical properties.
E. Influence of HPT on thermal conductivity
As expected, the grain refinement reduces significantly the thermal conductivity, (Fig. 12). Comparing to the coarse grains polycrystalline samples (HP) after HPT, the thermal conductivity is reduced up to 50% obtaining a good experimental reproducibility. The grain refinement should lead to a substantial ZT enhancement. Achieving a strong (0001) fiber texture also plays an important role in improving ZT. Since the TE properties of Bi2Te3 are very anisotropic, to improve ZT is necessary to get a preferential crystal orientation (ZT in the c-plane is approximately two times larger than along the c axis).Reference Rowe2 We have proven that HPT enables to get simultaneously an ultrafine grain size and a preferred crystal orientation. This fact is not easy to achieve via conventional powder processing techniques. First, because it is quite difficult to orient preferentially particles smaller than 5 µm,Reference Zhang, Sharma, Lavernia and Yang5,Reference Kim, Kim, Je, Ha and Kim11 and second, because during consolidation process at moderate temperature, grain grown is expected. Note that, in this work, we studied the effect of HPT on the mechanical properties and on the heat transport of pure Bi2Te3. It is well-known that alloying Bi2Te3 with Sb2Te3 (p-type conduction) or Bi2Se3 (n-type conduction) leads to optimizing the carriers concentration and reduce the thermal conductivity as proposed Ioffe. The production of solid solutions with isoelectronic elements generates disturbances in the short-range order, which contributes to reducing the thermal conductivity without affecting the mobility of the free charge carriers, since the long-range order is preserved.Reference Julian Goldsmith49,Reference Xie, Wang, Zhu, He, Tang, Zhang and Tritt50 However, plastic deformation produces nonbasal slip in Bi2Te3-based alloys, which could generate excess negative carriers (called donor like effect), changing the optimum carrier concentration.Reference Schultz, McHugh and Tiller51,Reference Navrátil, Starý and Plechácek52 Therefore, for HPT processing, the optimum stoichiometry, which will lead to the best ZT is not known yet and requires further investigation. For instance, Hu et al.Reference Hu, Zhu, Liu and Zhao53 have showed that the optimum composition is shifted to a higher Sb content for the polycrystalline samples produced by hot press and subsequent hot deformation process due to the deformation induced donor-like effect.
Temperature dependence of thermal conductivity for HP (blue squares) and HPT (red squares) samples.
V. CONCLUSIONS
(1) The mechanical properties of Bi2Te3 TE materials have been assessed by performing conventional hardness tests and microcompression tests of pillars of 2 µm of diameter. The pillars were milled from coarse grain or ultrafine grain material. The former was made by HP of powder, and the latter was obtained by large strain HPT of the HP material.
(2) Both materials show important mechanical anisotropy [the polycrystalline sample deformed by HPT shows a very strong (0001) texture]. With an analysis mediated by FEM, the microcompression tests provide elastic moduli coincident with the predictions of calculations taking into account, in each case, the specimen orientation or texture. Their plastic anisotropy is mainly dictated by the inclination of their basal planes with the compression axis.
(3) Grain refining of Bi2Te3 below the micrometer, besides its benefit for TE application (a significant decrease of the thermal conductivity), significantly improves its strength and toughness.
ACKNOWLEDGMENTS
Financial assistance from the Spanish Ministry of Industry, Energy and Competitiveness (MINECO) under the project MAT2010-17958, from the Basque Government, Dept. of Education, action EC2013-06 and from BELSPO, under the Belgian Federal Interuniversity Attraction Poles Program, INTEMATE project, IAP P7/21 is gratefully acknowledged. JAS acknowledges support from MINECO through an FPI grant.