Introduction
Visual perception in honeybees and goldfish has been investigated in detail using behavioral methods. Both systems reveal important similarities, despite their independent evolution over many millions of years. Honeybee (Apis mellifera) and goldfish (Carassius auratus) possess excellent trichromatic or tetrachromatic color vision, respectively, as shown in additive color mixture experiments (Daumer, Reference Daumer1956; Neumeyer, Reference Neumeyer1985, Reference Neumeyer1992) and in measurements of wavelength discrimination (von Helversen, Reference Helversen1972; Neumeyer, Reference Neumeyer1986). Using object colors, both species reveal extremely fine color discrimination abilities (Dyer & Neumeyer, Reference Dyer and Neumeyer2005), especially in experiments showing simultaneous color contrast (Neumeyer, Reference Neumeyer1980; Dörr & Neumeyer, Reference Dörr and Neumeyer1997) and color constancy (Neumeyer, Reference Neumeyer1981; Dörr & Neumeyer, Reference Dörr and Neumeyer2000; Neumeyer et al., Reference Neumeyer, Dörr, Fritsch and Kardelky2002). In motion vision, the similarities are even more striking. For example, using the optomotor response as an indicator for motion vision, in insects and lower vertebrates, it was found that only one photoreceptor type is involved, the “green” retinula cell in honeybees (Kaiser & Liske, Reference Kaiser and Liske1974), R6 both in blow fly Phormia and in Drosophila (Kaiser, Reference Kaiser1968; Yamaguchi et al., Reference Yamaguchi, Wolf, Desplan and Heisenberg2008), and the L cone in goldfish, zebrafish, and turtle (Schaerer, Reference Schaerer1993; Schaerer & Neumeyer, Reference Schaerer and Neumeyer1996; Krauss & Neumeyer, Reference Krauss and Neumeyer2003). In all these cases, it is the photoreceptor type sensitive to the longest wavelengths. Accordingly, the animals behave as if they were “color blind” and do not respond, unless this photoreceptor is modulated by the moving pattern. The functional significance of this “color blindness” of the optomotor response can be seen in the context of the motion detectors proposed by Hassenstein and Reichardt (Reference Hassenstein and Reichardt1956). According to this model, the signals of adjacent photoreceptor channels are compared in a manner corresponding mathematically to an autocorrelation. Living in a “colorful” world, it is obvious that maximum correlation will be achieved only if the two photoreceptors are of the same spectral type (Srinivasan, Reference Srinivasan1985). Thus, separate processing of “color” on the one hand and “motion” on the other seems to be a general property of visual systems, discussed originally for the visual system of primates (reviews: Livingstone & Hubel, Reference Livingstone and Hubel1988; Zeki & Shipp, Reference Zeki and Shipp1988).
Motion vision investigated in the optomotor response requires a stimulation of large parts of the visual field. In the classical case, the animal is fixated in the middle of a striped moving drum. The biological significance of this reflex-like behavior is to stabilize the position in space either when the animal has been passively turned or during self motion. In honeybees, for example, this kind of “wide-field” stimulation by optic flow is important for flight control and for gauging the distance between feeding site and hive (Srinivasan & Zhang, Reference Srinivasan, Zhang, Chalupa and Werner2004, for review). In contrast, the relative movement between image of an object and background can be called “small-field” or “object” motion. It provides information about distances between surfaces due to motion parallax and is involved in object detection tasks (Nakayama, Reference Nakayama1985, for review). In the function of detecting moving objects, it seemed not very likely that this type of motion vision should be “color blind” as well. However, in a previous study with goldfish, we found that this is the case. In contrast to wide-field motion measured in the optomotor response, object motion is mediated by the M cone and not by the L-cone type (Gehres & Neumeyer, Reference Gehres and Neumeyer2007). As in these experiments the stimulus was moving with a relatively high mean velocity of 7 cm/s, we wondered if goldfish would behave “color blind” with slower stimulus velocities as well.
In this current study, we investigated (1) whether color blindness of small-field object motion can also be found in the honeybee and (2) whether color blindness of small-field object motion depends on image velocity in honeybee and goldfish.
I. Honeybee experiment
Materials and methods
Rationale of the experiment
To investigate whether color information is involved in object motion vision, freely flying honeybees were trained to discriminate between three disks, two rotating clockwise and one counterclockwise or vice versa. The sectors of these disks provided either a high green receptor contrast, or this contrast was reduced until green receptor modulation was at minimum. Three different velocities were tested, corresponding to contrast frequencies of 6, 12, and 24 Hz (see below).
Animals and experimental site
The experiments were performed outdoors from the end of July to mid-October 2009 in Mainz, Germany with Apis mellifera carnica. Experiments were conducted 20 m from the hive and 6 m from a feeding station where bees collected 5–10% sucrose solution.
Setup
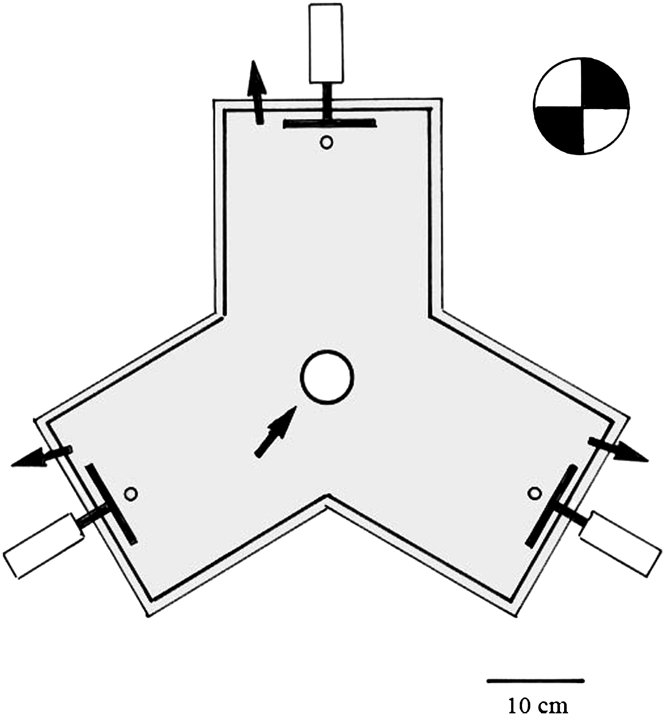
Each of the three identical disks was presented in one of the three arms in a maze with three equal arms (20 × 21 × 19 cm). This “trimaze” (Fig. 1) was made of gray 10-mm thick PVC plastic. The maze was sitting on a horizontal turntable to prevent orientation on either spatial or celestial cues. Each stimulus disk was 9.5 cm in diameter and contained four 90 deg sectors. The disks were driven by an electromotor (Dunker, Bonndorf, Germany, GR 42 25) and a custom made three-channel speed controller, so that speed and direction (clockwise or counterclockwise) could be adjusted. Two of the stimuli rotated in one direction and one in the opposite direction. All three disks rotated with the same speed in a given experiment, and so the only available cue to solve the visual task was direction of rotation. The velocity was 3, 6, and 12 rotations/s (values established in initial pilot experiments), corresponding to contrast frequencies of 6, 12, and 24 Hz taking into consideration the four sectors with two contrast transitions. Velocity was measured with a digital phototachometer (Voltcraft, Conrad, Germany, K07604) before and after each experiment. The trimaze was covered by ultraviolet (UV) transmitting perspex (Röhm, Germany, GS 2458). To prevent reflections and shadows, the entire setup was shielded by a white sunscreen. The bees entered the maze from above through a round opening (5 cm diameter) in the perspex plate above the center of the maze (Fig. 1). Thus, from the mid of the trimaze, the stimulus subtended a visual angle of 20 deg, which is large enough to allow processing of color information (Giurfa et al., Reference Giurfa, Vorobyev, Kevan and Menzel1996). Reward of a small drop of 25% sugar water was presented on a vertical perspex rod (12 mm diameter, 7 cm high) 2 cm in front of the correct disk; water was given on the rods in front of the two disks rotating in the opposite direction.
Top view of the “trimaze” used in the honeybee experiment. The bee flies into the maze through a hole in the center of the covering perspex (arrow). Inside the maze, the bee has to land on a perspex rod in front of each of the three rotating disks. After each landing (choice), the bee is released from the maze (arrows). Two of the three equal disks are rotating clockwise and one counterclockwise or vice versa. The bees were trained on the disk showing the single rotation direction (see text).

Stimuli
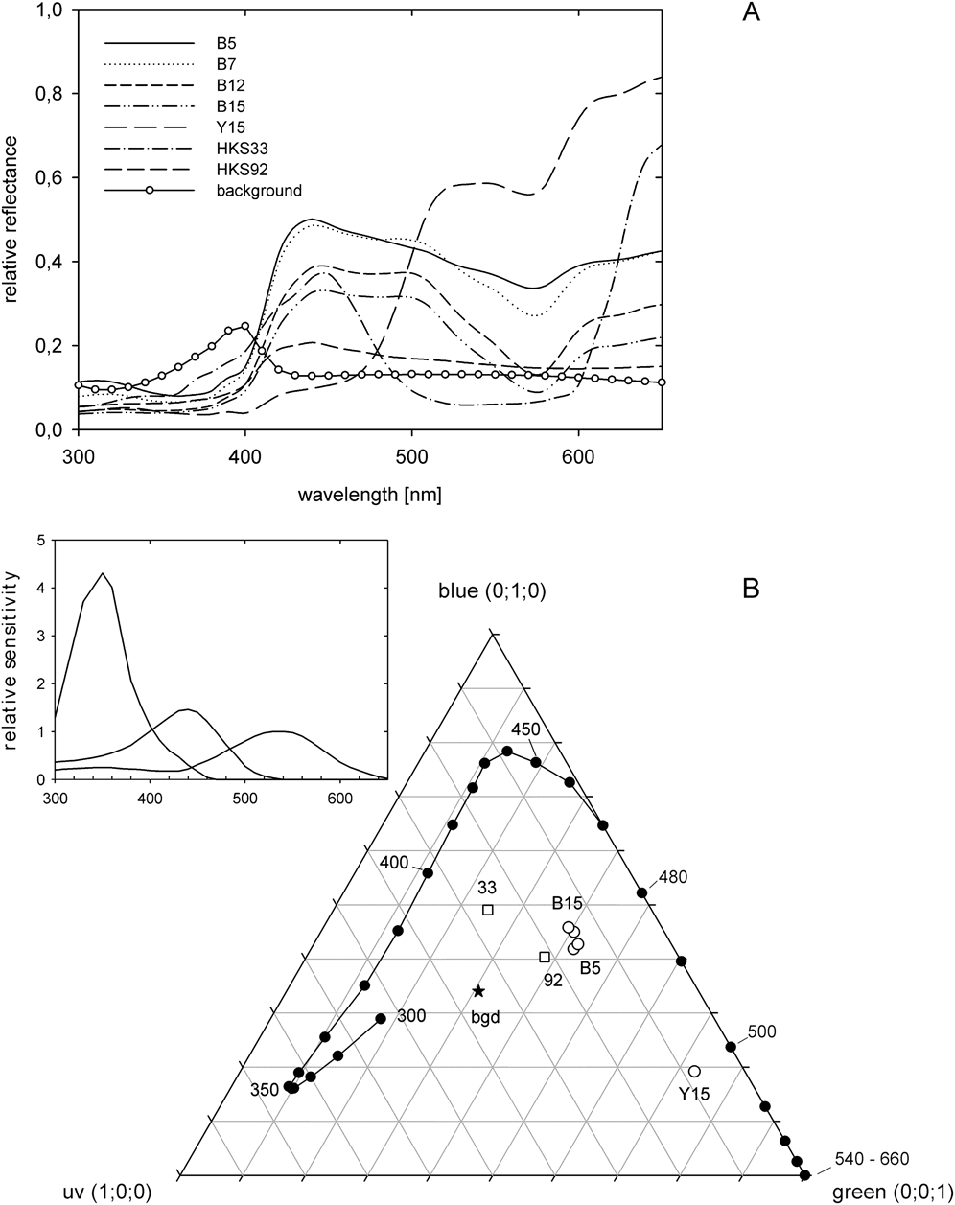
Disks were constructed of four 90 deg sectors (Fig. 1) that were printed on white digital color printing paper (Clairefontaine, France, 1821, 100 g/m2) with a color laser printer (Xerox, USA, Pro C3545 PS). One set of disks was black and white and used for an initial control experiment. The main experiment was performed with yellow/blue disks. To find colors with a range of high and low green receptor contrast, we printed 30 colors, 15 blues and 15 yellows using small steps in the HSB system of Corel draw (similar colors as in Dyer & Neumeyer, Reference Dyer and Neumeyer2005). Each printed color was measured with a spectroradiometer (Spectro 320; Instrument Systems, München, Germany) between 300 and 650 nm (Fig. 2A). Using the spectral sensitivity functions of the three retinula cell types (inset of Fig. 2B), we calculated the excitation values of the green receptors using formula (1) in Dyer and Neumeyer (Reference Dyer and Neumeyer2005). As the measurements had to be performed outdoors under variable daylight conditions, we used for calculation a daylight spectrum of 6500°K (Henderson, Reference Henderson1977, table 6). This seemed to be justified as direct sunlight was excluded and daytime of the experiments was between 10 A.M. and 4 P.M. On the basis of these calculations, we decided to use Y15 as the constant yellow color and determined for each blue step the green receptor excitation ratio by calculating Blue/Y15. Four blue steps were selected: B15 (excitation ratio: 0.47), B12 (0.59), B7 (0.82), and B5 (0.87). A value of 1.0 means no modulation of the green receptor or no green receptor contrast. In a third experiment, the sector disks were made of the two HKS colors, HKS33N and HKS92N. These colors provide almost no modulation of the green receptor with an excitation ratio of 0.98 and were used in previous experiments to test how bees process stimuli lacking green receptor contrast (Giurfa et al., Reference Giurfa, Vorobyev, Kevan and Menzel1996). For all colors, the coordinates of the color loci within the color triangle were determined (Neumeyer, Reference Neumeyer1980; Dyer & Neumeyer, Reference Dyer and Neumeyer2005) and are shown in the color triangle (Fig. 2B). The receptor functions were normalized in such a way that the color locus of a hypothetical white surface with equal reflectance over the entire spectrum is located in the center using a von Kries-type normalization (Dyer, Reference Dyer1999). The loci of the four blue colors indicate that there was only a small difference in hue (but they do differ in bee-subjective brightness). However, the distance between these blue loci and that of color stimulus Y15 is large, whereas the distance between the loci of the two HKS colors is relatively smaller. Previous studies have quantified the color difference between HKS33N and HKS92N using a hexagon color space, and the resulting distance (0.18 hexagon units) is well above discrimination threshold (Giurfa et al., Reference Giurfa, Vorobyev, Kevan and Menzel1996; Dyer & Chittka, Reference Dyer and Chittka2004, Dyer et al., Reference Dyer, Spaethe and Prack2008). Thus, both the blue–yellow and HKS33N–92N stimuli sets are colors that bees can discriminate using color vision, involving all three photoreceptor classes. Importantly, previous behavioral experiments have already established that honeybees cannot use green receptor contrast to detect HKS33N on a HKS92N background (Giurfa et al., Reference Giurfa, Vorobyev, Kevan and Menzel1996; Dyer et al., Reference Dyer, Spaethe and Prack2008).
Color stimuli used in the honeybee experiment. (A) Spectral reflectance of the blue–yellow and HKS papers. Each of the four blue colors (B15–B5) was combined with yellow Y15 on the 90 deg sector disks. (B) Color triangle calculated on the basis of the photoreceptor functions shown in the inset. Each point in this plot represents the relative excitation ratio of the three retinula cell types. The spectral sensitivity functions are normalized in such a way that the color locus of a color stimulus with a constant reflectance over the entire wavelength range is located in the center of the triangle (near “bgd” representing the gray PVC plastic background). 300–660 nm: color loci of the spectral colors. 33 and 92: HKS colors, B15–B5 and Y15: colors used for the blue–yellow sector disks.

Training and test procedure
At the beginning, the bees had to be trained to fly into the maze from above through the opening in the center of the covering perspex. This was achieved by presenting sugar water on a watch glass in the center of this opening at the same level and lowering it successively in small steps until the bee could not reach it without flying into the maze. Then, it had to learn that sugar water was given on perspex rods in front of the disk in each of the three arms of the maze. The next step was to train the bee to discriminate the rotating disks. The training disk was rotating clockwise, the two disks shown for comparison were rotating counterclockwise, or vice versa. Equal numbers of bees were trained on either possibility to counterbalance the experiment. The advantage of the trimaze and the approach from above was that it slowed the bee down, reducing the impact of speed-accuracy tradeoffs (Burns & Dyer, Reference Burns and Dyer2008). As a consequence, the bees had no flight velocity on entering the trimaze and inspected all three possible visual alternatives slowly flying prior to making a decision. A “choice” was recorded when a bee landed on one of the three perspex rods. Here, the bee found a small drop of sugar water on the correct side but water on the other two sides. Following each choice, the bee was gently removed from the apparatus (arrows in Fig. 1). Then, the bee reentered the setup through the central opening. Only one landing was recorded each time the bee entered the trimaze, and the perspex rod was replaced to exclude olfactory cues. Typically, it was possible to collect 10–15 choices each time the bee made a trip from the hive, which allowed for an extended ability for the bee to learn the visual problem using differential conditioning (Giurfa, Reference Giurfa2004; Dyer et al., Reference Dyer, Paulk and Reser2011). Bees were at first trained to discriminate between the rotation directions using black and white sector disks. After they had learned this task showing correct choices of about 50% or higher (random choice = 33.3%), bees were trained and tested with the blue–yellow sector disks, starting with the highest contrast and continuing to the lowest. The low frequency (6 Hz) was investigated first and the highest (24 Hz) at the end, each with all four blue–yellow disks. For each of the six bees, about 150 choices were recorded for each color and each frequency. Finally, the experiment with the HKS color stimuli was performed.
Results
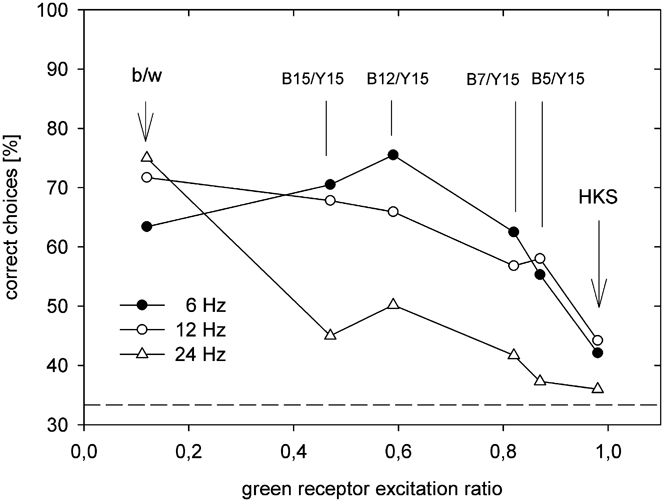
As there were three choice possibilities in this experiment, choice frequency was evaluated versus random choice expectation of 33.3% using one-sample t-tests. The results of all three experiments are shown in Fig. 3.
Choice behavior of all honeybees in the discrimination task between clockwise- and counterclockwise-rotating sector disks with three contrast frequencies (6, 12, and 24 Hz). Horizontal dotted line: random performance (33.33%). Abscissa: excitation ratio of the green retinula cell type calculated for blue:yellow, black:white, and HKS33N:HKS92N. The value 1.0 indicates equal excitation or no green receptor contrast. Black/white: 6 Hz: N = 9 (N: number of tested bees); n = 1469; 12 Hz: N = 7; n = 1959; 24 Hz: N = 6; n = 899. Blue–yellow: 6 Hz: N = 7; n = 4266; 12 Hz: N = 6; n = 3645; 24 Hz: N = 6; n = 3659. HKS: 6 Hz: N = 8; n = 1229; 12 Hz: N = 8; n = 1219; 24 Hz: N = 8; n = 1179.

Black and white stimuli
The data for black and white rotating sector disks are shown on the left hand side in Fig. 3. With an excitation ratio of about 0.12 (black/white), the green receptor was highly modulated when stimulated by the black and white sectors. For “low” (6 Hz; 63.4% ± 7.4 s.d., N = 9, df = 8, t = 12.197, P < 0.001), “medium” (12 Hz; 71.7% ± 9.2 s.d., N = 7, df = 6, t = 10.997, P < 0.001), and “high” (24 Hz; 75.0% ± 14.1 s.d., N = 6, df = 5, t = 7.245, P = 0.001) rotation speeds, clockwise and counterclockwise directions were all discriminated accurately by bees. Thus bees could easily do this task at various speeds with stimuli that provided high contrast to the green receptor.
Color stimuli
For the B15-Y stimuli choice frequency for “low” (6 Hz; 70.5% ± 11.9 s.d., N = 7, df = 6, t = 8.240, P < 0.001) and “medium” (12 Hz; 67.8% ± 7.6 s.d., N = 6, df = 5, t = 11.119, P < 0.001) rotation speeds, the training stimulus was discriminated very accurately by bees, while for the high rotation speed, a weak but statistically significant ability to make the discrimination was observed (24 Hz; 45.0% ± 9.2 s.d., N = 6, df = 5, t = 3.907, P = 0.027).
For the B12-Y stimuli choice frequency for low (6 Hz; 75.5% ± 10.1s.d., N = 7, df = 6, t = 11.033, P < 0.001) and medium (12 Hz; 65.9% ± 7.4 s.d., N = 6, df = 5, t = 10.436, P < 0.001) rotation speeds, the target stimulus was discriminated very accurately by bees, while for the high rotation speed, discrimination was not significantly different from chance (24 Hz; 50.2% ± 17.7 s.d., N = 6, df = 5, t = 2.337, P = 0.067).
For the B7-Y stimuli choice frequency for low (6 Hz; 62.5% ± 12.4 s.d., N = 7, df = 6, t = 6.221, P < 0.001) and medium (12 Hz; 56.8% ± 4.9 s.d., N = 6, df = 5, t = 11.720, P < 0.001) rotation speeds, the target stimulus was discriminated very accurately by bees, while for the high rotation speed, discrimination was not significantly different from chance (24 Hz; 41.7% ± 8.5 s.d., N = 6, df = 5, t = 2.406, P = 0.061).
For the B5-Y stimuli choice frequency for low (6 Hz; 55.3% ± 4.4 s.d., N = 7, df = 6, t = 13.367, P < 0.001) and medium (12 Hz; 58.0% ± 8.0 s.d., N = 6, df = 5, t = 9.977, P < 0.001) rotation speeds, the target stimulus was discriminated very accurately by bees, while for the high rotation speed, discrimination was not significantly different from chance (24 Hz; 37.3% ± 5.6 s.d., N = 6, df = 5, t = 1.171, P = 0.147).
Color HKS stimuli
For the HKS33N and HKS92N stimuli, choice frequency for low (6 Hz; 42.1% ± 4.4 s.d., N = 8, df = 7, t = 5.606, P = 0.001) and medium (12 Hz; 44.2% ± 6.8 s.d., N = 8, df = 7, t = 4.494, P = 0.003) rotation speeds were discriminated accurately by bees. However, at a high rotation speed, bees failed to correctly choose the target stimulus at a level significantly different to chance expectation (24 Hz; 36.01% ± 6.4 s.d., N = 8, df = 7, t = 1.176, P = 0.278). This suggests that bees can use color vision for processing moving stimuli but only at relatively slow speeds (6 and 12 Hz) of movement. The evidence that bees fail at this color task at a relatively high speed of rotation (24 Hz) also shows that discrimination in the other color visual tasks was not due to an artifact cue affecting results.
Goldfish experiment
Materials and methods
Rationale of the experiment
Goldfish were trained and tested in a two-choice discrimination task, as previously described (Gehres & Neumeyer, Reference Gehres and Neumeyer2007). It is unknown whether goldfish would be able to discriminate between a clockwise- and a counterclockwise-rotating disk. In earlier attempts, we found that they cannot learn to discriminate between a stationary and a moving red–green grating (Schaerer & Neumeyer, unpublished data) or between a black moving dot versus a stationary one (Gehres & Neumeyer, Reference Gehres and Neumeyer2007): goldfish seemed to learn just “grating” or “dot,” respectively. Therefore, we trained the fish on a red or blue moving disk in green surround, whereas the comparison test field showed the green surround only. The training and test procedure was the same as described in earlier experiments (Neumeyer, Reference Neumeyer1984, Reference Neumeyer1986).
Animals
In total, seven goldfish (C. auratus; size: 8–12 cm tip to tail) obtained from local dealers were trained and tested. Each of four fish trained at the same time was kept separately in a tank (40 × 25 × 25 cm) equipped with a filter unit. Water temperature corresponded to room temperature (20–25°C). The experimental room was illuminated by fluorescent tubes (Osram L 58W/11-860, Lumilux Daylight) with a 12/12h light/dark rhythm, providing a luminance at water level of about 100 lux. Dry flake food was given on nonexperimental days. For experiments, a food paste was prepared by mixing dry flake food, water, a thickening agent (Traganth; Merck, Germany), and vitamin (Multi-Mulsin N, MUCOS-Pharma, Germany). This paste was used as reward for correct choices by a fish.
Stimuli
In contrast to our previous study (Gehres & Neumeyer, Reference Gehres and Neumeyer2007), we did not use random dot stimuli but homogenously colored disk and surround. This was justified by a control experiment in Gehres and Neumeyer (Reference Gehres and Neumeyer2007, fig. 7) in which homogenous stimuli gave very similar results as the random dot pattern. Goldfish were trained to discriminate between two test fields, each visible through one of two circular openings (83 mm diameter) in a gray PVC plastic plate (“feeding plate” 24.5 × 24.5 cm) inside of the tank at the rear small side. A tube was attached at each opening through which the food paste given for reward was delivered. The two stimuli were presented on one TFT LCD 17" display (Philips 107E20; 76 Hz) at a distance of 7.5 cm from the rear tank wall. The display was operated by a PC (Asus Premium 200 Mhz, 64 MB RAM) and controlled by a second monitor (Philips 107E20). The monitor presenting the stimuli was vertically subdivided into two parts. It showed on one side a homogeneous green field and on the other side a red or blue disk (11 mm diameter) moving horizontally from one side of the visible field to the other, within a green surround (same color as the homogeneous field). A vertical dark gray plastic barrier between tank wall and display prevented the fish from viewing both test fields through one opening. The two test fields were presented by means of a PowerPoint program in such a way that the position of the test field with the moving stimulus was either on the right or on the left hand side. In between two presentations, both test fields were dark. The colors were adjusted using the standard RGB color system (24-bit color representation of PC’s). The color of the (moving or stationary) disk was kept constant. For the red disk, we used R = 255, G = 0, B = 0 for the blue disk R = 0, G = 0, B = 255. The intensity of the green surround (and the green homogeneous field) was variable, starting (in experiments with the red disk) with R = 0, G = 255, B = 0. Successively, other values of G were tested: 200, 180, 160, 150, 120, 110, 100, 80, and 50. Between G = 150 and 120 the intensity was lowered in steps of five. In experiments with the blue disk, measurements started with low (G = 50) and succeeded to increasing G values up to 255.
The red or blue disk, respectively, was continuously moving over 7 cm from the left to the right edge of the opening and was always visible. Three different mean velocities were tested with the red disk: “fast” (=7 cm/s), “medium” (=4 cm/s), and “slow” (=2 cm/s), corresponding to the three possible PowerPoint adjustments. For control, a stationary disk in central position was tested. With the blue disk, only the “fast” movement and the stationary case were investigated. This experiment was performed to confirm the finding by Gehres and Neumeyer (Reference Gehres and Neumeyer2007) that the M-cone type is decisive for object motion. All colors presented on the TFT display were measured with a spectroradiometer (Spectro100; Instrument Systems), and microwatts data were transformed into spectral quantal emission. With these values, the relative excitation values of each cone type were calculated for disk and surround as described in Gehres and Neumeyer (Reference Gehres and Neumeyer2007).
Training and test procedure
Goldfish were trained to approach the test field with the moving disk by rewarding bites (counted as choices) on the corresponding opening of the feeding plate. Choices on the homogeneously illuminated test field were not rewarded. Only small amounts of food paste were given to allow as many rewards as possible during one training session. In the pretraining, each correct choice was rewarded. As goldfish are biting often and rapidly at the test fields, the reward was successively postponed until 25 choices had been counted (as in our earlier experiments). Then, the next correct choice was rewarded. After each reward, both test fields were darkened for about 30 s. During this time, the fish was swimming around in its tank and probed the feeding sites at both openings. Then, while the fish was at the front side of the tank, the training test field was presented on the other side, and again after 25 choices, the reward was given. This was repeated two times, so that 100 choices were collected within each measurement. During pretraining, seven measurements (with four rewards in each) per day were performed with each fish, until a relative choice frequency on the training test field of at least 75% was reached. Training continued for another 5 days in which choice frequencies of 80–90% had to be obtained. With this stabilized training success, the measurements started in which the G values of surround and homogeneous test field were successively reduced (or increased in case of the blue disk). In this phase of the experiment, each G value of the RGB color system was tested in n = 10 measurements with each fish. As in the pretraining, 25 choices of the fish were collected before the reward was given at the correct test field showing the red (or blue) disk.
Results
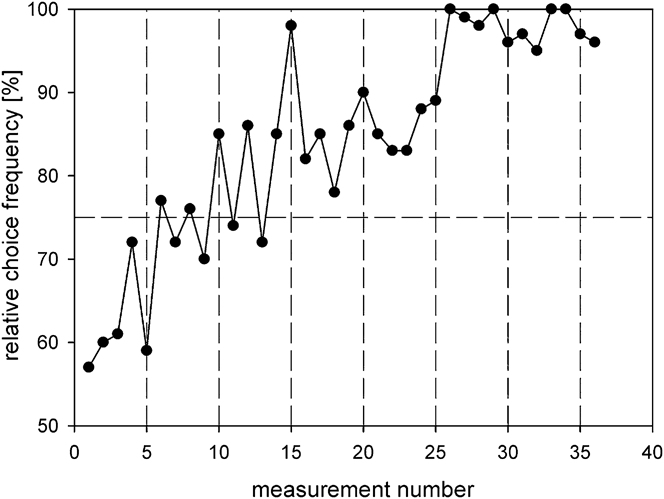
Fig. 4 shows the learning curve of fish 7 as an example, one of the five goldfish trained on a fast moving red disk in green surround in comparison to a homogeneous green field. Each point represents a measurement consisting of 100 choices. After about 15 measurements, the fish showed choice frequencies above 75%, indicating clear discrimination ability. After 25 measurements, the fish even reached values above 90%. The course of the learning curve indicates that this was not an easy task for the fish.
Learning curve of goldfish 7 trained on a fast moving red disk in green surround. A homogeneously green test field was shown for comparison. Each data point represents one measurement with 100 choices. Dashed line at 75% choice frequency: threshold value to be exceeded during pretraining.

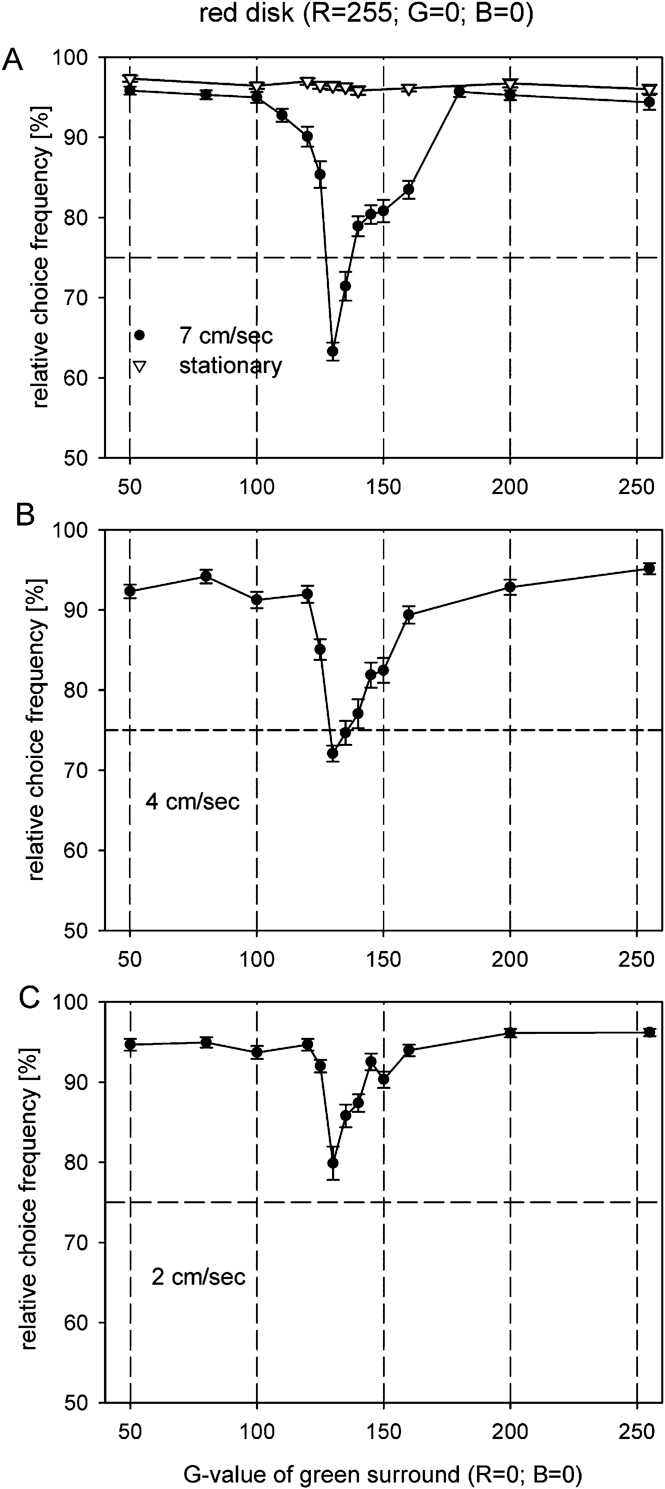
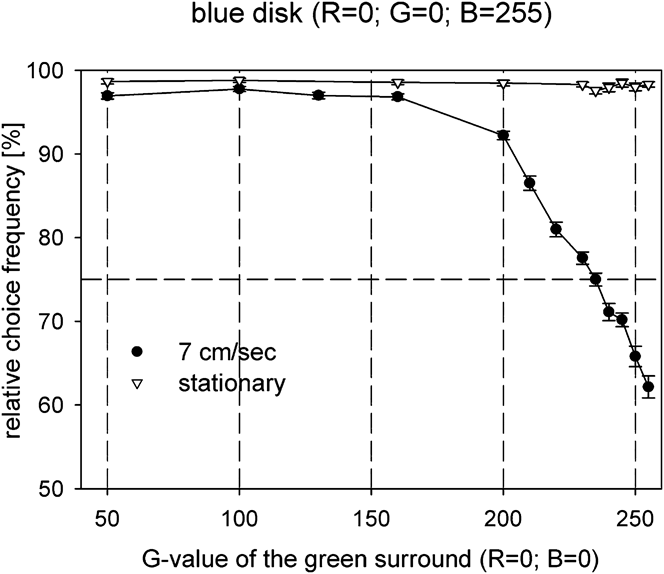
In the test for “color blindness,” we kept the intensity of the red disk constant and lowered the intensity of the green surround successively. In the critical intensity range around G = 130 in which choice frequency approached 50% in the random dot experiment (Gehres & Neumeyer, Reference Gehres and Neumeyer2007), the measurements were performed in small steps of five G values. Fig. 5A shows mean values and s.e.m. of 4–5 goldfish, obtained in 10 measurements with each fish for each intensity step. The curve reveals a sharp decrease of choice frequency down to about 60% at G = 130, that is, exactly in the same range as found previously with the red–green random dot stimuli. Here, choice frequency was at about 55%. Reducing the mean velocity of the red disk to 4 cm/s, the minimum was found again at G = 130, but choice frequency dropped from about 90% at G = 160 to 70% at G = 130 and increased again to 92% at G = 120 (Fig. 5B). With the slowest velocity (2 cm/s), the minimum was at 80%, still showing a slight but abrupt decrease at G = 130 (Fig. 5C). Testing the same goldfish with a stationary disk, choice frequency remained at 95% over the entire green intensity range (Fig. 5A). Using a blue fast moving disk in green surround, choice frequency continuously decreased from 90% at G = 200 to about 60% at G = 255, whereas the stationary disk reached almost 100% choice frequency in this intensity range (Fig. 6).
Choice behavior of four to five goldfish [fish 1, (2), 5, 6, and 7] trained on red disk in green surround. The RGB value of the red disk was kept constant (255; 0; 0). The abscissa indicates the G value of the green surround; the ordinate represents the relative frequency with which the test field showing the red disk was chosen. Each data point represents the mean value with s.e.m. of four to five fish with 10 measurements each (n = 40–50). (A) “Fast” moving disk (7 cm/s) and stationary disk (triangles), (B) “medium” velocity (4 cm/s), and (C) “slow” velocity (2 cm/s). The tests started with high values of G and proceeded to lower ones.

Choice behavior of four goldfish (fish 5, 6, 7, and 8) trained on a fast moving or stationary blue disk (RGB = 0; 0; 255) in green surround of variable intensity as indicated by the abscissa (RGB = 0; 50–255; 0). Mean values and s.e.m. of four fish with 10 measurements each, symbols as in Fig. 5. The tests started with low values of G and proceeded to higher ones.

The constant location of the minimum at G = 130 (found also with random dot stimuli) should reflect the value at which the cone type responsible for object motion vision is not modulated by red disk and green surround. To test this, the excitation ratios of each of the three cone types (the UV cone was assumed not to be stimulated) were calculated for steps of G = 10 on the basis of the cone sensitivity spectra (from Palacios et al., Reference Palacios, Varela, Srivastava and Goldsmith1998), as described in Gehres and Neumeyer (Reference Gehres and Neumeyer2007). The result for the red disk is shown in Fig. 7 (above). Here, an excitation ratio of 1.0, which indicates the same excitation caused by red disk and green surround, is found at about G = 145 for the M cone, reasonably close to the experimental value of G = 130. For the blue disk (Fig. 7, below), the excitation ratio of 1.0 for the M cone is found at about G = 230, again rather close to the experimental minimum at G = 255.
Excitation ratio of the S-, M-, and L-cone type, respectively, when stimulated by the red (above) or blue (below) disk on green surround of variable intensity (G value as indicated on the abscissa). With red disk, an excitation ratio of 1 (indicating zero modulation) cuts the M-cone line at about G = 145, rather close to the experimentally found value of G = 130 (vertical line). With blue disk, an excitation ratio equal to 1 for the M cone is located at about G = 225, reasonably close to the experimental value of G = 255.

Discussion
The honeybee experiment
The results shown in Fig. 3 indicate that bees are able to discriminate between clockwise- and counterclockwise-rotating black and white disks of high contrast at all three tested velocities. However, with blue–yellow-colored disks, a high discrimination ability was found up to an excitation ratio for the green receptor of 0.82 but only for “slow” and “medium” contrast frequencies of 6 and 12 Hz. With higher contrast frequencies of 24 Hz, motion direction was less well discriminated, and discrimination ability was not significantly different to chance expectation at an excitation ratio of 0.82. In the case of the HKS colors for which the green receptor was not modulated (excitation ratio 0.98), motion direction was discriminated with 41–44% at 6 and 12 Hz but with 36% at 24 Hz. Whereas the former values were significantly different from chance level, the latter value was not (see Results section).
Similar sector disks as in our experiment were used by Srinivasan and Lehrer (Reference Srinivasan and Lehrer1984) studying temporal resolution in honeybees. The bees were trained on a disk rotating with a very high (above fusion) frequency of 300 Hz, with a disk rotating with 30 Hz as the unrewarded stimulus. In the tests, variable contrast frequencies were presented against the constant training frequency. Using colored blue–yellow sector disks with very low green receptor contrast, they found no discrimination with high frequencies between 90 and 120 Hz but reasonably high responses between 75 and 65% choice frequency in the range of 20–60 Hz. Discrimination was much better with blue–yellow disks of higher green contrast. Despite of a possible difference in hue between the original disks (rotation above fusion frequency should result in additive color mixture), it is possible that the result can be interpreted in the same way as in our experiment: discrimination could be due to color information with lower frequencies, whereas motion vision is color blind at high frequencies. This, however, was not the conclusion drawn by Srinivasan and Lehrer (Reference Srinivasan and Lehrer1984), who instead discuss the color blindness of motion vision. The “movement avoidance response” used in this experiment is, according to these authors, another way to study motion vision apart from the optomotor response in a frequency range above 20 Hz (Lehrer, Reference Lehrer1994).
Probably, the first contribution of color to object motion vision in insects was described by Horridge et al. (Reference Horridge, Wang and Zhang1990) in a dragonfly. Recording from the ventral cord, they found color-blind self-motion detectors that had input from green receptors only. However, another type of small-field neurons, a forward-looking object motion detector, responded to a blue stimulus in green surround irrespective of intensity. In the lobula of dragonflies, object motion detectors have been reported with spectral properties indicating a variable input from all receptor types (Horridge et al., Reference Horridge, Wang and Zhang1990), and thus, a possible capacity to process color as well as motion.
Recent intracellular recordings from lobula neurons in bumblebees (Bombus impatiens) revealed responses to color as well as to motion stimuli in layers 5–6 (Paulk et al., Reference Paulk, Phillips-Portillo, Dacks, Fellous and Gronenberg2008). However, units sensitive to only color or motion were found in layers 1–4 of the lobula. These differences in sensitivities could underlie the different behavioral results depending upon stimulus speed as observed in our experiments. Even differences in the processing speed of the different photoreceptor types may account for our finding that motion vision was color blind at higher speed. Skorupski and Chittka (Reference Skorupski and Chittka2010) report that the green receptors in Bombus terrestris respond faster than the UV and blue photoreceptor types. It has also been suggested that the bee brain may have different systems for either coarse or fine color discrimination based upon both behavioral and electrophysiological evidence (Dyer et al., Reference Dyer, Paulk and Reser2011). Thus, there appears to be converging evidence that the bee brain is far from a simple processing network, and it would thus be of high value to further explore how color and motion information are combined to make the sophisticated behavioral responses that we report here.
The goldfish experiment
To study the properties of object motion in contrast to wide-field motion, the moving disk stimulated only a relatively small part of the visual field. At a distance of 20 cm, it is seen under a visual angle of about 3 deg, and the velocity of 7 cm/s corresponds to 20 deg/s. However, as the fish is freely moving in its tank, the distance can vary between 30 and 5 cm, and smaller and larger visual angles and angular velocities are possible. As shown in Fig. 5, choice frequency went down to about 60% with the highest velocity of the moving stimulus at a certain intensity of the green surround. The result is very similar to that in the previous experiment with random dot stimuli, in which choice frequency dropped to 55% at the same intensity step of G = 130. Both values are clearly below a threshold criterion of 75% used in previous studies to indicate clear discrimination (Neumeyer, Reference Neumeyer1984). Reducing velocity to 4 and 2 cm/s (corresponding to 11 and 6 deg/s for 20 cm distance) choice frequency at G = 130 increased to 70 and 80%, respectively. This indicates that color information became successively more important. Thus, the results clearly demonstrate that “color blindness” of object motion is found with relatively high velocities only.
Due to the fact that we used a moving disk as the training stimulus, and a homogenous field for comparison, it might be argued that we did not study motion vision but object detection in goldfish. A better way to study motion vision would of course have been to test a moving disk against a stationary one. This, however, was not possible for reasons described in Methods. To use moving random dot stimuli in which the object can only be seen while moving is certainly the best method. As it requires a very extended training, we decided to use a red disk in green surround and the procedure described here. This seemed to be justified because with this method, the same result was obtained in a control experiment (Gehres & Neumeyer, Reference Gehres and Neumeyer2007, fig. 7), and also the results in this present study are consistent with the previous findings. Another argument for having measured motion vision and not mainly object detection are the results with a stationary stimulus (Fig. 5A). These results show that the disk as an object can be detected equally well at all intensities of green surround. If “object detection” and not “motion” would have been measured with the moving stimulus, we should not have found a drop in performance at G = 130. Therefore, we propose that the effect of different stimulus velocities is due to motion vision.
Whether color blindness of wide-field motion tested with the optomotor response is velocity dependent as well is not clear, as in our earlier experiments, the fish was freely swimming and the movement of the pattern across the eye varied between 0 and 60 deg/s (Schaerer & Neumeyer, Reference Schaerer and Neumeyer1996). Slow or even zero stimulus movements occur whenever the fish swims with the pattern. Despite of this possibility, motion vision measured with the optomotor response was “color blind” whenever the L-cone type was not modulated by the red–green pattern. The same was found in zebrafish (Krauss & Neumeyer, Reference Krauss and Neumeyer2003) and in a turtle (Schaerer, Reference Schaerer1993, shown in Neumeyer, Reference Neumeyer, Backhaus, Kliegl and Werner1998).
In contrast to these results in which “wide-field” motion was investigated, the processing of “small-field” object motion is dominated by the M- and not by the L-cone type. This surprising finding (Gehres & Neumeyer, Reference Gehres and Neumeyer2007) is confirmed by the results obtained with a blue disk in green surround (Fig. 6). Here, discrimination ability was very high with values above 90% at intensity values between G = 50 and G = 200. At the highest possible green intensity of G = 255, choice frequency dropped to about 62%, indicating rather poor discrimination. The conclusion that the M-cone type is involved in object motion and not the L-cone type was derived from model computations (Fig. 7) under the assumption that one cone type only is responsible. Here, we calculated at which intensity step of the green surround each cone type is not modulated (or equally excited) by disk and surround. For the red disk, this value was found at G = 145 for the M-cone type, a value reasonably close to the experimentally obtained value of G = 130. For the blue disk, the value is G = 230, again rather close to the experimental value of G = 255. In both cases, the difference to the L-cone value is much larger. The reason why the calculated and the experimental values are not exactly the same is probably that we did not know the spectral sensitivity functions of the cone types with sufficient precision. The sensitivity spectra used for our calculation had been measured by patch-clamp recordings in isolated cones (Palacios et al., Reference Palacios, Varela, Srivastava and Goldsmith1998). Therefore, it is possible that the cone signals used by the motion system are influenced by the ocular media and also by neural interactions within the retina. An indication of the latter is the action spectrum of the optomotor response. Here, the short wavelength limb of the function is steeper, and the maximum is shifted to longer wavelengths in comparison to the L-cone type, indicating an inhibitory influence of the M and/or S cone (Schaerer & Neumeyer, Reference Schaerer and Neumeyer1996). In any case, the results of our measurements show that object motion is color blind at relatively high velocities and includes color information at lower speed.
So far, there is no electrophysiological evidence for two separate motion systems, a L-cone driven wide-field mechanism and a M-cone driven small-field mechanism. In goldfish and rainbow trout, direction-selective neurons were recorded in the pretectum, which respond to full-field movement caused by self-induced changes of position in the visual field (Klar & Hoffmann, Reference Klar and Hoffmann2002; Masseck et al., Reference Masseck, Förster and Hoffmann2010). However, the spectral properties of these neurons have not yet been determined. Other direction-selective units are found in the tectum opticum of Carassius gibelio and goldfish showing predominant L-cone input (Damjanovic et al., Reference Damjanovic, Maximova and Maximov2009; Gacic et al., Reference Gacic, Maximova, Damjanovic, Maximov, Kasparson and Maximov2009). The only indication that M cones are involved in the optomotor response as well was found in the stickleback. Here, the action spectrum has two maxima, indicating L-cone and M-cone contribution (Cronly-Dillon & Sharma, Reference Cronly-Dillon and Sharma1968 and own unpublished measurements).
General principles in motion vision
The results of the honeybee experiment indicate that object motion is using the green retinula cell type in a similar way as wide-field motion tested with the optomotor response. However, object motion is color blind only at higher velocities, and at slower movement, color information can be used as well. A similar dependency of velocity was found in goldfish object motion. In contrast to honeybees, different cone types are involved in goldfish in wide-field motion and in object motion. The way in which color and motion information are combined is an entirely open question to be resolved in both animal models.
The evidence that in both animals, one of the three or four photoreceptor types used for color vision provides input also for motion vision indicates parallel information processing of this photoreceptor type. The concept of separate and parallel processing of “color” and “motion” is based on neuroanatomical and electrophysiological studies in the visual system of primates. Here, parvo- and magnocellular cells in the retina, the functional organization of the cortical areas V1 and V2, and the cortical areas V4 and MT reveal a separation of color and motion (Livingstone & Hubel, Reference Livingstone and Hubel1988; Zeki & Shipp, Reference Zeki and Shipp1988). In honeybees, parallel processing of color and motion is concluded from the fact that green retinula cells contribute to both visual functions and that motion vision measured with the optomotor response is color blind. In goldfish, separate processing of visual functions was first inferred for color and brightness, based on the finding that L-cone contribution was different depending on adaptation state and pharmacological effects (Neumeyer et al., Reference Neumeyer, Wietsma and Spekreijse1991; Spekreijse et al., Reference Spekreijse, Wietsma and Neumeyer1991). Further, behavioral and neuropharmacological investigations revealed separate processing of color and high spatial resolution on one hand and motion, flicker, and brightness on the other (Neumeyer, Reference Neumeyer2003; Mora-Ferrer & Neumeyer, Reference Mora-Ferrer and Neumeyer2009, for review). In primates, color blindness of motion vision was found under some conditions, but not in many others, in which movement could clearly be perceived even under isoluminance (Logothetis, Reference Logothetis1991; Dobkins & Albright, Reference Dobkins, Albright, Chalupa and Werner2004). On the basis of further behavioral and electrophysiological studies, it was argued that there are two “functional streams” in motion vision that differ mostly in their temporal properties. It was proposed that there is a fast motion pathway which represents the velocity of moving patterns responding also to isoluminant stimuli and a slow pathway with high sensitivity to color (Gegenfurtner & Hawken, Reference Gegenfurtner and Hawken1996). This view is very similar to our findings in goldfish and honeybee experiments presented in this paper showing that there is a fast component of object motion, which is color blind, and a slow component with a contribution of color. In bees, the physiological basis might be the response behavior of neurons in different layers of the lobula (Paulk et al., Reference Paulk, Phillips-Portillo, Dacks, Fellous and Gronenberg2008) and also the differences in processing speed between different photoreceptor types (Skorupski & Chittka, Reference Skorupski and Chittka2010). In goldfish, the physiological basis is less well established. Recent extracellular recordings from units in the tectum opticum, however, reveal a strict separation between motion and color-sensitive units (Gruber, Reference Gruber2011). Thus, our results indicate that not only in primates, but also in goldfish and honeybee, there is not just one color-blind motion system but several systems differing in their spectral, spatial, and temporal properties.
The striking similarities of motion vision in honeybee, goldfish, and man, three species separated for many millions of years during evolution, indicate either that the underlying neuronal mechanisms are very old, going back to a common ancestor, or that they are the result of convergent development. There is no way to decide between these two alternatives. However, one may speculate that even the most ancient and “primitive” visual systems must have had motion vision, taking into consideration the high selective pressure resting on the detection of moving predators or prey. To make motion detectors “color blind”, was probably a functional requirement to obtain high correlation and precise motion detection, after the invention of color vision. Motion vision responding to wide-field stimuli is probably color blind in general, as in many invertebrates, beginning with the finding that honeybees behave as if color blind in the optomotor response by Schlieper (Reference Schlieper1927) and recently confirmed with an experiment in Drosophila (Yamaguchi et al., Reference Yamaguchi, Wolf, Desplan and Heisenberg2008). In vertebrates, we found color-blind optomotor response, dominated by the L-cone type, in goldfish, zebrafish, and a turtle (Schaerer Reference Schaerer1993; Schaerer & Neumeyer, Reference Schaerer and Neumeyer1996; Krauss & Neumeyer, Reference Krauss and Neumeyer2003). These results demonstrate that the reflex-like optomotor response cannot be used as an indicator for color vision. However, color vision can be shown and analyzed using slowly moving objects in colored surround, especially in animals not suitable for training experiments as in salamanders (Przyrembel et al., Reference Przyrembel, Keller and Neumeyer1995).
Acknowledgments
We would like to thank Dr. J. Schramme for his continuous help and many discussions, H.-H. Huber for designing and building the speed controller, and the precision instrument makers of the Institute for constructing the setups. A.G.D. is grateful for the Alexander von Humboldt Foundation and the ARC DP0878968/DP0987989 for support.