The phenomenon of social representations has been a focus of study since the 60s (Moscovici, Reference Moscovici1961). It has given birth to different schools of research, each with emphasis on specific aspects of the phenomenon (Moscovici, Reference Moscovici1988). The structural approach is one of those schools. Based upon a cognitivist conception according to which a representation is a set of basic cognitive elements (called cognems) linked to an object by relations (Codol, Reference Codol1969), a social representation is a representation about an object that is relevant to a group; its cognems are legitimated among group members (Flament & Rouquette, Reference Flament and Rouquette2003).
The main theory of the structural approach on social representations is central core theory, which sustains that a social representation is a double system, as there are two types of cognems in the structure: a central core and a peripheral system. According to the theory, the core is formed by a few elements that define the social representation object, are widely shared by group members and are highly resistant to change. The notion of centrality is deliberately inspired in classical social psychological research and theories such as Asch’s impression formation studies and Heider’s folk psychology. The peripheral system comprises the majority of the elements in a representation structure: such cognems can be restricted to subsets of group members and have conditional validity within the structure. Moreover, they accommodate particular views of the object that are compatible with the central elements (Abric, Reference Abric and Abric1994a, Reference Abric and Guimelli1994b). Current central core theory is based on a dichotomous, “black or white” differentiation between central and peripheral elements.
This paper reports a study that tested empirically the theoretical assumption of that dichotomous difference between central and peripheral elements of a social representation, by comparing it to a model that conceives the symbolic link of elements with representation objects in a continuous way. In other words, the study aimed at verifying which one, a dichotomous distinction or a continuous conception, is a more suitable perspective to explain data related to representation structure.
Characteristics of central and peripheral elements of social representations
There have been various experimental or at least correlational efforts to test and refine central core theory through the study of different social representations. A first move in that direction was the position that the consensual sharing of a belief is not exclusive of central elements. Moliner (Reference Moliner1989) showed that some elements have a defining link with a social representation object, while others do not; the author has developed a questionnaire technique based on the double negation principle, which he called “calling into question” (CIQ) (Moliner & Tafani, Reference Moliner and Tafani1997), that enabled him to ask university students if a group of people without certain characteristics, challenged one at a time, was an ideal group. His results indicated that when participants evaluated a group of students without friendship, they rejected to consider it an “ideal group”, the representation object, although they tolerated thinking of an ideal group in which there were not common opinions. In the first case, the elimination of a characteristic of the social representation –friendship– forced a change of “reading grid” of the situation; in the understanding of participants, the group in question could not be an ideal group, but had to be something else. Even if participants seemed to share some ideas about the typical ideal group near to a consensus, only those elements that had what Moliner (Reference Moliner and Guimelli1994) later called “symbolic value”, an essential characteristic of the social representation object, were considered central.
From that point on, it became necessary that an element be both highly shared by the population (i.e., it must have a high quantitative salience) and also possess a special quality, that of being important to define the social representation object; the elements that did not cause a consensual reading grid rejection when questioned were classified as peripheral. Results were obtained with techniques based on similar principles for other social representations objects; other than the social representation on the ideal group, other thoroughly studied are the social representation on the firm (Moliner, Reference Moliner1993; Abric & Tafani, Reference Abric and Tafani1995), work (Flament, Reference Flament1994a, Milland, Reference Milland2002) and higher studies (Moliner & Tafani, Reference Moliner and Tafani1997; Mugny, Moliner, & Flament, Reference Mugny, Moliner and Flament1997).
At that point, the position shared by structural scholars was that central elements were unconditional characteristics of social representations (Flament, Reference Flament and Guimelli1994b). Further research has clarified that the symbolic value of those elements is not always connected to unconditional semantic definitions of the social representation object, but might rather play an evaluative role of occurrences of the object, functioning as norms (Moliner, Reference Moliner1992, Reference Moliner1995; Rateau, Reference Rateau1995; Lheureux, Rateau, & Guimelli, Reference Lheureux, Rateau and Guimelli2008). Currently, the criterion to differentiate central and peripheral elements is usually a statistical significance difference of means or proportions or the comparison to a cut-off proportion of reading grid rejection, such as 75 or 80% or an equiprobability norm (Milland, Reference Milland2002; Moliner, Reference Moliner and Moliner2001a).
Based upon this founding distinction of central and peripheral elements in terms of the existence or not of a tendency of consensual symbolic value within the group, comparative research has proceeded to characterize other structural properties. One of those has been the resistance of representation elements to transformation in various ways: the change of structural status from central to peripheral and vice-versa; a significant change in symbolic value; or a change in affective positioning towards elements, all motivated by social influence efforts.
Studies conducted about the social representation on higher studies support the understanding that central elements are more resistant than peripheral ones to influence. Moliner and Tafani (Reference Moliner and Tafani1997) obtained results pointing out that an attitude change regarding a social object brought about coherent change in peripheral elements, but not central ones. Tafani (Reference Tafani2001) observed that the attitudes towards beliefs expressed in central elements are more resistant to transformation caused by writing a counter-attitudinal essay than the attitudes related to peripheral elements. Likewise, Tafani and Souchet (Reference Tafani and Souchet2002) observed that the commitment to a behavior that challenges an attitude or peripheral belief can affect the evaluations of peripheral elements only. Structural changes only take place when a challenging behavior implies a central element of the social representation.
It is supported by various theoreticians that the difference between central and peripheral elements, reflected in their symbolic value, is dichotomous (Flament, Reference Flament and Jodelet1989; Abric, 1994a, Moliner, Reference Moliner and Guimelli1994; Vergès, Reference Vergès and Guimelli1994; Rouquette & Rateau, Reference Rouquette and Rateau1998). This means that central and peripheral elements are more alike to elements with the same structural status in terms of properties and functioning than to other elements; a given element with a 75% rejection rate in a CIQ task would be more similar to another element with a 95% rate –both usually classified as central according to usual cut-off points from the literature– than an element with a 70% reading grid rejection proportion, usually classified as having peripheral status. It is a “black and white” conception of centrality: either an element is peripheral, with certain characteristics, or it is central, with contrasting properties. There are no spaces in the middle, leaving no option but to classify elements with borderline indexes in one group or the other.
The existence of a continuous property has never been considered as a possibility to explain for empirical results. The reference to a quantitative characteristic of representation elements is commonly made, but it does not refer to symbolic value but only to numerical consensus sharing, or quantitative salience (Flament, Reference Flament and Jodelet1989; Moliner, Reference Moliner1989; Abric, Reference Abric and Abric1994a). Empirical research about structural roles of cognems usually compared elements with clearly contrasting symbolic value properties, leaving aside the cognems with ambiguous classification.
Yet, the results of centrality questionnaires in research usually present a gradual decrease in rejection proportions of elements (e.g. Moliner, Reference Moliner1996; Lheureux et al., Reference Lheureux, Rateau and Guimelli2008) rather than a clear concentration of high and low profiles. If symbolic value is the property that is commonly evaluated to conclude about the centrality of an element, should not it present a configuration analogous to the one associated with the theoretical difference that it is supposed to assess, i.e., a clear-cut difference between important, shared (central) and less important and particularized (peripheral) elements? Also, results by Dany and Apostolidis (Reference Dany and Apostolidis2007) indicate that the classification of elements as central or peripheral changes radically if intermediate response options are present or not. That instability might be evidence that a dual conception of element roles might be artificial.
A continuous model would be a more parsimonious theoretical alternative, by replacing a dual conception by a single principle; the degree with which an element is shared in a population would be directly related to its stability and importance to the group to organize the social representation. Instead of having two contrasting systems, centrality would refer to the importance of an element in the structure of the representation, and would be associated with the characteristics linked today to the core and to the peripheral systems at the extreme positions of a continuum, with intermediate elements also being hierarchically organized and closer to one profile or the other. This understanding is in line with the findings and conclusions of research that demonstrated the existence of hierarchical organization both in the central core (Rateau, Reference Rateau1995) and in the peripheral system (Lheureux et al., Reference Lheureux, Rateau and Guimelli2008). Moreover, it is plausible to think of symbolic value as a continuous property, as in the more people share the understanding that an element conveys an important characteristic of a social representation object, the more it is central. Therefore, such as possibility deserves empirical testing. While data supporting a continuous conception of symbolic value would challenge existing conceptions of representation centrality, the other way around is also interesting: in the case of a better empirical fit by a dichotomous model, the traditional conception would be strengthened after being tested.
The goal of the present study was to verify if a dichotomous distinction between central and peripheral elements or a continuous conception of structural status is more adequate to explain data related to representation structure, through the comparison of regression models. The logic of the study was to employ a variable that we called perceived resistance to change as the variable to be explained by the two models of symbolic value. As commented in the literature review, resistance to change is a second property associated with representational status differences. In this study, resistance to change was not measured as the impact suffered after an influence attempt, but rather as perceived resistance to change (PRC), or the intensity of effort that people believe that it takes to convince someone that the content of a social representation element is not true. In a way, it is the perceived “inertia” of a social representation element: the more people think it is harder to convince a group member that a social representation element is not true, the higher will its perceived resistance to change be. This approach might not deal with the same processes implied by the resistance to change measured in influence-paradigm studies, but it is theoretically compatible with central core theory and provides easier operationalization to assess the characteristics of a larger set of elements. The option for an other-centered measure (i.e., how hard it is for someone of the group to change mind, rather than the participant him/herself) is justified by an attempt to keep the participant focused on typical behavior of a person belonging to the specific group affiliation of interest, respecting the assumption that a social representation is knowledge related to a specific group position (Flament & Rouquette, Reference Flament and Rouquette2003). The persuasion context operationalization of perceived resistance to change variable was a choice to propose a challenge to the stability of representation elements, and thus assess that property of the structure without actually having to provoke a transformation in the representation.
Method
Participants
A total of 114 Psychology undergraduates from a university in the South of Brazil took part of the study. Most of them were women (80). Mean age was 21.6 years (SD = 5.65 years).
Instrument
A questionnaire in Portuguese language was employed in data collection. It contained an alternative version of context independence tests: CIT (Lo Monaco, Lheureux, & Halimi-Falkowicz, 2008), related to 30 elements of three social representations, “firm”, “work” and “university course” (10 elements per social object) that are pertinent to university undergraduate students groups. Such elements were included after consideration of previous studies (Flament, Reference Flament1994a; Lheureux et al., Reference Lheureux, Rateau and Guimelli2008; Milland, Reference Milland2002; Moliner, Reference Moliner1993, Reference Moliner1996; Mugny et al., Reference Mugny, Moliner and Flament1997; Tafani, Reference Tafani2001) and the conduction of a qualitative pilot study in which 53 university students enrolled in the same course as the participants from the current study completed open-ended questions about the social representations in question. Each participant only provided responses relative to a single object.
The following elements of the representation of the “firm” were included (label expression in italics): ”aims to fulfill a need of society”, “aims to make profit”, “provides some kind of product or service”, “is a work place”, “has some kind of hierarchy”, “is a group of people working to achieve a common goal”, “has a boss or person-in-charge”, “makes profit”, “fulfills a need of society”, “has qualified personnel”. The elements relative to “work” were: “is a remunerated activity, “produces benefit for society”, “generates a service or product”, “improves the economic situation of the worker”, “leads to professional achievement”, “provides personal satisfaction”, “enables personal development”, “causes health problems”, “is motivated by the need of money” and “is motivated by pleasure”. Finally, the elements of the representation on “university course” were “prepares for an occupation”, “deepens knowledge in one field”, “allows to get a diploma”, “increases the chances of getting a job”, “allows to earn more money”, “has good teachers”, “has good infra-structure”, “demands student dedication”, “has motivated students”, “takes place in a renowned university”.
CIT is a technique employed to measure symbolic value. CIT tasks are based on a context-invariance principle. They consist in asking the frequency with which a social representation object possesses a characteristic relative to an element. For example, in the case of the social representation on the “firm” (social object) and its element “profit”, a typical CIT task would ask participants the following question: “according to you, can it be said that a firm always makes profit, at all cases?” and response options are “certainly not”, “probably not”, “probably yes” and “certainly yes”. A clear predominance of responses indicating the existence of the characteristic in the object merging options “probably yes” and “certainly yes” is taken as evidence that the element possesses symbolic value to refer to the social representations object, and thus probably belongs to the central core of the representation. CIT tasks obtain results very similar to the ones generated by to classical CIQ items based on the double negation principle, and have the additional advantage of being perceived by participants as easier and demanding less of their time (Lo Monaco et al., Reference Lo Monaco, Lheureux and Halimi-Falkowicz2008). In this study, a variant of the technique was employed; the independence to context was not included in the question, but in two options of the answers, which should be merged and prevail in proportion to serve as an indicator of centrality. Therefore, the actual employed question was: “according to you, can it be said that a firm makes profit?” and response options were “always”, “usually”, “sometimes” and “never”. Responses “always” and “usually” were merged and their proportion assessed. This change was introduced after receiving feedback from participants of pre-tests conducted with instruments in Portuguese language that a more direct task might be easier. The task has therefore been slightly modified; while there are no reasons to assume that results are strongly affected by this modification, it must be stressed that results are not immune to interference due to it.
The instrument also contained measures of resistance of those elements to change, as 6-point Likert items; participants were asked how hard they thought it would be to convince a university student that a belief conveying the meaning of each social representation element was not true; higher scores meant that an element was more resistant to change. Item anchors were 1 (very easy) and 6 (very difficult). However, the items about resistance to change in a questionnaire were not about the same object covered in the CIT tasks, so as to avoid biased responses by participants. The questionnaire with CIT tasks for “firm” had resistance items about “university course”, the questionnaire with CIT tasks related to “work” had resistance items linked to “firm” and the instrument version with CIT about “university course” had resistance items about “work”.
Procedure
Questionnaires were administered in university classrooms during regular lecture times. There were three versions of the instrument distributed randomly, each related to one of the social objects; 38 participants completed each.
Concerning data analysis, we have chosen to work with data aggregated at a second level, not having participants as cases, but elements instead, based on the understanding that social representations are constructs that reflect collective realities. Rather than comparing a dichotomous and continuous centrality models directly from individual data, we chose to calculate symbolic value proportions, structural status and mean perceived resistance to change for each element and work with a dataset to identify structural regularities of social representations units. This also made it possible for us to gather data for each element from different participants; although CIT and resistance to change were not paired data for each element, this procedure is justified by the common assumption in social representations research that participants are legitimate members of a same population –university undergraduates group– and therefore independent symbolic value and resistance data for the indexes associated with elements are supposedly valid. The comparison of models was then conducted with data from the secondary dataset.
Results
The hypothesis that guided the study can be summarized as follows: a model with a predictor operationalizing the classification of social representation elements as central or peripheral explains more variance of resistance to change of those elements than a model with a proportion of symbolic value associated with each element as predictor.
At first the options “always” and “usually” from CIT tasks were merged, as they both indicated high symbolic value. Their joint proportion was calculated and called symbolic value proportion. The symbolic value proportions associated with CIT tasks and the mean scores in the resistance item for each element were then computed.
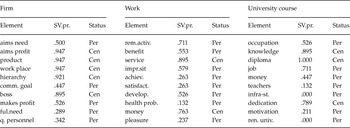
The data set with elements as cases in rows (N = 30) was constructed, containing the following variables: object, dichotomous operationalization of symbolic value, by means of a dichotomization of symbolic value proportion responses (peripheral or central), the centrality proportion itself (continuous operationalization), and the interaction terms of those variables with the object variable. The cut-off point of 75% or higher symbolic value proportion was chosen to classify elements as central, based on criteria adopted by Flament (Reference Flament1999) and Milland (Reference Milland2002) Footnote 1 . Table 1 presents the symbolic value proportions of each element of the three social representations (continuous model) and the corresponding structural status (dichotomous model).
Symbolic value (SV) proportions and corresponding structural status per social representation element

Initially, two sets of hierarchical linear regressions were conducted from the second dataset, having the perceived resistance to change score as criterion variable. The first set had three models to be tested: a first model included only the dichotomous symbolic value classification of elements as a predictor. In a second block, two dummy variables relative to the object variable were added. Finally, in a third model, the interaction terms of the dummy object variables with the dichotomous symbolic value classification were included. The second set of regressions was organized in the same way, with the substitution of the dichotomous symbolic variable by the symbolic value proportion and its corresponding interaction terms. All statistical analyses were conducted through software R (R Development Core Team, 2010).
The model that predicted resistance to change from the dichotomous symbolic value variable was significant, F(1, 28) = 16.248, p < .001, explaining more than one third of the variance of the criterion (R 2 = .367). The model including the object variable predictor was not a significant improvement from the simple first model, R 2 = .072, F(2, 26) = 1.669, p = .208, neither was the one with the interaction terms able to improve the explanation capacity of the second, R 2 = .012, F(2, 24) = .257, p = .775.
The set of hierarchical regressions related to the continuous operationalization of symbolic value obtained similar results. The single predictor model explained 14.3% of the variance of the criterion, F(1, 28)= 4.654, p = .04. The other two models did not increase significantly the explained variance, object model: R 2 = .093, F(2, 26) = 1.576, p = .228; interactions model: R 2 = .026, F(2, 24) = 1.576, p = .655.
Therefore, only the single predictor models were retained and compared: the dichotomous one explained more variance (36.7%) of perceived resistance to change than the continuous one (14.3%). Since the two alternative models are non-nested, in order to verify if that difference was significant, The T 2 test for correlated correlations (Steiger, Reference Steiger1980; Williams, Reference Williams1959) was computed, comparing the Pearson correlations of the unstandardized predicted values of the two models with the resistance to change score (r dich = .606; r cont = .378) as well as their intercorrelation (r = .819). The function r.test from package psych of R software was employed to compute the test. The test statistic was significant, t(27) = 2.563, p = .016, indicating that the dichotomous model with a single predictor provided the best explanation for perceived resistance to change.
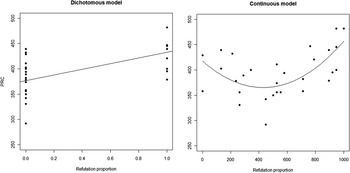
Nonetheless, the assessment of the scatterplot relative to the continuous operationalization choice suggested that a curvilinear model might be more suitable to fit the data. A second continuous single predictor model was tested, taking into account a quadratic relationship between continuous symbolic value and perceived resistance to change. The quadratic continuous model was significant, F(2, 27) = 4.93, p < .001, and explained a larger proportion of variance: 42.4%. However, the T 2 test for correlated correlations (r dich = .606; r cont = .650; intercorrelationr = .830) was not significant; there was no difference between this second continuous model and the dichotomous one, t(27) = .47, p = .64. The fitted values for the quadratic continuous model and the dichotomous model are presented in Figure 1.
Fitted values for the regression models including the dichotomous and quadratic continuous predictors of perceived resistance to change.

Further evidence of the better adequacy of a continuous model might be given by the comparison of perceived resistance to change evaluations of elements with similar symbolic value proportions but different proportions of responses “always” and “usually”, in the case of elements classified as central according to a dichotomous criterion, and different proportions of responses “sometimes” and “never” for elements classified as peripheral. The identification of differences at that level would suggest that the dichotomization of the scale, a procedure often employed in structural studies, is not appropriate.
A series of two-sample tests for equality of proportions were conducted to identify differences in proportions of original, prior-to-merge responses of elements with similar symbolic value proportions. For those analyses, data were organized in a conventional way, with individual scores as cases. Although the same participants provided responses related to all elements of an object, evaluations were considered as independent measures of a between subjects design.
Such analyses were conducted with 37 observations per element, due to missing data provided by some participants. No different response pattern was identified involving elements classified as peripheral, due to a very restricted number of “never” responses. In contrast, some different response profiles were identified for elements related to the objects “firm” and “university course”, but not “work”.
Concerning the “firm” object, different response patterns were identified between element “aims profit” (symbolic value proportion/SVP = .947, proportion of “always” responses/PA = .67), with a prevalence of “always” responses, and elements “hierarchy”, SVP = .921, PA = .28; χ2 = .8.850, p = .002, df = 1, and “boss”, SVP = .895, PA = .35, χ2 = 5.691, p = .017, df = 1, with a predominance of “usually” responses. A continuous model would be compatible with higher perceived resistance to change scores associated with “aims profit” when compared with the other two elements, which was confirmed: the mean score of “aims profit”, 4.81 (SD = 1.45), was higher than both “boss” (M = 3.78, SD = 1.46), t(72) = 3.041, p =.003, d = .71, and “hierarchy” (M = 3.95 , SD = 1.49), t(72) = 2.531, p =.014, d = .60.
Likewise, a difference in the proportions of “always” and “usually” responses was identified between two elements related to the university course object that were dichotomously classified as central: “dedication” (SVP = .789, PA = .50), with a balanced distribution of responses, and “job” (SVP = .711, PA = .15), with a strong predominance of “usually” responses, χ2 = 6.413, p = .011, df = 1. A pattern compatible with the continuous model would favor a statistical difference between the mean perceived resistance to change scores, with a higher score of “dedication” (M = 4.43, SD = 1.50) than of “job” (M = 3.89, SD = 1.17), which was only observed as a tendency at the .10 level, t(72) = 1.726, p =.088.
Discussion
The results were not straight ahead favorable to a linear continuous model of centrality in the present study, as it explained significantly less the dependent variable of resistance to change when compared to the dichotomous model. In contrast, when a quadratic continuous model was adopted, the explanation power of the continuous conception increased greatly. At a first glance, one might argue that the quadratic, curvilinear model did not prove better than the dichotomous model according to statistical criteria, possibly due to the small number of cases included in the analysis of aggregated data. But a statistical artifact may have been responsible for such non-significant difference in the T 2 test for correlated correlations. In some occasions, the dichotomization of continuous data may result “in an increase of r over that of the original graduated variable; but these will be characterized by extreme skewness, heteroscedasticity, curvilinearity, e.g., step functions” (Cohen, Reference Cohen1983, p. 252). In such cases, the dichotomization of data is clearly inappropriate, as the data strongly suggests that a curvilinear distribution is more suitable.
The complementary analyses comparing perceived resistance to change scores of elements with similar symbolic value profiles but different proportions of “always” and “usually” responses in the CIT task also provide evidence that call into question the classical dichotomous model. If such model was adequate to the data, then such comparisons would yield no differences. Yet, of the three possible comparisons involving elements dichotomously classified as central that had contrasting response distributions, two indicated significant differences and one pointed out to a tendency.
In addition to a statistical equivalence with the classical model (with statistics relative to the dichotomous model possibly boosted due to the artifact just mentioned) the quadratic model did fit the data better from a qualitative point of view, as evidenced by a larger portion of explained variance and a higher adequacy of the curve to follow the dispersion of points in Figure 1. But how is it possible to explain the observed pattern? It would be more straightforward to think of a continuous conception of centrality as being directly proportional to the inertia of elements, i.e. their resistance to change. And such hypothetical relationship would be better represented as a linear model, not as a curvilinear one. The curve suggests that there are close-to-linear relationships closer to the extremes of the continuum. For elements with higher refutation proportions, higher symbolic value, the expected pattern of a direct relationship with resistance to change is found. But surprisingly, elements with low symbolic value also have a high resistance to change, resembling a linear but negative trend. Finally, elements with intermediate rates of symbolic value are the ones thought by participants as being easier to suffer transformation.
Those results can be explained due to the persuasion-based approach adopted in the current study. The other-centered measure of resistance to change involves thinking how a group member would react to an attempt to change his/her opinion about each element. But there is also the possibility that people judged that reaction differently if the element referred to an opinion held by a majority or a minority within the group. It can be assumed that for the extremes of the continuum the existence of a widely known consensus relative to the most shared elements as well as elements that refer clearly to a minority within the group and not to the group in general, are publically known in the group. Those would correspond respectively to the cases of manifest consensus and manifest disagreement dealt with by Moliner (Reference Moliner2001b). In the case of the elements with publically known consensus, it does make sense to follow the rationale that the more consensual or central an element is thought to be, the harder it is to make a group member change mind concerning that element. The manifest consensus increases the validity and normativity of an opinion, making it more difficult to go against it (Pérez & Mugny, Reference Pérez and Mugny1993).
The case of manifest disagreement involving elements with the lowest symbolic values might be better understood as being associated with as estimation of the difficulty of bringing about change in the opinions of a minority. But it is not simply a minority; if a group member has a belief related to an element that is knowingly little shared in the group, then arguably that group member has some strong reason for that and knows that he/she stands for a position different from the majority. Such a group member would probably be classified by a majority member as belonging to a consistent minority that will not give away their position easily (cf. Moscovici & Faucheux, Reference Moscovici, Faucheux and Berkowitz1972). So in this specific case of elements with low symbolic values, the less shared an element is thought to be, the most difficult it should be to make someone who actually believes in that element to change mind, as that person might conform less to group norms or have strong reasons to keep a deviant position.
This scenario can also be applied to the intermediate elements, which do not seem to follow a clear pattern of the relationship between symbolic value and resistance to change. Their position in the consensus spectrum is more ambiguous; some participants might believe that they are elements shared by the majority, others that they refer to a clear minority; for elements that are “more or less” shared, errors in terms of estimation of the existence of consensus are particularly likely to occur in terms of the confrontation of one’s own opinion and the estimation of group consensus, corresponding to cases of illusory and latent consensus as described by Moliner (Reference Moliner2001b). So those evaluations tend to cancel each other out and this would explain the blurred results of the middle of the refutation proportion evaluations.
While an innovation of the present study was the choice to conduct the analyses with a secondary dataset with social representation elements as cases, which is coherent with a conception of social representations as phenomena that transcend individual data and belong to collective levels of analysis (Rouquette, Reference Rouquette1994), that choice also implies some loss of information concerning the interpretation of individual evaluations concerning group norms and the estimation of behavior and positioning of other group members. If the configuration of results and the interpretation of the association of some elements with minority and majority positions are taken into account, then the employed between subjects design restricted the possibility to explain the identified effects. A way to overcome such limitations is to conduct further research on this topic with a properly planned within-subjects design, which would allow the pairing of symbolic value responses with perceived resistance to change and would give more certainty in the interpretation of the estimation processes taking place, as it would be possible to trace for each PRC assessment if it was based on the understanding of an element being linked to a majority or minority. However, it must be noted that an investigation of that sort would have to employ a composite, multi-item measure of PRC in order to enable more reliable and refined measurement of that property at the individual level. The adoption of a self-centered measure of PRC (i.e., “how hard would it be for you to change your opinion”) might also help to reduce the problem of the estimation of prevalent group consensus, though in that case an inclusion of some kind of group reference in instructions might be desirable to ensure that the activated knowledge is more related to the group sphere and less to personal identity factors.
Another limitation of the present study was that a perceived resistance to change, an approximation of the “inertia” of a social representation, was employed as a single external criterion of element centrality. It is a choice that is backed up by theoretical positions within the structural approach, but it is by no means exhaustive or a “golden road” to differentiate social representation elements. Other criteria should come into play in order to allow the identification of different roles of elements in the structure of social representations. An example has been provided by Abric and Tafani (Reference Abric and Tafani1995), who considered the evaluative and functional importance of elements. The inclusion of multiple criteria should result in a better, more precise understanding of element properties and eventually a redefinition of theoretical positions. It is also important to stress that the measures of those properties and indicators in future research should be psychometrically reliable, usually of a composite nature, whenever possible, just as future PRC measures, as mentioned previously, so as to avoid some of the shortcomings that are present in this study.
The study provided support for an alternative, continuous model of structure centrality in social representations, but it consisted more of a first exploration in that direction than an actual conclusive effort, due to the identified pattern of results associated with the adopted persuasion approach to evaluate social representations inertia and the restrictions imposed by the employed measures and the research design to characterize individual processes. Future investigations taking into account personal paired responses concerning context independence and resistance to change evaluations, as well as other properties, are necessary to follow up the current study and point out to a more precise evaluation of a continuous centrality property hypothesis coherent with the adopted research rationale.
As a conclusion, arguably the main contribution of the reported study is that, while there are still adjustments and procedural refinements to make in order to better characterize a continuous model, the present research provides evidence across three different social representation objects that strongly challenges the widespread, classical dichotomous understanding of social representation structure. It therefore joins a line of research (e.g. Katerelos, Reference Katerelos1993, Reference Katerelos2003; Rateau, Reference Rateau1995; Lheureux et al, Reference Lheureux, Rateau and Guimelli2008) that is consistently finding evidence that the clearly cut differentiation between a central core and a peripheral system is an approximation of a more complex reality, proposing a direction that might lead to a revision of some of the basic conceptions of central core theory and the structural approach to social representations.