INTRODUCTION
A variety of wildfire proxies are preserved in sedimentary records (Conedera et al., Reference Conedera, Tinner, Neff, Meurer, Dickens and Krebs2009; Hawthorne et al., Reference Hawthorne, Mustaphi, Aleman, Blarquez, Colombaroli, Daniau and Marlon2018), with charcoal universally used for understanding past wildfire occurrence (see Brown and Power, Reference Brown, Power and Elias2013; Aleman et al., Reference Aleman, Hennebelle, Vannière and Blarquez2018). Charcoal is the relatively chemically inert product of the incomplete combustion of organic matter (Scott, Reference Scott2010) and has been shown to be relatively resistant to compression and fragmentation (Chrzazvez et al., Reference Chrzazvez, Théry-Parisot, Fiorucci, Terral and Thibaut2014). As such, charcoal is well preserved within sedimentary records and thus can be used to reconstruct wildfire activity on a variety of spatiotemporal scales (e.g., Power et al., Reference Power, Marlon, Ortiz, Bartlein, Harrison, Mayle and Ballouche2008; Florescu et al., Reference Florescu, Vannière and Feurdean2018).
To date, however, no standardized methodology has been developed for the extraction of charcoal from sediments (Whitlock and Larsen, Reference Whitlock, Larsen, Smol, Birks and Last2001; Conedera et al., Reference Conedera, Tinner, Neff, Meurer, Dickens and Krebs2009; Halsall et al., Reference Halsall, Ellingsen, Asplund, Bradshaw and Ohlson2018), although various protocols have been suggested (e.g., Winkler, Reference Winkler1985; Rhodes Reference Rhodes1998; table 1 in Whitlock and Larsen, Reference Whitlock, Larsen, Smol, Birks and Last2001). The most common technique employed is the counting of macroscopic charcoal (i.e., >125 μm). This fraction of charcoal is extracted from a known volume of sediment through deflocculation and wet sieving, followed by quantification of fragments under a stereomicroscope. If the deflocculant has no bleaching effect, another optional step of “bleaching” with a chemical agent is sometimes added to degrade the non-charred organic fraction and thus aid the identification of charcoal fragments (Whitlock and Larsen, Reference Whitlock, Larsen, Smol, Birks and Last2001).
Various chemical treatments are used for the deflocculation and/or bleaching of sediments (Supplementary Table S1); however, there is contradictory information as to the effects of different treatments on the charcoal. For example, hot concentrated nitric acid (HNO3) was one of the first chemicals suggested for the digestion of organic matter and thus isolation of the charcoal (Swain, Reference Swain1973; Singh et al., Reference Singh, Kershaw, Clark, Gill, Groves and Noble1981; Winkler, Reference Winkler1985). Winkler (Reference Winkler1985) found no charcoal loss in concentrated HNO3; however, Kurth et al. (Reference Kurth, MacKenzie and DeLuca2006) reported 80% loss (fig. 1 in Kurth et al., Reference Kurth, MacKenzie and DeLuca2006). Rhodes (Reference Rhodes1998) recommended the use of hydrogen peroxide (H2O2) based on White and Hannus's (Reference White and Hannus1981) findings that treatment in 6% H2O2 did not cause any loss of charcoal. Kurth et al. (Reference Kurth, MacKenzie and DeLuca2006) also reported 100% recovery of charcoal left in 30% H2O2 for 30 days. In contrast, Schlachter and Horn (Reference Schlachter and Horn2010) found the loss of fossil charcoal increased with increased concentrations of H2O2, even though the concentrations studied were relatively weak (1–8%). Other chemicals used to extract charcoal include sodium hexametaphosphate (NaPO3)6, sodium metaphosphate (NaO3P), potassium hydroxide (KOH), and sodium hypochlorite (NaClO) (see Supplementary Table S1); however there has been no systematic review of how these chemicals may influence the amount and/or size of the charcoal recovered.
Analyses of both lacustrine and bog sediments suggest that sediment sample size may also influence results. Carcaillet et al. (Reference Carcaillet, Bouvier, Fréchette, Larouche and Richard2001) demonstrated that 1 cm3 of sample volume can provide replicable charcoal series within partially laminated lacustrine sediments. However, Schlachter and Horn (Reference Schlachter and Horn2010) found high variability in charcoal content within horizontally adjacent samples using the same sample volume, although the overall charcoal profiles were correlated. Other sample volumes have also shown mixed results for lacustrine sediments (Higuera et al., Reference Higuera, Gavin, Bartlein and Hallett2010; Feurdean et al., Reference Feurdean, Spessa, Magyari, Willis, Veres and Hickler2012). Peat archives are often used for reconstructing past wildfire occurrence (Mooney and Tinner, Reference Mooney and Tinner2011); however, to the best of our knowledge only one study has assessed representative sample volume in bogs (Feurdean et al., Reference Feurdean, Spessa, Magyari, Willis, Veres and Hickler2012), despite the fact that charcoal recruitment and accumulation varies between bogs and lakes (see Conedera et al., Reference Conedera, Tinner, Neff, Meurer, Dickens and Krebs2009; Rius et al., Reference Rius, Vannière, Galop and Richard2011; Feurdean et al., Reference Feurdean, Spessa, Magyari, Willis, Veres and Hickler2012; Remy et al., Reference Remy, Fouquemberg, Asselin, Andrieux, Magnan, Brossier and Grondin2018). Comparing charcoal data obtained from 1 cm3 and 40 cm3 sample volumes of peat indicated that 1 cm3 sample volumes did not produce consistent charcoal counts at one of the two sites tested (Feurdean et al., Reference Feurdean, Spessa, Magyari, Willis, Veres and Hickler2012).
This paper addresses the above concerns by assessing: (1) how common chemical treatments affect charcoal number and particle size, and (2) whether 1 cm3 samples provide replicable charcoal data in correlative samples. We first quantify the effect of the most widely used chemicals on laboratory-produced charcoal. We used a subset of these chemicals to extract charcoal from selected intervals of a late-glacial–early Holocene sequence from Sluggan Bog, Northern Ireland (Irish Grid Reference: S 099 921; Lowe et al., Reference Lowe, Walker, Scott, Harkness, Bryant and Davies2004; Walker et al., Reference Walker, Lowe, Blockley, Bryant, Coombes, Davies, Hardiman, Turney and Watson2012). The latter exercise also allowed the replicability of the charcoal data and thus the representativeness of the sample volume to be assessed. Finally, we provide recommendations for choosing the best chemical treatment based on the various sediment types encountered in our experiment. The implications of using different chemicals on fossil material, especially in regard to the comparability of published findings, is also discussed.
METHODS
Modern charcoal
Area (e.g., mm2 cm3) is currently regarded as the best metric for the quantification of charcoal (Ali et al., Reference Ali, Higuera, Bergeron and Carcaillet2009; Leys et al., Reference Leys, Carcaillet, Dezileau, Ali and Bradshaw2013; Crawford and Belcher, Reference Crawford and Belcher2016), especially when estimated via image analysis (Conedera et al., Reference Conedera, Tinner, Neff, Meurer, Dickens and Krebs2009; Leys et al., Reference Leys, Carcaillet, Dezileau, Ali and Bradshaw2013; Halsall et al., Reference Halsall, Ellingsen, Asplund, Bradshaw and Ohlson2018). As such, here we predominantly focus on how chemical treatments influence charcoal area but support this with data on the number of charcoal fragments as discerned by image analysis. Standardized charcoal samples produced in laboratory conditions were used to determine how chemicals commonly used to extract macroscopic charcoal affect charcoal area or numbers. Charcoal was produced from a softwood (Pinus sylvestris) and a hardwood (Quercus robur) and heated to either 400°C and 800°C and from grass, common cat's tail (Phleum pratense), heated to 400°C. These five charcoal types were used to mimic the variability that is typically present in sedimentary archives. The source materials were placed in bespoke steel tubes designed to exclude oxygen yet allow the release of volatile gases from heated organic material. The steel tubes were placed in a preheated Nabertherm muffle furnace, left for 60 minutes, and then removed and allowed to cool. The charring method and equipment follows that of McParland et al. (Reference McParland, Collinson, Scott, Steart, Grassineau and Gibbons2007, Reference McParland, Hazell, Campbell, Collinson and Scott2009, Reference McParland, Collinson, Scott, Campbell and Veal2010) and Scott and Glasspool (Reference Scott and Glasspool2005, Reference Scott and Glasspool2007).
The resulting charcoal was smashed with mortar and pestle and wet sieved in order to isolate the 125–250 μm fraction, as this fraction is the dominant fraction in typical sedimentary archives (Halsall et al., Reference Halsall, Ellingsen, Asplund, Bradshaw and Ohlson2018). Furthermore, using a specific size fraction is likely to produce more consistent results. The charcoal was then placed in a beaker, submerged in H2O, and left for a minimum of 30 days to ensure it was waterlogged. The beaker was covered with tin foil to avoid evaporation. After reviewing the literature (see Supplementary Table S1), the chemicals tested were sodium hexametaphosphate (NaPO3)6 20%, potassium hydroxide (KOH) 10%, nitric acid (HNO3) 50%, sodium hypochlorite (NaClO) 2.5% and 12.5%, and hydrogen peroxide (H2O2) 8% and 33% (Table 1). The concentrations were typically at the high end of the range reported in the literature (e.g., H2O2 33%) or exceeded reported concentrations (e.g., NaClO 12.5%). This was to ensure that they would successfully disaggregate even highly organic sediments. Lower concentrations of H2O2 8% and NaClO 2.5% were also used, to assess whether the lower concentrations resulted in less damage to charcoal. All chemicals were laboratory grade and from freshly opened bottles, as suggested by Schlachter and Horn (Reference Schlachter and Horn2010). For each chemical treatment, 10 replicates were tested. For each replicate, approximately five pieces of each of the five types of charcoal were placed in a small gridded petri dish, the test chemical was added, and a lid was placed on top to avoid evaporation. The charcoal was exposed to the test chemical for either 24 or 48 hours (see Table 1), based on published studies (see Supplementary Table S1). These cut-off points were the most common treatment times used and relatively time efficient. For each of these time periods, a separate control set of 10 replicate samples (set up as above but with distilled water [H2O]) was used.
Overall timespan, treatments, their chemical type and their concentrations used in this study. Mean area and standard deviation in mm2 of the 10 replicates used in each treatment at the start of the experiment also given.

Samples were photographed under the microscope as a series of overlapping squares (Crawford and Belcher, Reference Crawford and Belcher2014) immediately after the addition of the chemical or H2O and then at pre-determined time steps. The overlapping pictures were reconstructed in Photoshop to form each original petri dish exactly as it was at the time it was photographed. All 50 pictures for each chemical or H2O (5 time steps * 10 replicates) were then imported into ImageJ (Abràmoff et al., Reference Abràmoff, Magalhães and Ram2004; Schneider et al., Reference Schneider, Rasband and Eliceiri2012), where they were batch processed with a macro that turned them all into 8-bit greyscale and a threshold of 160 greyscale was applied before analysing the remaining particles. The comma-separated values (CSV) output recorded information for all fragments and was imported into R (R core team, 2018) to obtain sums of the area and numbers of the charcoal fragments and organize these results into time steps.
Fossil charcoal
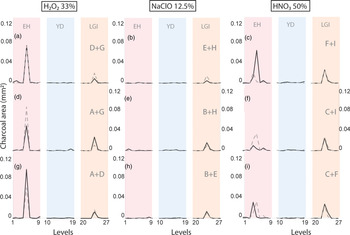
To evaluate the results of the modern experiment in a real-world context, we sampled a monolith from Sluggan Bog, Northern Ireland (Lowe et al., Reference Lowe, Walker, Scott, Harkness, Bryant and Davies2004; Walker et al., Reference Walker, Lowe, Blockley, Bryant, Coombes, Davies, Hardiman, Turney and Watson2012). We identified three time periods of interest and sampled in contiguous 1 cm depth intervals centered around previously identified charcoal peaks. Nine samples were collected from each depth interval using a 3 × 3-cm grid pattern, which was used to systematically assign the samples to the three chemical treatments (Fig. 1). Levels 1–9 span the early Holocene (EH: post-11.65 cal ka BP), Levels 10–18 span the Younger Dryas (YD/GS-1: 12.85–11.65 cal ka BP), and Levels 19–27 span the late-glacial interstadial (LGI/GI-1: 14.65–12.85 cal ka BP) (Rasmussen et al., Reference Rasmussen, Bigler, Blockley, Blunier, Buchardt, Clausen and Cvijanovic2014). Although limited charcoal had been retrieved from the Younger Dryas levels as compared to the late-glacial interstadial and early Holocene levels in the study of Walker et al. (2012), these levels were included here because they provided the opportunity to evaluate the effect and efficiency of the chemical treatments for charcoal extraction from clay/lacustrine matrices (see Fig. 1).
(color online) (A) Sluggan Bog monolith indicating lithological matrices and the levels (n = 27) with charcoal sampled from the nine adjacent fossil sequences. (B) Above view of the monolith indicating the spatial arrangement of the nine adjacent sequences. The chemical treatments applied to the sequences in a linear fashion in sets of three are also indicated.

Three sequences were analyzed with NaClO 12.5%, H2O2 33%, and HNO3 50% (see Fig. 1). These chemicals were selected from those tested in the modern experiment because they all have both bleaching and disaggregating effects yet had markedly different effects on charcoal area. Additionally, preliminary tests on material from Sluggan Bog suggested these treatments might be capable of adequately breaking down the sample matrix such that minimal physical pressure was needed for the remaining lumps of material to be disaggregated within the desired time frame. The samples were submerged in these chemicals for the total duration of modern charcoal experiments (24 hours for NaClO 12.5% and 48 hours for H2O2 33% and HNO3 50%), then wet sieved.
A selection marquee provided by the software of the microscope camera was used to isolate and photograph the charcoal fragments encountered under the microscope rather than photographing the grid squares of the petri dish (as with the modern experiment). This was because the early Holocene and late-glacial sediments were highly organic, with high amounts of dark material. It was thus likely that very low thresholds would have to be used in ImageJ (Abràmoff et al., Reference Abràmoff, Magalhães and Ram2004; Schneider et al., Reference Schneider, Rasband and Eliceiri2012), which could potentially have led to not accurately capturing all charcoal fragments. Also, because the different chemicals used had varying success in bleaching the sediments, different thresholds were needed among the sequences, which could potentially hinder the direct comparability of results among samples. Therefore, the selection marquee enabled the same threshold to be used with the modern charcoal and the nine adjacent sequences. The pictures of the individual charcoal fragments photographed for each sample were imported into ImageJ (Abràmoff et al., Reference Abràmoff, Magalhães and Ram2004; Schneider et al., Reference Schneider, Rasband and Eliceiri2012) and batch processed with the same macro as in the modern experiment (i.e., they were turned into 8-bit greyscale and a threshold of 160 greyscale units was applied before analysing the remaining particles); a CSV output was then created for each sample. All CSVs were imported into R (R core team, 2018) to obtain sums of the area and numbers of charcoal fragments and organize these results into samples.
Statistical analyses
Modern charcoal
The data were normalized by subtracting the mean and then dividing by the standard deviation of the 10 replicates in the first time step within each chemical. To quantify the significance of the change among treatments within the various time steps, mixed between-within subjects analyses of variance (ANOVAs) were implemented in SPSS. The analyses were implemented separately for the 6 h batch (both concentrations of NaClO and a H2O control set) and the 12 h batch ((NaPO3)6, KOH, HNO3, both concentrations of H2O2, and the second H2O control set). We then used one-way repeated measures ANOVAs to disentangle the effects of the chemical and the duration of exposure by assessing 1) whether the chemical used had a significant effect at different time steps, or 2) whether the chemical used had a significant effect among the time steps within each treatment.
We were particularly interested when significant differences between the water and chemical used occurred. Our null hypothesis was that no significant differences in area would be observed. The alternative hypothesis stated that charcoal area would differ between the chemical treatments, the time steps, or any combination of these.
Fossil charcoal
To test the effect of treatment on charcoal area and to account for the nested design in the fossil experiment and the non-normal data obtained, a Generalized Linear Mixed Model was fitted on log-transformed data (log(x + 1)) using R-package lme4 (Bates et al., Reference Bates, Mächler, Bolker and Walker2014). The nested design was used as the random factor. To explore the representativeness of the 1 cm3 samples, we tested whether increasing volume (i.e., a 2 cm3 sample) would yield charcoal data comparable to the results obtained from the 1 cm3 sample. For this reason, Spearman's rank correlation was implemented for the 1 cm3 samples and the composite (i.e., sum) area of charcoal in the two horizontally adjacent samples analyzed with the same chemical. To avoid inflation of correlation coefficients due to the presence of zero values (Pimentel, Reference Pimentel2009), when a sample lacked any charcoal (and thus had a zero value), samples from the same depth that had been treated with the same chemical were not included in the correlation analysis.
RESULTS
Modern charcoal
The area of charcoal differed significantly depending on which chemical and time step were considered (Figs. 2 and 3). An increase in charcoal area was evident between the first and final time step (Supplementary Tables S2–S3) for the majority of the chemical treatments used in this study ((NaPO3)6 20% ca. 49% increase, HNO3 50% ca. 46% increase, KOH 10% ca. 39% increase, H2O2 8% ca. 29% increase, and H2O2 33% ca. 62% increase), and to a lesser extent for the 12-h H2O control (ca. 14% increase). The increase in area was most pronounced between T0 and T1, with a significant difference observed for all chemicals in the 12-h batch. After the initial increase, the area of the samples was relatively constant in the remaining time steps. A marked decrease in charcoal area occurred in the NaClO treatments between the first and final time steps (2.5% ca. −28%; 12.5% ca. −51%), particularly in the 12.5% concentration, where high charcoal numbers suggest fragmentation (see Supplementary Fig. S1, Supplementary Table S3). The number of charcoal fragments also increased between T0 and T1 for most treatments (H2O2 8% ca. 2% and 33% ca. 17%; (NaPO3)6 20% ca. 2%; NaClO 2.5% ca. 17%, and 12.5% ca. 16%), albeit generally by a smaller magnitude than area (see Supplementary Fig. S1). Numbers remained relatively constant for KOH 20% and HNO3 50%, both between T0 and T1 (ca. 3% and 0.5% respectively) and throughout the experiment (ca. 3% and 1% respectively). Both controls showed consistent decreases between T0 and T1, but numbers increased from T2 to T4 resulting in final numbers that were similar to start values.
(color online) Charcoal area changes over 12–h time steps when subjected to widely used chemicals in charcoal analysis. Samples constitute a known mixture of modern charcoal types produced in the lab. For every chemical treatment and H2O control set n = 10. Color codes indicate the time steps at which significant differences between the chemicals tested were observed. Compact letter display indicates when a time step becomes significantly different from previous ones, thus suggesting at which time step there was a significant effect within each chemical. For example, time steps marked with an ‘a’ show significantly different results to those with a ‘b’, ‘c’ or ‘d’ whilst the label ‘ab' indicates that the reuslts for that time step were not significantly different to the results seen at the time steps marked ‘a’ or ‘b’.

(color online) Charcoal area changes over 6-h time step when subjected to widely used chemicals in charcoal analysis. Samples constitute a known mixture of modern charcoal types produced in the lab. For every chemical treatment and H2O control set n = 10. Color codes indicate the time steps at which significant differences between the chemicals tested were observed. Compact letter display indicates when a time step becomes significantly different from previous ones, thus suggesting at which time step there was a significant effect within each chemical. For example, time steps marked with an ‘a’ show significantly different results to those with a ‘b’, ‘c’ or ‘d’ whilst the label ‘ab’ indicates that the results for that time step were not significantly different to the results seen at the time steps marked ‘a’ or ‘b’.

Significant interactions were observed between treatment and time in both the 12-h and 6-h batches. In the 12-h batch (see Fig. 2, Supplementary Tables S2, S4), no significant differences were observed until T2, when H2O2 33% and (NaPO3)6 20% became significantly different from the H2O control. In T3, H2O2 33%, (NaPO3)6, and KOH were different from the H2O control, and in T4, H2O2 33% and KOH were different from the H2O control. In T4, H2O2 8% became significantly different from H2O2 33% and HNO3 50%. In the 6-h batch (see Fig. 3, Supplementary Tables S3, S5), NaClO 12.5% had significantly smaller charcoal areas in T2, T3, and T4 relative to NaClO 2.5% and H2O. In T4, the charcoal area observed in NaClO 2.5% also became significantly less than that of the control. For NaClO 2.5%, the final time step (T4) was significantly different from the preceding time steps with the exception of T0 (due to the large variation seen in the latter). A significant difference with time was also seen within NaClO 12.5%, with the first two time steps having significantly higher charcoal area than the later time steps (T2–T4).
Fossil charcoal
The nine sequences followed broadly similar patterns (Fig. 4); however, the charcoal area visually differs among individual layers. The chemicals tested did not result in significantly different areas of charcoal (Type II Wald chi-square test: χ2 = 0.1312, df = 2, pr (>χ2) = 0.9365), most likely due to high variability observed within each treatment. The GI-1 charcoal peak was found at the same depth in all sequences (Level 23), but it varied in magnitude among and within the chemical treatments (see Fig. 4). Although charcoal areas were slightly elevated above background, no consistent pattern among treatments or sequences can be discerned for the Younger Dryas interval. Similarly, although some values were slightly above background, no distinctive peak was seen within the early Holocene for the three sequences analyzed with NaClO 12.5%. In contrast, an early Holocene peak was observed within the H2O2 33% and HNO3 50% sequences, but it varied in magnitude and depth (see Fig. 4). This peak was observed at Level 5 in four sequences (see Fig. 4 A, C, D, and G) but at Level 4 in two of the sequences from the right-hand side of the monolith (see Fig. 1 F, I). The three sequences treated with HNO3 50% showed slightly higher charcoal area values in the GI-1 than the sequences treated with H2O2 33%; however, the reverse was true in the early Holocene.
(color online) Charcoal data obtained from the nine adjacent sequences (A–I) from Sluggan Bog (black line) and average area of the two adjacent sequences analyzed with the same chemical (grey dotted line indicating the average of the sequences shown in the top right corner of each panel). Note spatial arrangement of the sequences (same as in Fig. 1) and the application of chemical treatments in a linear fashion in sets of three. Levels 1–9: early Holocene (EH), 10–18: Younger Dryas (YD: GS-1), 19–27: late-glacial interglacial (LGI: GI-1).

Despite these discrepancies, significant positive correlations were observed within each chemical treatment between the 1 cm3 and the composite 2 cm3 samples (Table 2; H2O2 33% mean 0.54, NaClO 12.5% mean 0.716, HNO3 50% mean 0.73). Two of the sequences analyzed with H2O2 33% (A, D) were not significantly correlated with the associated 2 cm3 composite (p = 0.47 and p = 0.40, respectively). The three individual 1 cm3 samples within each treatment were also significantly and positively correlated (Supplementary Table S6; H2O2 33% mean 0.43, NaClO 12.5% mean 0.64, HNO3 50% mean 0.70), with the exception of sequences A vs. D and B vs. E, which were not significantly correlated. Overall, correlations were stronger between the samples and the composite area of the adjacent samples rather than between the individual 1 cm3 samples within each treatment.
Spearman correlation coefficients between each sequence and the sum of the two adjacent sequences analysed with the same chemical treatment. For all cores n = 27.

*Correlation significant at the 0.05 level
**Correlation significant at the 0.01 level
DISCUSSION
Effectiveness of chemical treatments on different sediment types
In the context of macroscopic charcoal analysis, the effectiveness of a chemical treatment on a sediment type can be measured by the success of the chemical in adequately disaggregating the sediment while leaving the charcoal particles intact. In our fossil experiment, clay-rich samples broke down easily with all chemical treatments, but organic-rich sediments were much harder to break down (Table 3). For the organic-rich sediments, H2O2 33% was the most successful chemical treatment. In HNO3 50%, conglomerates of organic matter existed, and in NaClO 12.5% small lumps of material sometimes remained; these were very carefully opened up under the microscope with a pair of tweezers within the petri dish to look for charcoal, which was found to be present. Another important factor is the success of a chemical in bleaching the sediment, especially if it contains many organics that tend to appear dark and thus may be confused with charcoal. In our fossil experiment, bleaching of the material was also easier in clay sediments rather than organics, where the treatments used had varying success in bleaching the organic material. Overall, NaClO 12.5% was the most successful bleaching agent for both organic and clay-rich sediments. In H2O2 33% and HNO3 50%, relatively dark material still existed. Especially in HNO3 50%, dark, angular conglomerates of organic material were frequently observed. These conglomerates visually resembled charcoal but turned to red dust when crushed. Eliminating such fragments made counting the charcoal more time consuming.
Subjective scores assigned to the various chemicals in several parameters.

These facts combined imply that use of NaClO 12.5% provided the easiest samples for counting charcoal, while HNO3 provided the hardest. Nevertheless, we do not recommend NaClO 12.5% given the marked decrease in particle size observed in both modern and fossil experiments. Similarly, we do not recommend HNO3 50% as it did not adequately bleach or digest our highly organic sediments, and it is a highly caustic chemical. Although H2O2 33% is also caustic, it was the most effective treatment for digesting and bleaching resistant highly organic sediments.
The effect of chemical treatments on the charcoal
Modern charcoal
Subjecting a mixture of modern charcoal types to widely used chemical treatments revealed that profound differences in area occurred within and among the treatments, depending on the duration of exposure. Significant deviations from the H2O controls were observed; additionally, the exposed samples were typically different from their starting point. Examining the number and area of charcoal (Table 4) suggests that the observed effects probably resulted from three processes: digestion, fragmentation, and expansion. Chemicals that digest the charcoal may operate initially on weaker particles, thus causing fragmentation and subsequent creation of new pieces. This would explain the increase in both charcoal area and number. In the NaClO treatments, fragmentation clearly took place (see Supplementary Fig. S1) but, as time passed, digestion probably became more prevalent as eventually both areas and numbers decreased. Thus, fragmentation and expansion were interconnected, with the final effect depending on which process became more prevalent. When the expansion of charcoal became the most dominant process, there was an increase in charcoal area but a decrease in charcoal numbers. It has been shown that charcoal becomes waterlogged (Nichols et al., Reference Nichols, Cripps, Collinson and Scott2000), and that compounds similar to wood still exist in the charcoal (Marynowski et al., Reference Marynowski, Kubik, Uhl and Simoneit2014), which indicates that the mechanisms responsible for shrinkage/swelling of wood can still be at play in charcoal. Furthermore, in pilot studies conducted by the authors, individual charcoal pieces submerged in H2O2 33% expanded, which is in agreement with the overall increase seen in the charcoal area. The decrease in numbers was unexpected but suggests some digestion, especially of smaller pieces, is also taking place. Of note, this pattern is seen in the least-potent chemicals used in this study ((NaPO3)6 20% and H2O 12 h).
Area and number trajectories from T0 to T4 for each chemical and possible dominant process explanation.

Our intention was to assess mixtures of heterogeneous charcoal types produced in various temperatures that would be representative of “natural” mixtures found in the fossil record. The study design created certain limitations with regard to the experimental results presented here. For example, existing differences in charcoal type and temperature formation may have been partly responsible for the variability observed, as it is well documented that charcoal resistance depends on the type of wood and temperature formation of the charcoal (Belcher et al., Reference Belcher, New, Santín Nuño, Doerr, Dewhirst, Grosvenor and Hudspith2018). How different treatments affect charcoal created from different wood types or formed under various temperatures could be an area of further research. However, this would be less applicable to palaeoenvironmental studies where such information is unknown prior to charcoal analysis. We also suggest caution in interpreting the number of fragments counted via image analysis, as in some cases when fragments touch each other the software cannot deduce that they are separate fragments. Also, small pieces may not be captured; thus, the number of fragments counted via image analysis may lead to erroneous results (see Supplementary Fig. S1). However, most fire history studies based on charcoal numbers are done by manual counting of sieved fractions.
In our experiment, all pieces were monitored in the petri dish for the duration of all time steps. This is very different from palaeoenvironmental reconstructions where the sediments containing the charcoal are wet sieved after the addition of the chemical. It is thus important to note what the effect of these chemical treatments would be on the “true” charcoal content of sediments. When fragmentation-inducing chemicals are used, more charcoal would be expected to be lost during the wet-sieving process, leading to lower area and number. Expansion-inducing chemicals would be expected to produce higher charcoal area and perhaps the same or comparable charcoal numbers. Digestion-inducing chemicals would be expected to produce lower charcoal area and numbers, again with increased losses during sieving.
These considerations aside, our study clearly shows that chemicals widely used for deflocculating and/or bleaching sediments have an effect on modern lab-produced charcoal. This finding is important because lab-produced charcoal has been found to be more resistant to degradation than wildfire-produced charcoal (Santin et al., Reference Santín, Doerr, Merino, Bucheli, Bryant, Ascough, Gao and Masiello2017). Thus, in the context of palaeofire reconstructions, the chemical treatments could be expected to have even more profound effects. Differential effects on charcoal are likely to influence the loss or retention of fragments during the sieving process. These would create biases when comparing absolute charcoal metrics or charcoal trends between studies, thus emphasizing the need for a standardized method to be adopted.
Fossil charcoal
Area and charcoal numbers are for all nine sequences were positively and significantly correlated (Supplementary Table S7). The Sluggan Bog results largely replicate the results obtained from the modern experiment, implying that the results of our modern experiment have validity when considering fossil charcoal.
Sequences B, E, and H, analyzed with NaClO 12.5%, have the lowest charcoal area values. This is consistent with the findings of the modern experiment—that this chemical led to a significant decrease in area over the duration of the experiment. We thus attribute this finding to the enhanced digestion and/or fragmentation of the pieces, which perhaps led to a large amount of charcoal being lost during the wet-sieving process. Furthermore, an early Holocene peak, typically evident in all remaining six sequences, is consistently missing from all three NaClO 12.5% samples. The specificity of this signal to the early Holocene samples subjected to NaClO 12.5% suggests a difference in charcoal type within the early Holocene (relative to earlier periods) that was more susceptible to NaClO 12.5%. The reasons for this cannot be established using currently available information but it may relate to differences in the pyrolisation degree (i.e., temperature formation of the charcoal).
The results obtained from HNO3 50% and H2O2 33% were relatively comparable. However, for two out of the three sequences analyzed with HNO3 50%, the early Holocene peak was evident at adjacent depths (Level 4 instead of Level 5). This is attributed to lateral variability in the distribution of charcoal as opposed to a variation produced by the treatment (HNO3). Lateral variability may also have contributed to the finding that there were no statistically significant differences among the treatment types, despite the profound differences in charcoal area, when applied to the fossil data.
Lateral variability and sample volume
Lateral variability within sedimentary archives in charcoal content has implications for the replicability of charcoal data and the representative sample volume needed to achieve consistent results from sediments. Only a few studies have looked at the consistency between charcoal series collected from the same lake. High variability has been reported for both microscopic and macroscopic charcoal (Edwards and Whittington, Reference Edwards and Whittington2000; Schlachter and Horn, Reference Schlachter and Horn2010). Intensive coring regimes from within a single lake have revealed that although charcoal profiles can vary markedly between sampling locations (see fig. 2 in Whitlock and Anderson, Reference Whitlock, Anderson, Veblen, Baker, Montenegro and Swetnam2003), multiple cores taken from a single sample location were much more consistent (Whitlock and Millspaugh, 1996, cited in Whitlock and Anderson, Reference Whitlock, Anderson, Veblen, Baker, Montenegro and Swetnam2003). The latter situation resembles our sampling design, and indeed only minor variations were observed during the Younger Dryas, even in sequences analyzed with different chemicals. However, in our case, this may be the result of the relatively low values of charcoal with the signal representing possibly only background noise.
Within peat bogs, the amount of charcoal decreases from the margins toward the center of the peat deposit (Pitkänen et al., Reference Pitkänen, Tolonen and Jungner2001; Halsall et al., Reference Halsall, Ellingsen, Asplund, Bradshaw and Ohlson2018). To the best of our knowledge, however, there have been no previous studies that assess the variability between horizontally adjacent samples in peat bogs. Within the current study, comparisons of the peat sequences found that the charcoal peaks sometimes occurred at different depths. This was particularly noticeable for the early Holocene peak; in contrast, the GI-1 peak was present at the same depth in all sequences. We hypothesize that this is a result of lateral variability and the unevenness of the local surface of the bog at the time of growth. For example, the presence of hollows or hummocks toward the right-hand side of our monolith (i.e., sequences C and F) could explain the horizontal distribution of the lower charcoal peak. This variability was unlikely to apply to the sequences treated with NaClO 12.5%, as these were located in the middle of our samples (see Figs. 1 and 3 for spatial arrangement of the sequences). Another possibility that could explain the observed pattern is the ignition and smouldering of the peat itself, which could have propagated horizontally and vertically. However, when the peat matrix ignites, it typically consumes any charcoal it produces (Rein, Reference Rein and Belcher2013), although some charcoal may have been left behind when the smouldering front met a barrier such as a surface edge or changes to the bulk density or moisture content of the peat (Rein, Reference Rein and Belcher2013; Prat-Guitart et al., Reference Prat-Guitart, Rein, Hadden, Belcher and Yearsley2016a, Reference Prat-Guitart, Rein, Hadden, Belcher and Yearsley2016b). This may have been the case with the early Holocene peak, thus explaining why the peak is evident is some sequences only. New et al. (Reference New, Belcher, Hudspith and Gallego-Sala2016) showed that evidence of smouldering fires can be preserved in the palaeorecord; however, charcoal produced by smouldering and surface fires can be identical. A low-temperature fire that propagated vertically could explain the susceptibility of the early Holocene charcoal to NaClO 12.5%, as low-temperature charcoals are generally shown to have lower resistance (Belcher et al., Reference Belcher, New, Santín Nuño, Doerr, Dewhirst, Grosvenor and Hudspith2018); however, as charred peat aggregates were not present in any of the levels analyzed this suggestion remains speculative.
Both the 1 cm3 and 2 cm3 sample volumes provide consistent charcoal profiles within each chemical treatment (see Table 2 and Supplementary Table S6). Thus, the 1 cm3 volume can be considered reliable when constructing profiles; however, the differences in absolute area (and numbers) suggests that direct comparisons of these metrics should not be undertaken between samples analyzed with different treatments. For lake sediments, it is possible that increasing the volume sampled from a single stratigraphic interval may result in more consistent charcoal profiles or fewer differences in absolute area, as suggested by Schlachter and Horn (Reference Schneider, Rasband and Eliceiri2012). With regards to peat this cannot be supported by our findings and remains to be tested further.
Methodological implications
The results of our modern experiment and their validity for fossil sequences clearly shows that chemicals used in charcoal extraction have a significant effect on charcoal area and may also change charcoal numbers. It is expected that those effects impact other charcoal metrics as well, such as morphotypes, aspect ratio, and circularity, which are often employed in charcoal studies (e.g., Crawford and Belcher, Reference Crawford and Belcher2014; Marriner et al., Reference Marriner, Kaniewski, Gambin, Gambin, Vannière, Morhange and Djamali2019; Rehn et al., Reference Rehn, Rehn and Possemiers2019).
Our findings have important implications regarding what chemicals should be used within individual fire reconstructions. They demonstrate that the same chemical should be used throughout a sequence, as suggested by Schlachter and Horn (Reference Schlachter and Horn2010); however, differences in fire regimes through time and the degree of pyrolisation of the resulting charcoals can still mean that the charcoal metrics measured may be varyingly influenced by the chosen chemical throughout a core.
Based on our fossil experiment, and especially for highly organic sediments, we recommend the use of H2O2 at 33%. The modern experiment showed a significant increase in charcoal area by 12 h with relatively minor changes after 24 h. Some authors may argue against the use of H2O2 33% based on the findings of Schlachter and Horn (Reference Schlachter and Horn2010), who found varying resistance of charcoal fragments to varying concentrations of H2O2. However, in that experiment, as the authors also suggest, the varying resistance may have been the result of sieving, which can induce fragmentation and loss of fragments. This is supported by our finding of increased charcoal area and number where samples were kept in the petri dishes rather than sieved. We also observed a greater increase in the stronger concentration (i.e., 33%). This suggests a greater effect with increasing chemical strength. Thus taking into account the charcoal loss evident for NaClO 12.5%, we consider H2O2 33% the best option, especially for highly organic sediments. It should be noted that H2O2 33% should only be used with due caution, after consulting the relevant material safety data sheet and while wearing appropriate personal protective equipment, as the caustic nature of this chemical means strong concentrations can be extremely harmful.
NaClO 12.5% was possibly the most aggressive of the treatments, eliminating the organics and making the charcoal easier to identify but at the expense of reducing the amount of charcoal found. Long exposures (24–48 hours), especially in high concentrations, could hamper or even result in erroneous results due to the significant loss of charcoal observed in our fossil experiment. No statistically significant differences in charcoal area were observed in the NaClO 2.5% treatments, although a non-significant decreasing trend was observed over time. However, because NaClO 2.5% is not able to break down highly organic sediments, pretreatment in KOH is recommended for resistant, highly organic sediments. Based on the results of the modern experiment the pretreatment should not exceed 36 h.
Such a two-part process, where deflocculation is performed separately from bleaching, would also necessitate a second sieving step. The effect of this additional sieving step on charcoal would need to be quantified as it may exacerbate charcoal loss (Schlachter and Horn, Reference Schlachter and Horn2010). Furthermore, the effect of heating of samples (employed by some workers to maximize efficiency of chemical treatments) should also be systematically assessed. Quantifying the effects of such methodological variations on charcoal could potentially result in a more refined method for standardized charcoal analysis. Until such work has been undertaken, we recommend that H2O2 33% be used for all sediment types.
The fossil results further underscore the necessity of developing a standard method to enable comparison of charcoal records. The sieving process is likely to amplify differences between chemical treatments and thus induce biases when comparing absolute numbers or areas between studies. This is especially important for studies that incorporate multiple charcoal records analyzed with different chemicals to create regional or global fire histories (e.g., Marlon et al., Reference Marlon, Bartlein and Whitlock2006; Power et al., Reference Power, Marlon, Ortiz, Bartlein, Harrison, Mayle and Ballouche2008). These biases are very likely propagated in the various techniques used to standardize and transform to Z-scores. There is a pressing need to develop a standardized method to facilitate and enhance such research.
CONCLUSION
Our study systematically assesses the effect of a variety of chemical treatments on charcoal area, which has important implications for fire history reconstructions. The results of our modern experiment may be applicable to other sediment types as well (e.g., not exclusively lacustrine/peat records).
The use of modern charcoals allowed us to monitor and quantify the progressive effect of the chemicals on the charcoal. Although the results obtained were largely replicated in our fossil experiment, especially for NaClO 12.5%, the large variability among horizontally adjacent levels in peat samples complicated the interpretation of the results obtained. Discrepancies in the conditions of fossil and modern charcoals were observed, as oven-produced charcoal is more resistant than charcoal produced during a wildfire, which is the case with our fossil sequences.
Aside from these limitations, based on the results presented in this study we draw five main conclusions: (1) The adoption of common chemical treatments in charcoal analysis should be encouraged; (2) High concentrations of NaClO, in particular, were found to cause marked decreases in charcoal area and number, and thus its use is not recommended for palaeofire studies or other studies that require the high-resolution quantification of charcoal; (3) We do not recommend the use of HNO3 50% for highly organic sediments because it is much more time consuming to quantify charcoal effectively; (4) H2O2 33% was found to be the preferred choice among the chemical treatments tested for determining charcoal concentrations, especially in highly organic sediments. We note, however, that due caution must be taken when handling this chemical due to its highly corrosive nature; (5) Adjacent macroscopic charcoal sequences in peat sediments showed some variability; however, 1 cm3 typically provided replicable charcoal profiles.
ACKNOWLEDGMENTS
This work has been part of doctoral research funded by a University of Portsmouth bursary. The authors would like to thank Professor John Lowe and Dr. Ian Matthews of Royal Holloway University of London for allowing us access to the Sluggan Bog archived core material. We would also like to thank the Global Paleofire Working Group (Phase 2) for fruitful discussions, Dr. Alberto Morales (Forest Research) for advice on chemicals, and Dr. Linley Hastewell for significant help with the experimental design and advice on health and safety. Helpful comments and suggestions from both reviewers, which have greatly improved this manuscript, are appreciated.
SUPPLEMENTARY MATERIAL
The supplementary material for this article can be found at https://doi.org/10.1017/qua.2020.56.