


Introduction
In order to understand the interaction between the ocean and atmosphere in ice-covered regions, it is important to pay close attention to sea-ice dynamics. The movement of sea ice impacts the transport of salt and heat, and hence the ocean dynamics. Sea-ice motion is, to a large extent, driven by wind, ocean currents and internal ice stress. Convergent ice motion causes features such as ridges and rubble fields, which change the momentum balance between atmosphere, ice and ocean. Openings in the ice at locations of divergent motion influence the exchange of heat and matter between ocean and atmosphere. The development of compression structures and leads in the ice affects the ice mass per unit area (local mass balance). For these reasons it is necessary to examine sea-ice motion to understand the role of the polar ice cover in the climate system.
Ice motion can be tracked by analysing a time series of spatially overlapping satellite images. It is convenient to use data from satellites operating at microwave frequencies, since they are not influenced by clouds or light conditions. In our work, we use high-resolution synthetic aperture radar (SAR) data from satellites operating at C-band frequencies (∼5GHz). More specifically, ice-motion tracking in satellite imagery uses feature-tracking (Reference Giles, Massom, Heil and HylandGiles and others, 2011; Reference Komarov and BarberKomarov and Barber, 2012) or block-matching techniques (Reference Lavergne, Eastwood, Teffah and SchybergLavergne and others, 2010). Often, block matching is extended to a multiscale approach, where patterns in the sea ice are tracked between two consecutive images using a series of nested correlations (Reference FilyFily and Rothrock, 1987; Reference Thomas and KamhamettuThomas and others, 2011; Reference HollandsHollands, 2012; Reference KarvonenKarvonen, 2012). From the resulting motion fields, deformation processes taking place in the time interval between image acquisitions can be inferred.
Drift-detection algorithms are well established, and retrieved motion and deformation fields have been validated using buoy arrays (Kwok and others, 1990; Reference LindsayLindsay and Stern, 2003). Those analyses were conducted on spatial scales of 10-1000 km, where a sufficient amount of buoy data was available.
Sea-ice deformation is highly localized (Reference Hutchings, Heil and SteerHutchings and others, 2012), and it is thus desirable to also analyse deformation processes on smaller spatial scales. However, a detailed validation of ice-drift and deformation maps generated from SAR data is hampered by the scarcity of buoy tracks within the relatively small area covered by high-resolution satellite images. For this reason, alternative methods for validating ice-drift and deformation products generated from SAR data need to be introduced. In this paper, we describe a method which relies on the image information itself, and does not require external measurements.
Sea-Ice Drift and Deformation Detection from SAR Data
A pair of Envisat ASAR (Advanced SAR) Image Mode scenes acquired over the Weddell Sea on 26 and 27 August 2006, with a temporal separation of 1.19 days, provides an interesting example for our analysis (Fig. 1). The upper part of the image is occupied by a grounded iceberg (A23-A). Stabilized by the iceberg, the left half of the surrounding sea ice is stationary in the time between image acquisitions. While the ice in the right part of the image drifts to the north, several leads can be observed to open and close.
SAR image from the Weddell Sea, acquired on 26 August 2006. The reference point locations are marked with white crosses. Inset: Antarctic map showing location of the test site.

The SAR scenes were radiometrically calibrated and resampled from the original 12.5 m pixel size to pixels of 25 m for speckle reduction. Both images were geocoded and sampled to a common reference frame. The scenes were subsequently cut to their overlapping area and have a spatial extent of ∼100 km x 100 km. In the following, the zonal direction in the coordinate system is denoted x, and y is the meridional component. The respective velocity field components are u (in the x-direction) and v (in the y-direction).
For an analysis of the drift-detection algorithm, 300 reference points were chosen by visually detecting corresponding structures in the ice in both images. The locations of those points are shown in Figure 1. We estimate their mean location accuracy to be ∼± 1 - 2 pixels (25-50 m).
Sea-ice drift is detected using a pattern-matching approach, which combines phase correlation with a normalized cross-correlation technique to identify matching structures in two images (Hollands and Dierking, 2011; Thomas and others, 2011; Hollands, 2012). Patterns at different spatial scales are identified using an image pyramid that comprises different spatial resolutions of the SAR data. The search is run multiple times, iteratively refining the resolution of the resulting drift field. For each iteration step, an intermediate velocity field is calculated, which is then used to initialize the next step. Our example set-up uses five iterations to calculate the drift field, which has a spatial resolution of ˜500 m. The result (Fig. 2) compares well with the visual analysis.
Determination of drift field reliability
Error analysis of the drift and deformation fields obtained from our cascaded motion-tracking algorithm is not straightforward. Beyond buoy data (which often are unavailable) and hand-picked reference points (which are very time-consuming to generate), we use two basic approaches to evaluate the reliability of drift fields calculated from SAR data:
Texture analysis, which works under the assumption that pattern-matching algorithms fail if there is insufficient texture in the images (e.g. in apparently homogeneous new-ice areas or on icebergs/ice shelves). Extending the image cross-correlation, different statistical and texture parameters are employed to identify regions where the drift-detection algorithm is likely to fail. Those parameters are combined in a single metric. A threshold empirically determined by Reference Hollands, Linow and DierkingHollands and others (2014) is then used to separate reliable from unreliable regions (Fig. 3a).
Sea-ice motion field for the pair of SAR images acquired on 26 and 27 August 2006 with a temporal separation of 1.19 days.

Ice-drift reliability indicators for the pair of SAR images acquired on 26 and 27 August 2006. (a) Texture analysis: values <2 correspond to reliable drift vectors. (b) Backmatching difference: values <3 correspond to reliable drift vectors.
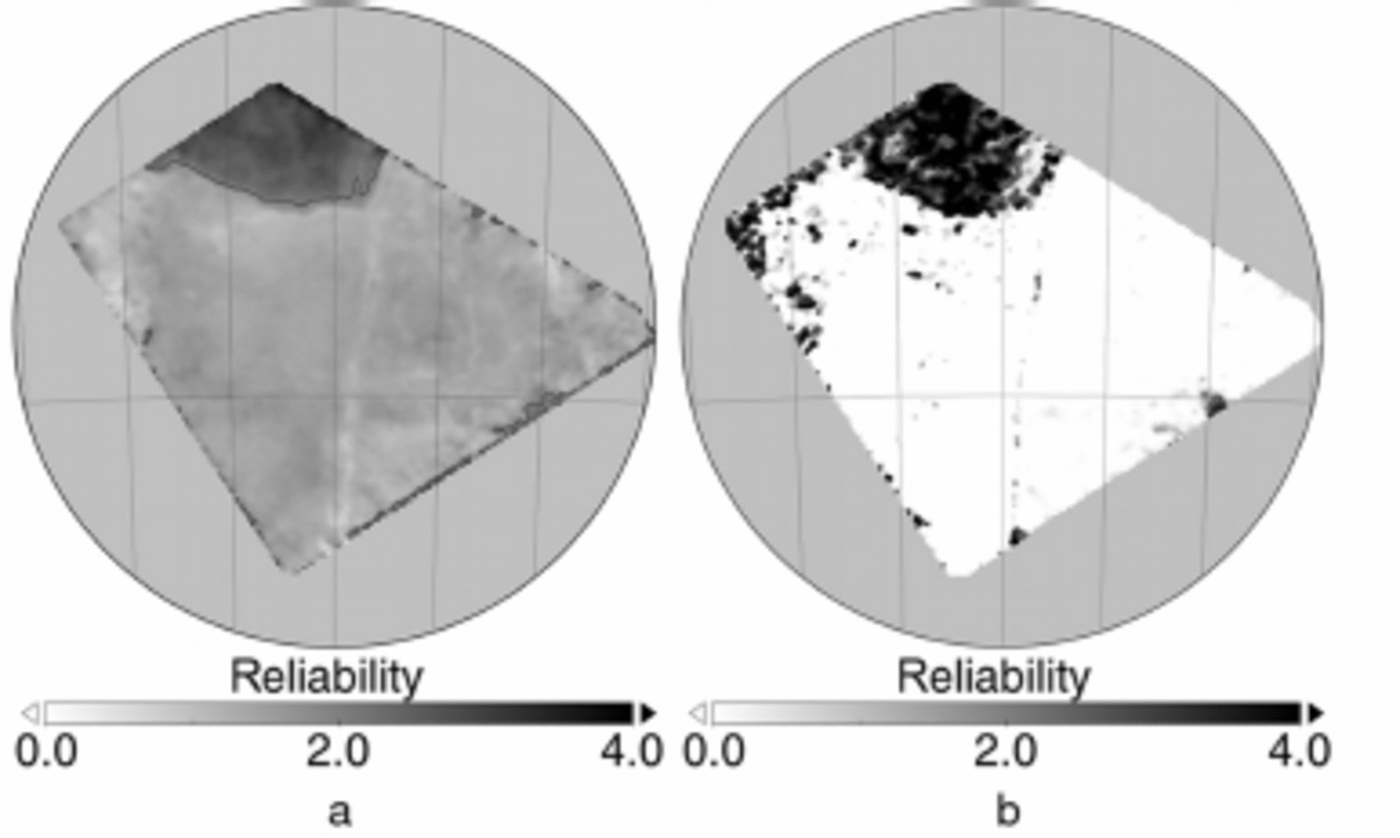
Backmatching, which is a simple consistency check. Here the drift field is calculated twice, once with a reversed image order. In theory, identical patterns are matched during both runs and the difference between the resulting drift fields is zero. However, in the case of mismatches, due to insufficient texture or periodically repeating patterns, the difference between the two drift fields can be quite large. The backmatching difference depends on ice-drift speed. For this reason we calculate a normalized backmatching difference to account for drift speed and then apply a threshold to identify the reliable vectors (Fig. 3b). In this case, the threshold value was again determined empirically (Reference Hollands, Linow and DierkingHollands and others, 2014).
In both instances, thresholds were empirically determined to identify regions where sea-ice motion detected by our drift algorithm can be considered reliable. Threshold values were set by combining histogram analysis and visual inspection of the retrieved motion vectors and reference data.
Calculation of sea-ice deformation parameters
In principle, the deformation of sea ice in the time, At, between image acquisitions can be derived from the calculated velocity field. This is usually done by calculating the invariants of the strain-rate tensor from the partial derivatives of the velocity field (Reference Thorndike and ColonyThorndike and Colony, 1982):

The total deformation of the drift field is given by

Sea-ice deformation zones appear to be highly localized features, and many of their properties are still poorly understood (Reference Herman and GlowackiHerman and Glowacki, 2012), especially on small spatial scales. It is not yet clear how deformation fields calculated from SAR data can be independently validated. One possibility is to conduct a classification of ice types or an analysis of sea-ice scattering properties. Here deformation structures can be identified under the assumption that deformed ice and level ice can be separated, based on their microwave-scattering properties (Reference Dierking and DallDierking and Dall, 2007, Reference Dierking and Dall2008). This approach can be used to infer deformation history, but a quantitative comparison with deformation rates obtained from ice-drift analysis is not feasible. Field data exist from buoys (Reference Rampal, Weiss, Marsan, Lindsay and SternRampal and others, 2008; Reference Hutchings, Heil and SteerHutchings and others, 2011, 2012), from laser profiling (Reference Haas, Liu and MartinHaas and others, 1999) and, historically, from drift stations (Reference Leppäranta and HiblerLeppär-anta and Hibler, 1987). Due to the limited coverage of SAR images, coincident buoy and SAR data acquisitions require significant logistical effort. Another problem is that the temporal sampling that can be achieved with recent SAR missions is not sufficient for studying high-frequency motion of the order of less than a few hours.
Results
Sea-ice drift reliability
In our example (Fig. 2) we expect the algorithm to work poorly on the iceberg, due to a lack of texture. In this case, the algorithm generates spurious drift vectors by randomly correlating noise. Image borders pose another problem: patterns drifting into or out of the images cannot be matched, and the extent of such regions depends on ice velocity. We generated reliability maps using both texture analysis and backmatching (Fig. 3). The results agree with each other, indicating the iceberg and parts of the image borders as areas where the retrieved drift should be regarded as unreliable.
Using a mean location error, αu, ref, of ±50m (2 pixels), the mean error of the reference velocity components, cru, ref , is calculated (the mean error of the time measurement α t ≪C αu, ref and can be neglected)

The u- and v-components of the drift vectors from both forward and backward runs of the ice-drift algorithm are compared with the reference data. To this purpose, the calculated velocities are interpolated at the locations of the reference points. The differences between reference and calculated drift u- and v-components are ∆ u = uref u calc and ∆ v = v ref v calc, respectively. Mean absolute deviations, ∆ u = 31.00 ± 47.84 m d 1 and ∆v = 39.43±85.43 m d 1, are below the location error of the reference data (Eqn (3)). Hence, the velocities derived from motion tracking are in very good agreement with the reference data and our dataset is, in principle, suited to analysing sea-ice deformation derived from the velocities.
Sea-ice deformation
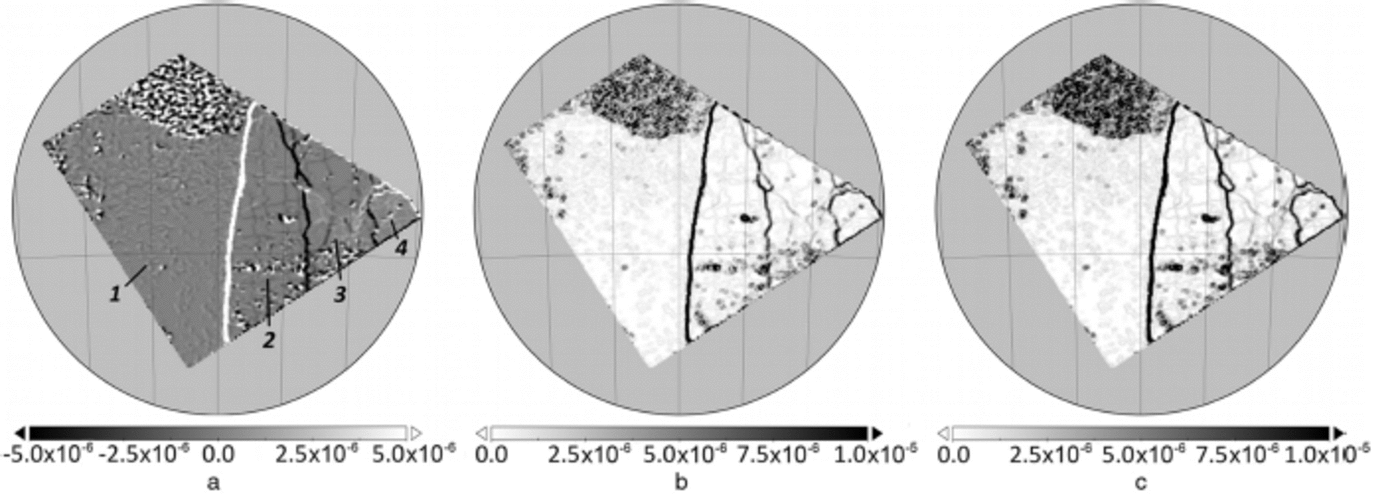
From the velocity field (Fig. 2), the deformation parameters are determined according to Eqns (1) and (2). The derived deformation parameters (Fig. 4) show spatial features, including those labelled in Figure 4a: stationary ice; relatively fast ice drift northwards; low velocities, in a northeasterly direction; and faster ice drift, eastwards. As a consequence, three distinctive deformation zones appear, separating the regions of different drift velocity (Fig. 4). The deformation zones are mainly characterized by shear (due to different drift speeds along the same direction; Fig. 4b) and divergence (caused by opening and closing of leads; Fig. 4a).
Sea-ice deformation (s 1) calculated from the motion field. (a) Divergence (labels: 1 . stationary ice; 2. relatively fast ice drift northwards; 3. low velocities, in a northeasterly direction; and 4. faster ice drift, eastwards). (b) Shear. (c) Total deformation.
The reference data points are sampled with a spatially irregular distribution and in no particular order. Hence, they cannot be directly compared with the deformation values obtained from the velocity field. Deformation characteristics are computed for each sampled point, P, in the following way:
-
Create a Delaunay triangulation between reference points.
-
Based on the triangulation, find the points, pi, adjacent to P (Reference LeeLee and Schachter, 1980). These are used to calculate the linear approximation of the partial derivatives (following Reference LindsayLindsay and Stern, 2003):
(4)
where un+ 1 = u1, yn+ 1 —y1 and the area, A, is calculated using Gauss's area formula. The other partial derivatives are determined analogously to Eqn (4). The deformation tensor components are then obtained from Eqns (1) and (2).
-
Since we know the mean error of the reference point locations from Eqn (3), we can estimate the mean error of the reference deformation tensor components using the error propagation approach of Reference LindsayLindsay and Stern (2003) (Fig. 5c).
-
The spatial resolution of the computed velocity field is ∼500m, while the reference values are sampled at distances ranging from a few hundred metres to several tens of kilometres. To ensure comparability between calculated and reference values, we resample the calculated velocity field components to the locations of the reference points. This way, the calculated deformation values from both methods are representative of exactly the same region. Deformation tensor components of the velocity field are then derived by repeating steps 1 and 2.

Validation
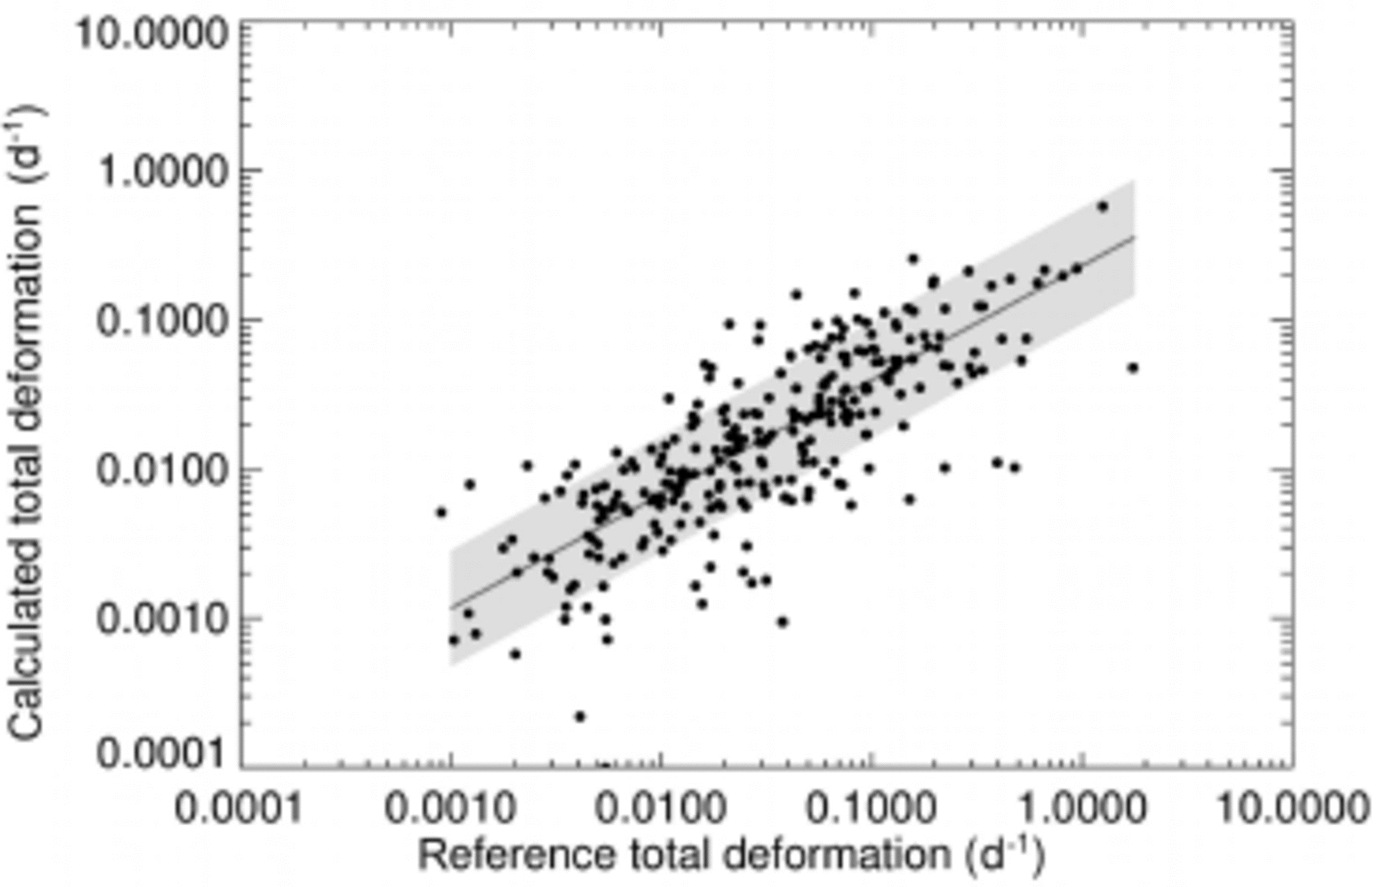
The resulting maps of total deformation (Fig. 5a and b) are visualized using Voronoi cells derived from the Delaunay triangulation. Here we can identify the main deformation zones, that are also found in the distribution of total deformation (Fig. 4c). The spatial distributions of retrieved deformation parameters are very similar. Since the velocity field from motion tracking is repeatedly smoothed during iterations, we expect deformation parameters derived from the motion field to be lower than the associated reference values. This effect is visible in Figure 5a and b, where reference deformation values are systematically higher than values determined from the velocity field. A direct comparison of calculated and reference values indicates that the calculated deformation rates are systematically underestimated by a factor of ∼0.77 (Fig. 6).
Total sea-ice deformation at the reference point locations. (a) Reference data, (b) calculated values and (c) standard deviation of total deformation calculated from the reference points. Note the different ranges of values.

Reference vs calculated total deformation. The dark grey line is the linear regression: log10( c) = 0.77 log10(
r) 0.64, where
c is calculated total deformation and
r is reference total deformation. The light grey area shows the standard deviation of the regression (±log10(0.38)).
The standard deviation of the total deformation calculated from the reference points (Fig. 5c) is larger for smaller areas, which indicates that reference deformation derived from smaller areas is more strongly influenced by the error of the velocity vectors. An increase of the sampling area, however, tends to suppress small-scale deformation structures. The deformation error also depends on the polygon configuration. It is higher for fewer vertices (see Reference Hutchings, Heil and SteerHutchings and others, 2012, for a detailed analysis). From the available data, we find that for deformation rates " tdef > 0.03 d 1, 90% of the values exceed the position noise level, while for "tdef < 0.03 d 1, only 25% are above the noise level.
In analogy to the analyses of sea-ice deformation scaling properties by Reference Marsan, Stern, Lindsay and WeissMarsan and others (2004) and Reference Rampal, Weiss, Marsan, Lindsay and SternRampal and others (2008), we calculated a length scale, L = [∼A, from the polygon area and plotted the total deformation, " tdef, with respect to L (Fig. 7). It is inherent in the design of our cascaded motion-tracking algorithm to calculate drift velocities at different spatial scales. In this process, velocity fields are calculated repeatedly at increasing resolution, where the intermediate low-resolution velocity fields are used to initialize the next iteration steps in order to increase the numerical stability of the algorithm. We make use of this property to calculate total deformation from the intermediate velocity fields, using Eqns (1-4). The derived results show a reasonable match with the reference data (Fig. 7).
Total deformation vs length scale. Crosses denote total deformation calculated from the reference data, small dots are  from the intermediate velocity fields, and large dots are their mean values.
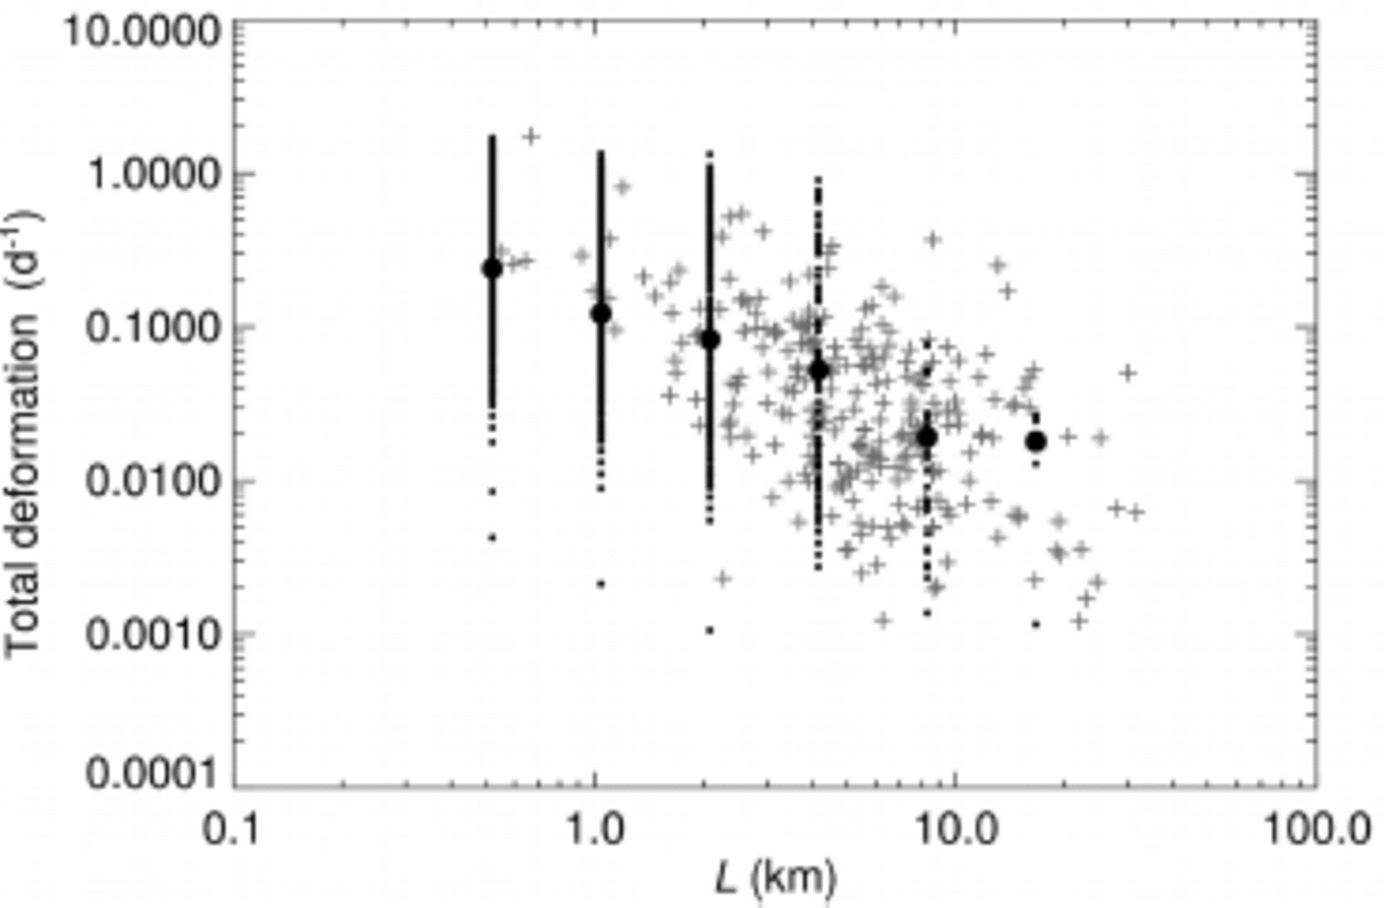
At this point, it has to be considered that the reference points can only be located along visible structures. This effect results in a reduced sampling rate at smaller spatial scales, which might also introduce a bias to the apparent slope of the reference data cluster. However, our analysis shows that results from both methods are of the same orders of magnitude and have a comparable range.
The total deformation rates found by our analysis are also consistent with results derived from buoy data, if temporal and spatial scaling properties are considered. In our case of a 1 day temporal separation between image acquisitions, the spatial scaling law exponent calculated from the intermediate deformation fields is H = 0.74, which is a reasonable value compared with values reported by Rampal and others (2008), of H = 0.85 for a 3 hour period, and H ∼ 0.7 for a 3 day period.
Conclusion
To improve our understanding of the physics behind ice-deformation processes, it is important to include ice-deformation observations on small spatial scales. Sea-ice drift products generated from SAR data can, in principle, be used to derive information about ongoing deformation processes at high spatial resolutions. However, it is difficult to validate the derived deformation parameters at a high level of detail, even where external data from buoys are available. In this study, we suggest a method to assess the quality of the deformation parameters derived from a sequence of SAR images. This method does not require field data, but instead relies on careful analysis of tie points in the SAR images.
Our results indicate that the deformation calculated from SAR data exhibits similar statistical properties to the reference data obtained from visual analysis. The results are also comparable to deformation rates obtained from buoys. With the proposed technique, it is possible to reproduce scaling characteristics of sea-ice deformation which were previously observed in buoy data analysis (Reference Marsan, Stern, Lindsay and WeissMarsan and others, 2004; Reference Rampal, Weiss, Marsan, Lindsay and SternRampal and others, 2008; Reference Hutchings, Heil and SteerHutchings and others, 2012).
However, several issues remain to be addressed. Most importantly, the effect of the filtering and smoothing steps within the cascaded motion-tracking algorithm needs to be quantified. We can see that this introduces a bias, but further analysis is necessary to properly quantify this bias and find a method to correct the results accordingly. In our current approach, deformation rates are calculated on an irregularly sampled grid. In this case, the error of the deformation rates also depends on the shape of the sampled polygons. Hence, further studies need to evaluate the impact of the spatial properties of the tie-point configuration on the uncertainty of the deformation rates. As a last point, this work focuses on the development of a method to evaluate sea-ice properties derived from SAR data analysis, and is therefore restricted to a limited amount of data. Further studies need to include more data in order to develop a representative view of the heterogeneous nature of sea ice.
Acknowledgements
We thank J. Hutchings for her invaluable insight and comments. S.L. and W.D.’s contributions to this study are part of the European Union 7th Framework project SIDARUS (grant agreement No. 262922). T.H. is funded by the Alfred Wegener Institute in the framework of the German Earth Observing Network (Network EOS) and by the Federal Ministry of Economics and Technology within the frame of project 50 EE 1217. SAR images were provided by the European Space Agency for the Cat-1 project C1P.5024.



