On July 22, 2011 Norway was struck by a terror attack of unprecedented magnitude. A car bomb was detonated outside the offices housing the central government killing eight, with another 69, mostly teenagers, brutally massacred at a Labor Party youth camp at Utøya outside Oslo. The perpetrator, a 32-year-old right-wing extremist, had specifically targeted political talents in a deranged scheme designed to thwart the future of the governing party in Norway.
Terror attacks have been found to exert a powerful effect on civic attitudes and behavior in the short term. In the months after September 11, interpersonal trust, trust in government and police grew and ethnic minorities were evaluated more favorably (Putnam Reference Putnam2002; Traugott et al. Reference Traugott, Brader and Coral2002). Trust in government after September 11 rose to a level not seen since the mid-1960s (Chanley Reference Chanley2002). With regard to civic engagement, more people professed interest in public affairs, and those already engaged in organizations volunteered more. There was little or no change in participation in political or community meetings, however, nor in the propensity to join community organizations (Putnam Reference Putnam2002; Traugott et al. Reference Traugott, Brader and Coral2002). In summary, in the short term, attitudes changed more than behavior. Furthermore, the positive effects on trust and civic engagement waned quickly, and retracted to pre-2001 levels within months (Sander and Putnam Reference Sander and Putnam2010).
Contrary to the United States, where trust levels had been declining for a long time before the September 11 attacks, Norway has consistently been one of the highest-ranking countries in every cross-national survey measuring trust and/or civic engagement in the past 30 years. The proportion of people agreeing that “most people can be trusted” is almost twice as high as in the United States (Delhey and Newton Reference Delhey and Newton2005). Trust in government is also very high in a comparative perspective (Catterberg and Moreno Reference Catterberg and Moreno2005).
The explanations of this position are complex and too extensive to examine closely here. Keep in mind, however, that the historical roots of high trust in Scandinavia run deep. In the United States, nineteenth-century Scandinavian immigrants were commonly regarded as somewhat simple-minded and credulous. Many jokes were (and still are) based on the stereotypical “dumb Norwegian” or “dumb Swede” (Trägårdh et al. Reference Trägårdh, Blennberg, Bråkenhielm, Grosse, Lundåsen and Pettersson2009; Rappoport Reference Rappoport2005). The high level of interpersonal trust has been maintained, in part, by a high degree of cultural and economic similarity in Norwegian society as well as the cultural heritage of Protestantism and a gradual democratization based on peaceful mass mobilization. These factors laid the foundations of a strong civil society. Some domestic commentators see Norway as a peaceful outpost of Europe, shielded from the harsh realities of a brutal world, such as war or terror. Based on this reasoning, which is reminiscent of the “dumb Norwegian” stereotype, one author has characterized the Nordic region as a “museum of gullibility.”Footnote 1
If Norway ever was such a pristine and naïve society, the terror attacks of July 22, 2011 represented a brutal end of innocence. How does a nation of trusters respond to inhuman atrocities?
On the one hand, in light of the “end-of-innocence” hypothesis, the shock of the events should be expected to heighten the sense of fear, instill a sense of caution when dealing with others, and encourage widespread withdrawal from public life. In the aftermath of the July atrocities, some parts of the international media argued that Norway's lax security measures, reflective of a naïve culture with no experience of terrorism, were partly to blame for what happened.Footnote 2 The lack of surveillance, of armed guards, and other precautions all bore witness to the high level of trust—or in a more cynical view, gullibility—in Norway prior to July 22. Confronted with the violent realities of the world, however, Norwegians were forced to be more circumspect in their dealings with each other. Whereas countries with more experience of war, terror, and violence have reacted by huddling together in the short term, the end-of-innocence hypothesis suggests an opposite effect for a high-trust society: more fear, skepticism, and caution.
On the other hand, one could see Norway's strong social capital, that is, the prevailing sense of trust and networks of civic engagement, prior to the terrorist attack, as a vital resource in coping with shock and tragedy. A cohesive community should mobilize a sense of national unity and rally support of common values and democratic ideals. Moreover, Norway is also characterized by a strong relationship between interpersonal and institutional trust (Wollebæk Reference Wollebæk, Wollebæk and Segaard2011). Therefore, the role of political leadership in responding to the crisis during the days following the terror attacks may also have been a crucial determinant in explaining eventual changes in the attitudes of the population.
In this article we investigate the terror attack's impact on public opinion in a high-trust nation such as Norway a few weeks after the events. We focus particularly on the effects of terror on interpersonal and institutional trust, experienced fear, and on civic engagement. Through these interlinked themes we explore whether the end-of-innocence thesis gains more support than the remobilization-of-trust hypothesis.
DATA
The data on which the analyses below are based consist of two parts: 1) Two separate cross-sectional surveys of the adult population undertaken in March/April 2011 (N = 1130) and between August 12 and August 17, 2011 (N = 931). These surveys are referred to as “population samples.” The response rates for both these surveys were 48%. 2) A panel of 2,252 social media users (who use Facebook twice or more per week and/or Twitter once or more per week) were interviewed both in March/April and August (referred to as “the panel”). Of the persons first contacted in April who were contacted again in August, 66% responded to the second wave. The remaining respondents from the April survey were removed from the analysis. Respondents were drawn from TNS Gallup's web panel, which is representative for the 93% of the adult population with Internet access (SSB 2011).
The two-fold strategy combining panel data and two independent, cross-sectional population surveys allow us to study both changes in the population as a whole and how individuals changed their attitudes and behavior in the aftermath of the act of terrorism.
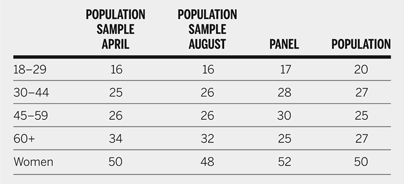
Respondents more than 60 years old were somewhat overrepresented in the two population samples, while respondents less than 30 years old were underrepresented (see table 1). The average age was 49 years in the first population sample and 48 years in the second sample, compared to 46 years in the target population. The results for the population samples have been weighted to correct for this slightly skewed distribution.Footnote 3
Age and Gender of Respondents Compared to Population. Percent

The surveys were carried out at the request of the Center for Civil Society and Voluntary Sector Studies. The research was funded by the Norwegian Research Council as part of the “Social Media and the Public Sphere” project.
TRUST
We first investigate the changes affecting interpersonal trust and institutional trust. Interpersonal trust is measured through two variables, a 10-point scale variable measuring generalized trust, and a variable measuring specific trust in 11 types of group characterized by degree of proximity or distance to the respondent. These variables had four values ranging from “do not trust at all” to “trust completely.” Institutional trust is measured on eight variables (on a five-point scale ranging from “no trust” to “very high trust”): trust in local authorities; trust in Parliament; trust in the courts; trust in government; trust in the police; trust in public administration; trust in business organizations; and trust in voluntary organizations.
Interpersonal Trust
The results show that Norwegians have not become less trusting after the terrorist attacks. On the contrary, when using the standard 10-point scale measuring generalized trust [“most people can be trusted” (10) versus “you can't be careful enough” (1)], the mean score in the independent population samples changed from 6.1 in March/April to 6.9 in August. This difference is a considerable amount over such a short period of time considering that generalized trust is a deep-seated value that is often formed in childhood or adolescence and remains relatively stable throughout the life course (Uslaner Reference Uslaner2002).
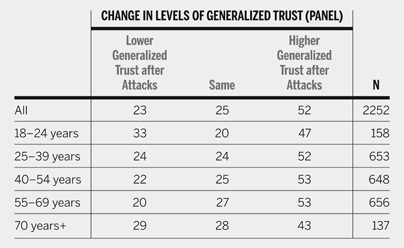
The panel data confirm these trends (table 2). In total, 52% express greater trust after the attacks than they did before the attacks, that is, they place themselves closer to the “most people can be trusted” option. Although 23% moved in the direction of distrust, 25% expressed the exact same levels of trust as before the attacks.
Change in Generalized Trust April-August, by Age. Panel, Percent

The terror attacks were specifically aimed at young people. It is well acknowledged that value structures among youths are more permeable than those of older generations. There were, therefore, good reasons to expect the events to have had the strongest effect on trust levels among youths. The results in the table confirm this expectation. A somewhat higher proportion of young people changed position on the trust scale after July 22 than older respondents. Although there is a net increase in trust even within this group, there is also a higher proportion of youths who have become more skeptical of other people.
Based on these results, there is some support for the end-of-innocence hypothesis, in particular among youth. One third of 18- to 24-year-olds express lower levels of interpersonal trust after the attacks. The main direction of the change, both in the general and youth population, however, is toward more interpersonal trust.
By moving from abstract questions about trust in “most people” to changes in trust toward specified groups, we may get a more precise picture of the implications of the changes in interpersonal trust.
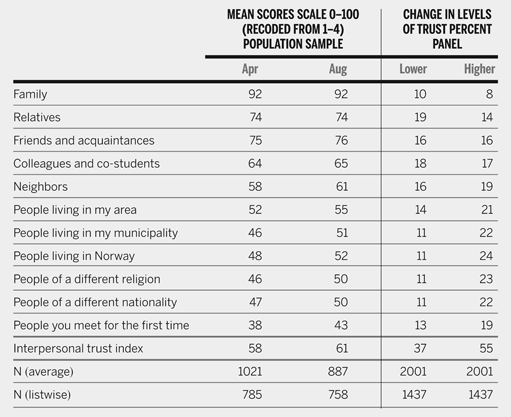
Previous research on interpersonal trust has found high absolute levels of trust in Norway in a comparative perspective for all types of groups (Wollebæk Reference Wollebæk, Wollebæk and Segaard2011). As is the case in most other countries, absolute levels of trust are highest in relation to family, relatives, and friends (table 3). Respondents are more cautious when it comes to reaching out more and generalized forms of trust, for example fellow Norwegians, people of another nationality or religion, or people they meet for the first time.
Change in Domain-Specific Trust. Population Sample and Panel

Note: Cronbach's alpha of interpersonal trust index is .88 in the April data and .90 in the August data. “Don't know”-responses excluded.
When looking at the immediate effects of the events of July 22, the majority (55%) of panel respondents report higher scores on a composite index of interpersonal trust, whereas 37% report lower scores. Particularized trust forms, that is, trust in people personally known to the respondent, remains at a high level, relatively unaffected by the events. The increase in trust is found among the more generalized forms of trust, such as in groups comprised of people who are less known to the respondent, if at all. Trust in other community residents, in fellow Norwegians, people of another religion, or strangers has increased significantly across the board after the attacks. This increase in trust reflects a more open and positive approach to the at least partially unknown and is indicative of a mobilization of trust rather than an expansion of fear.
Trust in Institutions
The Norwegian system has been characterized as “state friendly,” with strong ideological proximity between state and civil society (Kuhnle and Selle Reference Kuhnle, Selle, Kuhnle and Selle1992). To a greater extent than elsewhere in Europe outside Scandinavia, the state is seen as an extension of society rather than as a threat or an opponent. As a consequence, the relationship between interpersonal and institutional trust is stronger in the Nordic countries than elsewhere in Europe (Wollebæk Reference Wollebæk, Wollebæk and Segaard2011).
This strong correlation makes it more important that crises are handled in a unifying rather than a divisive manner: poor political leadership in the wake of the tragedy would have been particularly detrimental in Norway. However, there seems to be consensus across the political spectrum that the political leaders in Norway passed this test with honors. Political leaders, in general, and the prime minister, in particular, received praise from all political camps domestically and internationally for the way the atrocities were handled. In a pivotal statement shortly after the attacks, the prime minister called for “more democracy and openness” in response to terrorism.Footnote 4 Calls such as this helped to raise awareness that terror seeks to destroy trust, participation, and openness, and the political leaders spurred a national mobilization in defense of these values.
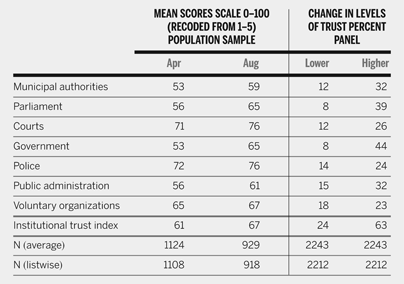
Echoing the findings of Putnam's analysis of post-September 11 in the United States (Reference Putnam2002), table 4 confirms that the increase in interpersonal trust was coupled with a parallel increase in trust in institutions. On a composite index, 63% of panel respondents report higher institutional trust in August than in April, whereas 24% trust institutions less. The increase in support is greatest when it comes to political leaders—the government and the Parliament. These positive sentiments are clearly related to competent leadership during the crisis. They also express sympathy because a political party was the specific target of the terror. The increased trust in political leaders is nonpartisan. For example, 39% of voters supporting the right-wing Progress Party report increased trust in the Labor Party-led government, whereas only 10% are less trusting (N = 231), compared to 44% and 8% in the population as a whole.
Change in Trust in Institutions. Population Sample and Panel

Note: Cronbach's alpha of institutional trust index is .85 in the April material and .87 in the August material.
There is also increased trust in the courts, municipal authorities, and the police, although the increase with regard to the police is less. The increased trust in the police is remarkable in light of the very high level of trust at the outset and the increasingly outspoken criticism of the actions of the police during the attacks. This result underlines the strength of the positive sentiments toward public institutions in the weeks after July 22.
The substantial increase in both interpersonal and institutional trust was related to a strengthened sense of community and common fate in the aftermath of July 22. As many as 79% of the respondents said that Norway was characterized by more “community and togetherness” after the attacks, while 1% supported the opposite view. This sentiment was most pronounced among young people. Among those aged between 18 and 24, 88% responded that there was more community and togetherness, among these, 38% felt it was “a lot more.” Although 49% of the population claimed that “conflicts between ethnic groups” was reduced, only 8% thought the conflict level had increased.
Taken together, the preceding findings provide strong support for the hypothesis that values such as trust and togetherness were strengthened rather than weakened in the aftermath of July 22. However, such sentiments directly after a dramatic event may be undermined in the long term if a culture of fear is installed in society and government. Next, we examine the extent to which fear is expressed in our survey.
A NEW CULTURE OF FEAR?
Trust entails, by definition, acting under a variable amount of uncertainty. It is therefore always linked to an element of risk assessment. The atrocities could introduce an element of insecurity and fear in everyday life and change the population's risk perception by elevating fears of new violent attacks. In turn, this could lead to changing political preferences for increased security and control. A more fearful culture implies a less trusting culture.
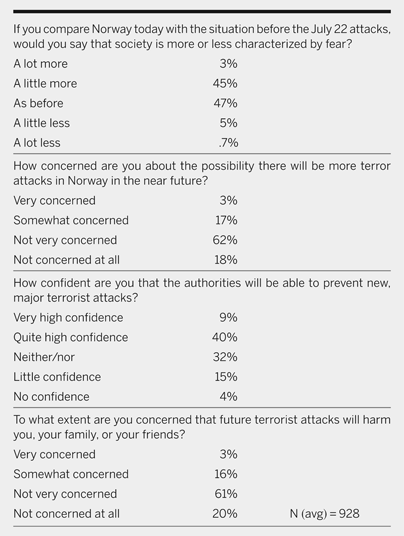
Table 5 shows that a substantial proportion of the population—45%—claims that Norwegian society is characterized by a little more fear after July 22. However, only 3% argue that there is “a lot more” fear and more than half say that it is about the same or less. When it comes to the possibility of future attacks, people are remarkably optimistic. Results show 17% are “somewhat concerned” about the possibility of new attacks in the near future, while only 2.5% are “very concerned.” The overwhelming majority—80%—are “not very concerned” or “not concerned at all.”
Fear of Terror. Population Sample, Percent

By comparison, 38% were “very concerned” and 40% “somewhat concerned” after the Oklahoma City bombing in 1995 (Lewis Reference Lewis2000), which in many respects is comparable to the Oslo bombing/Utøya massacre. The Norwegian respondents expressed a great deal of faith in the authorities' ability to prevent new attacks. Data show 49% had “some” and 9% “very high” trust that new attacks could be avoided, while only 19% had little or no trust. By way of comparison, the proportion of the American population with “a great deal” or “some” confidence in the government's ability to avert new attacks varied between 33% and 37% in different polls (Lewis Reference Lewis2000). As much as 45% of the American population responded to a Gallup poll that the authorities would not be able to prevent new terrorist attacks. One possible explanation for these low levels of fear and for the confidence in the government's ability to avert new attacks after Utøya can be found in the attitude taken by the Norwegian government in their media response to the attacks. In their response, the government issued a call to population for solidarity and serenity, and this call was quickly echoed both in traditional and social media.
In our Norwegian survey, personal worry about being a victim of a terrorist attack is at approximately the same level as the more abstract fear of terrorism. Some 19% are very or somewhat concerned. The corresponding rate after the Oklahoma City bombing was 25%—much lower than the abstract fear of terrorism (Lewis Reference Lewis2000). The higher concrete/abstract fear ratio in Norway could be because the atrocities were aimed directly and explicitly at children and youth. The fear and emotion connected with losing children and youth is particularly strong and probably evokes strong identification in the population. Nonetheless, this fear of terror victimization is not widespread—81% are not very concerned or not concerned at all.
In sum, there are weak indications that the Utøya attacks were a harbinger of a new culture of fear. Surveys indicate little concern about future terrorist attacks and a great deal of confidence in the government's ability to prevent new ones. Fear is much less widespread than was the case after the Oklahoma City bombings in 1995. This both reflects a higher level of both interpersonal and institutional trust at the outset and strengthens the possibility of maintaining high levels of trust in the longer run.
CIVIC ENGAGEMENT
The terror attacks were aimed at politically engaged youth and central political institutions and, therefore, were seen by many as an attack on the fundamental values of democracy. To what extent has increased support for openness and democracy spilled over into actual civic and political engagement?
In line with Putnam's (Reference Putnam2002) findings in the case of the United States after September 11, the shift is greater with regard to attitudes than in concrete behavior. With regard to organization memberships, 25% of panel respondents report higher group memberships after the attacks compared to four months before the attacks, while 31% report fewer memberships. In total, slightly more people have left than joined organizations. When it comes to political parties and other organizations with a political purpose, there was no change in the rate of respondents reporting membership in these despite numerous media reports of the citizenry joining parties in droves. The new members are real, but the numbers were far too small to register in a representative survey. The Labor Party, which was the main target of the attacks, received the highest number of new members. Five weeks after the attacks, they reported having received 6,200 new members—a high number in absolute terms, but only about 0.15% of the population.Footnote 5
When the respondents in the population sample were asked to compare their level of engagement in voluntary organizations after the attacks with their activity level six months prior to the attacks, 11% said they were more engaged; 11%, less; and 79% reported about the same level of engagement. On this question, however, young people stand out with increased engagement: 18% report higher levels of engagement compared to six months before, while 12% are less engaged.
The proportion of the population who does not identify with a political party decreased from 29% to 23% in the aftermath of the terror attacks. The more established parties, the Labor Party and the Conservative Party, increased their level of identification within the population, whereas the populist Progress Party has experienced a loss in identification.
Similarly, the intention to vote increased and citizens appeared to be more certain about their political choices. Only 2% answer that they would not vote after July 22 (compared to 5% before July 22). When asked the question “if national elections were held tomorrow, which party would you vote for?” 11% answered that they did not know (compared to 16% before July 22). As with party identification, the most established parties, such as Labor Party and Conservative Party, appeared to increase their share of intended votes the most. Young people, once again, stood out with a particularly strong intended turnout at the elections compared with other groups. The mobilization rate (percentage with a clear intent to vote in August who responded “don't know” or “would not vote” in April) was 14% for those aged 24 and younger, compared to 8% among older voters.Footnote 6
In the immediate period following the events, the terror attacks in Norway prompted increased civic and political engagement, at least in terms of attitudes and intentions. However, it is unclear whether intentions will translate into action, and whether such a mobilization will persist. Already there is some evidence that it will not. When actual elections were held on September 12, 2011, the turnout rate was 63.8%, a marginal increase from 61.7% in 2007. It should be noted, however, that these were local elections whereas our questions referred to the national level. In another set of questions in the survey, respondents profess increased interest in national politics (20% of panel respondents were more interested in August than in April, 11% less interested), but there was no change at all in interest in local issues.
Increased political engagement after September 11 lasted no longer than six months (Putnam Reference Putnam2002; Sander and Putnam Reference Sander and Putnam2010). However, a more lasting generational effect on the middle-class segment of those in their politically formative years in 2001 has been reported (Sander and Putnam Reference Sander and Putnam2010). The levels of political interest and engagement within this segment have remained high and stable since September 11. Whether an “Utøya generation,” which is more politically interested and engaged than younger and older cohorts, will emerge as a result of the terror attacks in Norway remains to be seen.
Whereas political mobilization grew across the political spectrum, there was evidence in the survey of some discord about the political impact of the events, depending on the political orientation of the respondents. Supporters of the right-wing and anti-immigrant Progress Party tended to be less convinced than others that conflicts between ethnic groups had been reduced (15% denied this, while 27% agreed). In the sample as a whole, 51% agreed that there were less intense interethnic conflicts. Of Progress Party voters, 48% also felt that it was now more difficult to state one's opinion publicly. In contrast, only 20% of the voters supporting the three parties in power during the crisis, the Labor Party, Socialist Left Party, and Center Party, claimed that it had become more difficult to state one's opinion. After the attacks, it became clear that the perpetrator had been an active member of the Progress Party for several years. Some commentators have also compared the anti-Islamist rhetoric of the party to the reasoning in the shooter's so-called manifest.Footnote 7 The link created between the Progress Party and the perpetrator may partly explain why this party's followers believe that the range of public opinion has become more restricted.
CONCLUSION
After September 11, Putnam (Reference Putnam2002) found substantial increase in trust and political interest, which was even more pronounced among young people. There were also modest gains in the proportion of citizens giving to religious charities, “working with neighbors,” donating blood, volunteering, or working on community projects, and having attended a public meeting. Little or no growth, however, in group memberships or club meeting participation was found. Thus, attitudes shifted more than behavior. As Sander and Putnam (Reference Sander and Putnam2010) noted eight years later, the attitudinal shift had spent itself within six months.
Our results, after July 22 in Norway, corroborate most of Putnam's (Reference Putnam2002) findings concerning short-term effects. Both interpersonal trust and trust in institutions have increased as a result of the terror. Political mobilization has grown, especially among young people. However, contrary to what happened in the aftermath of September 11, our results show little increase in experienced fear. It is difficult to assess the extent to which these short-term changes will last over time or be ephemeral as was the case after September 11. Clearly, after the initial shock phase, Norway will enter a phase of normalization with increased political polarization and sharpened public debates and conflicts.
Today, however, our findings do not support the end-of-innocence hypothesis. Norwegians have not become more fearful, more cynical in dealing with each other and with institutions, and have not withdrawn from public life. In the short term at least, the terrorist attacks that were intended to thwart recruitment to politics and to induce fear resulted in increased sense of community and feelings of shared fate and enhanced interpersonal and institutional trust. Contrary to the intended aims of the terrorist, the structures of trust and civic engagement did not collapse, and appear to have been reinforced by the common dramatic experience shared by the Norwegian people. Along with capable political leadership, we believe that the successful maintenance of trust and mobilization of civic engagement after the events of July 22 were a result of the strong fabric of a resilient civil society and by the networks of trust that they institutionalize.
The long-term effects of such a dramatic collective experience remain to be seen. History has shown that collective social experiences may have long-term effects on societal values, attitudes, and practices. Ever since Karl Mannheim's (Reference Mannheim and Kecskemeti1980 [1928]) seminal essay “Das Problem der Generationen,” social science has regarded differences between generations as an important means of understanding changes in society. A common assumption has been that epochal watersheds influence the values of younger adults to a greater extent than older generations. For example, it has been argued that participation in the civil rights movements and protests against the war in Vietnam led to enduring changes in trust levels in the United States among those actively involved (Uslaner Reference Uslaner2002). Sander and Putnam's study of political engagement 10 years after September 11 is also indicative of generational effects of major events. This may well be the case 10 years after Utøya as well.