Introduction
Montmorillonite is prevalent in nature with a high cation adsorption capacity (CEC) (Sawhney Reference Sawhney1972; Cornell Reference Cornell1993), and plays a significant role in controlling the fate and availability of soil contaminants and plant nutrients (Schulthess and Huang Reference Schulthess and Huang1990; Bradbury and Baeyens Reference Bradbury and Baeyens1997; Nolin Reference Nolin1997; Tertre et al. Reference Tertre, Beaucaire, Coreau and Juery2009; Siroux et al. Reference Siroux, Beaucaire, Tabarant, Benedetti and Reiller2017; Martin et al. Reference Martin, Wissocq, Benedetti and Latrille2018; Ohkubo et al. Reference Ohkubo, Okamoto, Kawamura, Guégan, Deguchi, Ohki, Shimizu, Tachi and Iwadate2018). Montmorillonite is a 2:1 phyllosilicate, with two Si tetrahedral sheets sandwiching one Al octahedral sheet. In montmorillonite, isomorphic substitution occurs mostly in the octahedral sheet, where Al3+ cations are substituted by Fe3+ or Mg2+ cations (Yariv Reference Yariv1992; Sposito Reference Sposito2008). The isomorphic substitution in montmorillonite results in an excess negative charge, which requires interlayer counter cations to maintain the charge balance.
Studying the properties of adsorption sites in montmorillonite is essential for understanding its adsorption mechanisms. Based on the physical structure of montmorillonite, three types of adsorption sites are normally considered: basal surface, interlayer, and edge sites (Sawhney Reference Sawhney1972; Cornell Reference Cornell1993). The interlayer sites account for the majority of adsorption capacity on montmorillonite (Schulthess and Huang Reference Schulthess and Huang1990; Tournassat et al. Reference Tournassat, Neaman, Villiéras, Bosbach and Charlet2003; Macht et al. Reference Macht, Eusterhues, Pronk and Totsche2011). The cations can be adsorbed strongly on interlayer sites because of the Nanopore Inner-Sphere Enhancement effect (NISE; Ferreira et al. Reference Ferreira, Schulthess and Giotto2011; Schulthess et al. Reference Schulthess, Taylor and Ferreira2011), which states that a cation with low hydration energy can be partially or fully dehydrated inside a nanopore when the size of the nanopore is smaller than the hydrated ionic diameter. Montmorillonite is expansive, and its interlayer space ranges from 0 to 1 nm depending on the water content and interlayer cations present, which is in the same size range as most dehydrated and hydrated cations (Norrish Reference Norrish1954). Molecular simulations showed that Na+ with higher hydration energy tends to be hydrated in the interlayer space, and K+ and Cs+ with lower hydration energy tend to be dehydrated and be strongly adsorbed on the clay interlayer surface (Teppen and Miller Reference Teppen and Miller2006; Rotenberg et al. Reference Rotenberg, Morel, Marry, Turq and Morel-Desrosiers2009).
The number and type of adsorption sites have been identified by ion-exchange modeling on: illite (Poinssot et al. Reference Poinssot, Baeyens and Bradbury1999), smectites (Siroux et al. Reference Siroux, Beaucaire, Tabarant, Benedetti and Reiller2017; Martin et al. Reference Martin, Wissocq, Benedetti and Latrille2018), beidellites (Robin et al. Reference Robin, Tertre, Beaufort, Regnault, Sardini and Descostes2015, Reference Robin, Tertre, Beaucaire, Regnault and Descostes2017), argillite and clayey sediments (Motellier et al. Reference Motellier, Ly, Gorgeon, Charles, Hainos, Meier and Page2003; Jacquier et al. Reference Jacquier, Ly and Beaucaire2004; Tertre et al. Reference Tertre, Beaucaire, Coreau and Juery2009). The H+ cation is present in all these ion-exchange models as a competing cation. The aqueous H+ cation has fast mobility (Agmon Reference Agmon1999) and exists in all water solutions, and is thus an inevitable competitor in ion-exchange reactions. Accordingly, ion-exchange models must include H+ as competitive cations (Poinssot et al. Reference Poinssot, Baeyens and Bradbury1999; Motellier et al. Reference Motellier, Ly, Gorgeon, Charles, Hainos, Meier and Page2003; Jacquier et al. Reference Jacquier, Ly and Beaucaire2004; Tertre et al. Reference Tertre, Beaucaire, Coreau and Juery2009; Robin et al. Reference Robin, Tertre, Beaufort, Regnault, Sardini and Descostes2015, Reference Robin, Tertre, Beaucaire, Regnault and Descostes2017; Siroux et al. Reference Siroux, Beaucaire, Tabarant, Benedetti and Reiller2017; Martin et al. Reference Martin, Wissocq, Benedetti and Latrille2018). Fourier-transform infrared (FTIR) spectroscopy and DFT simulations also showed that hydronium cations are likely to be intercalated in the interlayer space of hydrated illite and exchange with K+ cations (Escamilla-Roa et al. Reference Escamilla-Roa, Nieto and Sainz-Díaz2016). Therefore, the adsorption of counter cations on montmorillonite is evaluated normally with ion adsorption envelopes using the H+ cation as a competing reference (Schulthess and Huang Reference Schulthess and Huang1990; Nolin Reference Nolin1997; Bradbury and Baeyens Reference Bradbury and Baeyens1997; Tertre et al. Reference Tertre, Beaucaire, Coreau and Juery2009; Siroux et al. Reference Siroux, Beaucaire, Tabarant, Benedetti and Reiller2017). The cations adsorbed at low pH have strong adsorption strength, while cations adsorbed at higher pH have weaker adsorption strength. The saturation of each type of adsorption site is extrapolated from the various plateaus in the cation adsorption envelope curves.
Accordingly, in a study of heavy-metal adsorption on Wyoming SWy-1 montmorillonite, Schulthess and Huang (Reference Schulthess and Huang1990) grouped the adsorption sites into three types, involving two edge sites (Si-related sites and Al-related sites) and one strong interlayer site, based on three plateaus observed in their adsorption envelope curve. Similarly, three types of adsorption sites were proposed for Na+ adsorption on a Wyoming SWy-1 montmorillonite by Nolin (Reference Nolin1997), which was based on observance of three plateaus in their Na+ adsorption envelope curve. Other studies involving adsorption isotherm and adsorption envelope modeling of very low cation concentrations have proposed that a fourth site with high cation adsorption affinity but low capacity (<1% of CEC) might exist on montmorillonite (Bradbury and Baeyens Reference Bradbury and Baeyens1997; Tertre et al. Reference Tertre, Beaucaire, Coreau and Juery2009; Martin et al. Reference Martin, Wissocq, Benedetti and Latrille2018). Thus, three major sites account for the majority of the CEC on montmorillonite (Schulthess and Huang Reference Schulthess and Huang1990; Bradbury and Baeyens Reference Bradbury and Baeyens1997; Nolin Reference Nolin1997; Tertre et al. Reference Tertre, Beaucaire, Coreau and Juery2009; Siroux et al. Reference Siroux, Beaucaire, Tabarant, Benedetti and Reiller2017; Martin et al. Reference Martin, Wissocq, Benedetti and Latrille2018). Although the nature and location of the proposed three major adsorption sites on montmorillonite still remains speculative, the general opinion is that each site corresponds to a unique surface metal (e.g. aluminol or silanol sites) (Schulthess and Huang Reference Schulthess and Huang1990) and/or structural location (e.g. edge or interlayer sites) (Bradbury and Baeyens Reference Bradbury and Baeyens1997; Martin et al. Reference Martin, Wissocq, Benedetti and Latrille2018).
Cation adsorption in the interlayer space is influenced by the charge distribution in the clay. A Grand Canonical Monte Carlo simulation showed that adsorbed Na+ cations tend to be located in the vicinity of isomorphic substitutions on clay minerals, where the negative charge is more concentrated (Chatterjee et al. Reference Chatterjee, Iwasaki, Ebina and Miyamoto1999). A DFT simulation showed that alkali cations tend to be adsorbed on interlayer sites that are near the tetrahedral Al/Si substitution on dry montmorillonite (Shi et al. Reference Shi, Liu, Lou, Zhang, Meng, Zeng and Yang2013). The negative charge distribution, geometry, and surface properties in the vicinity of isomorphic substitutions in clay minerals are influenced by their local environments, such as tetrahedral or octahedral cation distribution and species of neighboring cations (Yariv Reference Yariv1992; Lavikainen et al. Reference Lavikainen, Tanskanen, Schatz, Kasa and Pakkanen2015; Ohkubo et al. Reference Ohkubo, Okamoto, Kawamura, Guégan, Deguchi, Ohki, Shimizu, Tachi and Iwadate2018).
Various studies have shown that octahedral cation distribution is very diverse due to the different cation species present, the amount of different cations present, and the spatial distribution of these cations (Muller et al. Reference Muller, Besson, Manceau and Drits1997; Sainz-Diaz et al. Reference Sainz-Diaz, Hernández-Laguna and Dove2001; Vantelon et al. Reference Vantelon, Montarges-Pelletier, Michot, Pelletier, Thomas and Briois2003; Finck et al. Reference Finck, Schlegel and Bauer2015). The analysis of powder diffraction, extended X-ray absorption fine structure (EXAFS) spectroscopy, and vibration infrared (IR) spectroscopy in combination with the chemical composition showed that multiple types of octahedral Al, Mg, Fe cation distribution exist in montmorillonite from Camp-Bertaux, and Fe and Mg tend to segregate in small clusters (Muller et al. Reference Muller, Besson, Manceau and Drits1997). After analyzing 20 illite-smectite interstratified clay samples using FTIR, Al magic angle spinning nuclear magnetic resonance (MAS-NMR) spectroscopy, and Monte Carlo simulations, an increase in illite content showed an increase in octahedral Fe segregation, as well as an increase in the dispersal of octahedral Mg (Cuadros et al. Reference Cuadros, Sainz-Diaz, Ramirez and Hernandez-Laguna1999). Using IR and EXAFS spectroscopy, Vantelon et al. (Reference Vantelon, Montarges-Pelletier, Michot, Pelletier, Thomas and Briois2003) grouped montmorillonite clays into three types according to the number of Fe-Fe pairs in the octahedral sheet: (1) samples from Wyoming (0.45–0.47 Fe per formula unit) showed an ordered distribution of Fe cations, (2) samples from China, Georgia, Milos, and Washington (0.1–2.7 Fe per formula unit) presented a nearly random distribution of Fe cations, and (3) samples from Texas, Bavaria, North Africa, and Arizona (0.14–0.57 Fe per formula unit) exhibited a strong tendency for Fe clustering. A polarized EXAFS study on the structural Fe in Wyoming montmorillonite showed a random distribution of the octahedral Fe (Finck et al. Reference Finck, Schlegel and Bauer2015). Also, montmorillonites from different sources but with similar chemical composition can have very different octahedral cation distributions (Tsipursky and Drits Reference Tsipursky and Drits1984; Drits et al. Reference Drits, McCarty and Zviagina2006).
Montmorillonite is a dioctahedral clay mineral with a vacancy in every third octahedron. Based on the position of the octahedral hydroxyls, both cis-vacant (cv) and trans-vacant (tv) configurations occur in the clay minerals (Drits et al. Reference Drits, McCarty and Zviagina2006). The cv has two octahedral hydroxyls located on the same side of a vacancy. The tv has two octahedral hydroxyls located on opposite sides of a vacancy. Using oblique-texture electron diffraction analysis, a wide percentage of cv and tv structures has been found in 30 dioctahedral smectites of different composition and genesis (Tsipursky and Drits Reference Tsipursky and Drits1984). After reviewing 26 dioctahedral 2:1 phyllosilicates, Drits et al. (Reference Drits, McCarty and Zviagina2006) summarized three types of smectites: (1) cv, (2) tv, or (3) interstratified layers with cv or tv sheets. The structural iron content in smectites was suggested to be the main factor governing the formation of cv and tv layers, with high-iron content (>0.6 Fe per formula unit) resulting in dominant tv structures, while low-iron content (<0.6 Fe per formula unit) were forming cv structures (Wolters et al. Reference Wolters, Lagaly, Kahr, Nueeshch and Emmerich2009; Neumann et al. Reference Neumann, Petit and Hofstetter2011).
The formation of each type of structure is influenced by the layer composition and the local ordered-disordered distribution of octahedral cations (Drits et al. Reference Drits, McCarty and Zviagina2006; Wolters et al. Reference Wolters, Lagaly, Kahr, Nueeshch and Emmerich2009). The local structure, in turn, will influence the geometry of the clay structure and electronic distribution (Yariv Reference Yariv1992; Chatterjee et al. Reference Chatterjee, Iwasaki, Ebina and Miyamoto1999; Sainz-Diaz et al. Reference Sainz-Diaz, Hernández-Laguna and Dove2001; Hernández-Haro et al. Reference Hernández-Haro, Ortega-Castro, Pruneda, Sainz-Díaz and Hernández-Laguna2014). After an extensive literature review, Benson (Reference Benson1982) tabulated ion-exchange data of clay minerals, and suggested that the variations in crystal chemistry (e.g. chemical composition and structural cation distribution) in smectites were the main factor causing the variability of ion-exchange data.
The octahedral cation distribution, cv/tv structure, and cation adsorption sites are difficult to identify due to the small crystal size of clay minerals (Sainz-Diaz et al. Reference Sainz-Diaz, Hernández-Laguna and Dove2001; Ortega-Castro et al. Reference Ortega-Castro, Hernández-Haro, Dove, HernándezLaguna and Sainz-Díaz2010), variable cation distributions in the clay structure (Cuadros et al. Reference Cuadros, Sainz-Diaz, Ramirez and Hernandez-Laguna1999; Lavikainen et al. Reference Lavikainen, Tanskanen, Schatz, Kasa and Pakkanen2015), and clay layer stacking (Drits et al. Reference Drits, McCarty and Zviagina2006; Ortega-Castro et al. Reference Ortega-Castro, Hernández-Haro, Dove, HernándezLaguna and Sainz-Díaz2010; Finck et al. Reference Finck, Schlegel and Bauer2015). First-principles DFT simulations have been a potent tool in the calculations of the stable geometry of clay minerals and cation adsorption properties. For example, Ortega-Castro et al. (Reference Ortega-Castro, Hernández-Haro, Dove, HernándezLaguna and Sainz-Díaz2010) simulated the crystallographic properties of dioctahedral 2:1 phyllosilicate using DFT calculations, and demonstrated that tetrahedral Al3+ ions are highly dispersed and the interlayer cations are likely to be in the same ditrigonal cavity as the tetrahedral Al3+ substitution, where the negative charge is more concentrated. Kaufhold et al. (Reference Kaufhold, Kremleva, Krüger, Rösch, Emmerich and Dohrmann2017) investigated the correlations between iron content, fraction of tetrahedral charge, and ratio of tv to cv structures on dioctahedral smectites using DFT simulations, and found that the energy difference of the clay lattice with different chemical compositions were comparably small, which may result in structural variations of natural clay minerals.
Understanding the influence of the octahedral cation distribution on the clay’s cation adsorption strength should help to identify the nature and properties of adsorption sites in clay minerals. The physical and chemical properties in the vicinity of isomorphic substitution should affect the clay’s cation adsorption strength. The aim of the present study was to investigate the impact of various octahedral cation distributions on the retention strength of counter cations on montmorillonite using DFT simulations, where H+ was chosen as the competing reference cation in the simulations.
Materials and Methods
A dry H-montmorillonite structure of (H0.5)[Al3Mg0.5Fe0.5]Si8O20(OH)4 was used, which is similar to the hydrogen form of natural SWy-1 (SWy-2 or SWy-3) montmorillonite: (Ca0.12Na0.32K0.05)[Al3.01Fe0.41Mn0.01Mg0.54Ti0.02] Si7.98Al0.02O20(OH)4 (The Clay Minerals Society 2019). Octahedral Fe distribution in SWy-1 (SWy-2 or SWy-3) montmorillonite is believed to be ordered (Vantelon et al. Reference Vantelon, Montarges-Pelletier, Michot, Pelletier, Thomas and Briois2003; Finck et al. Reference Finck, Schlegel and Bauer2015). Accordingly, several ordered configurations of octahedral cation distributions were investigated. The proposed unit formula was H[Al6MgFe]Si16O40(OH)8, where two octahedral Al cations are substituted by Fe and Mg cations.
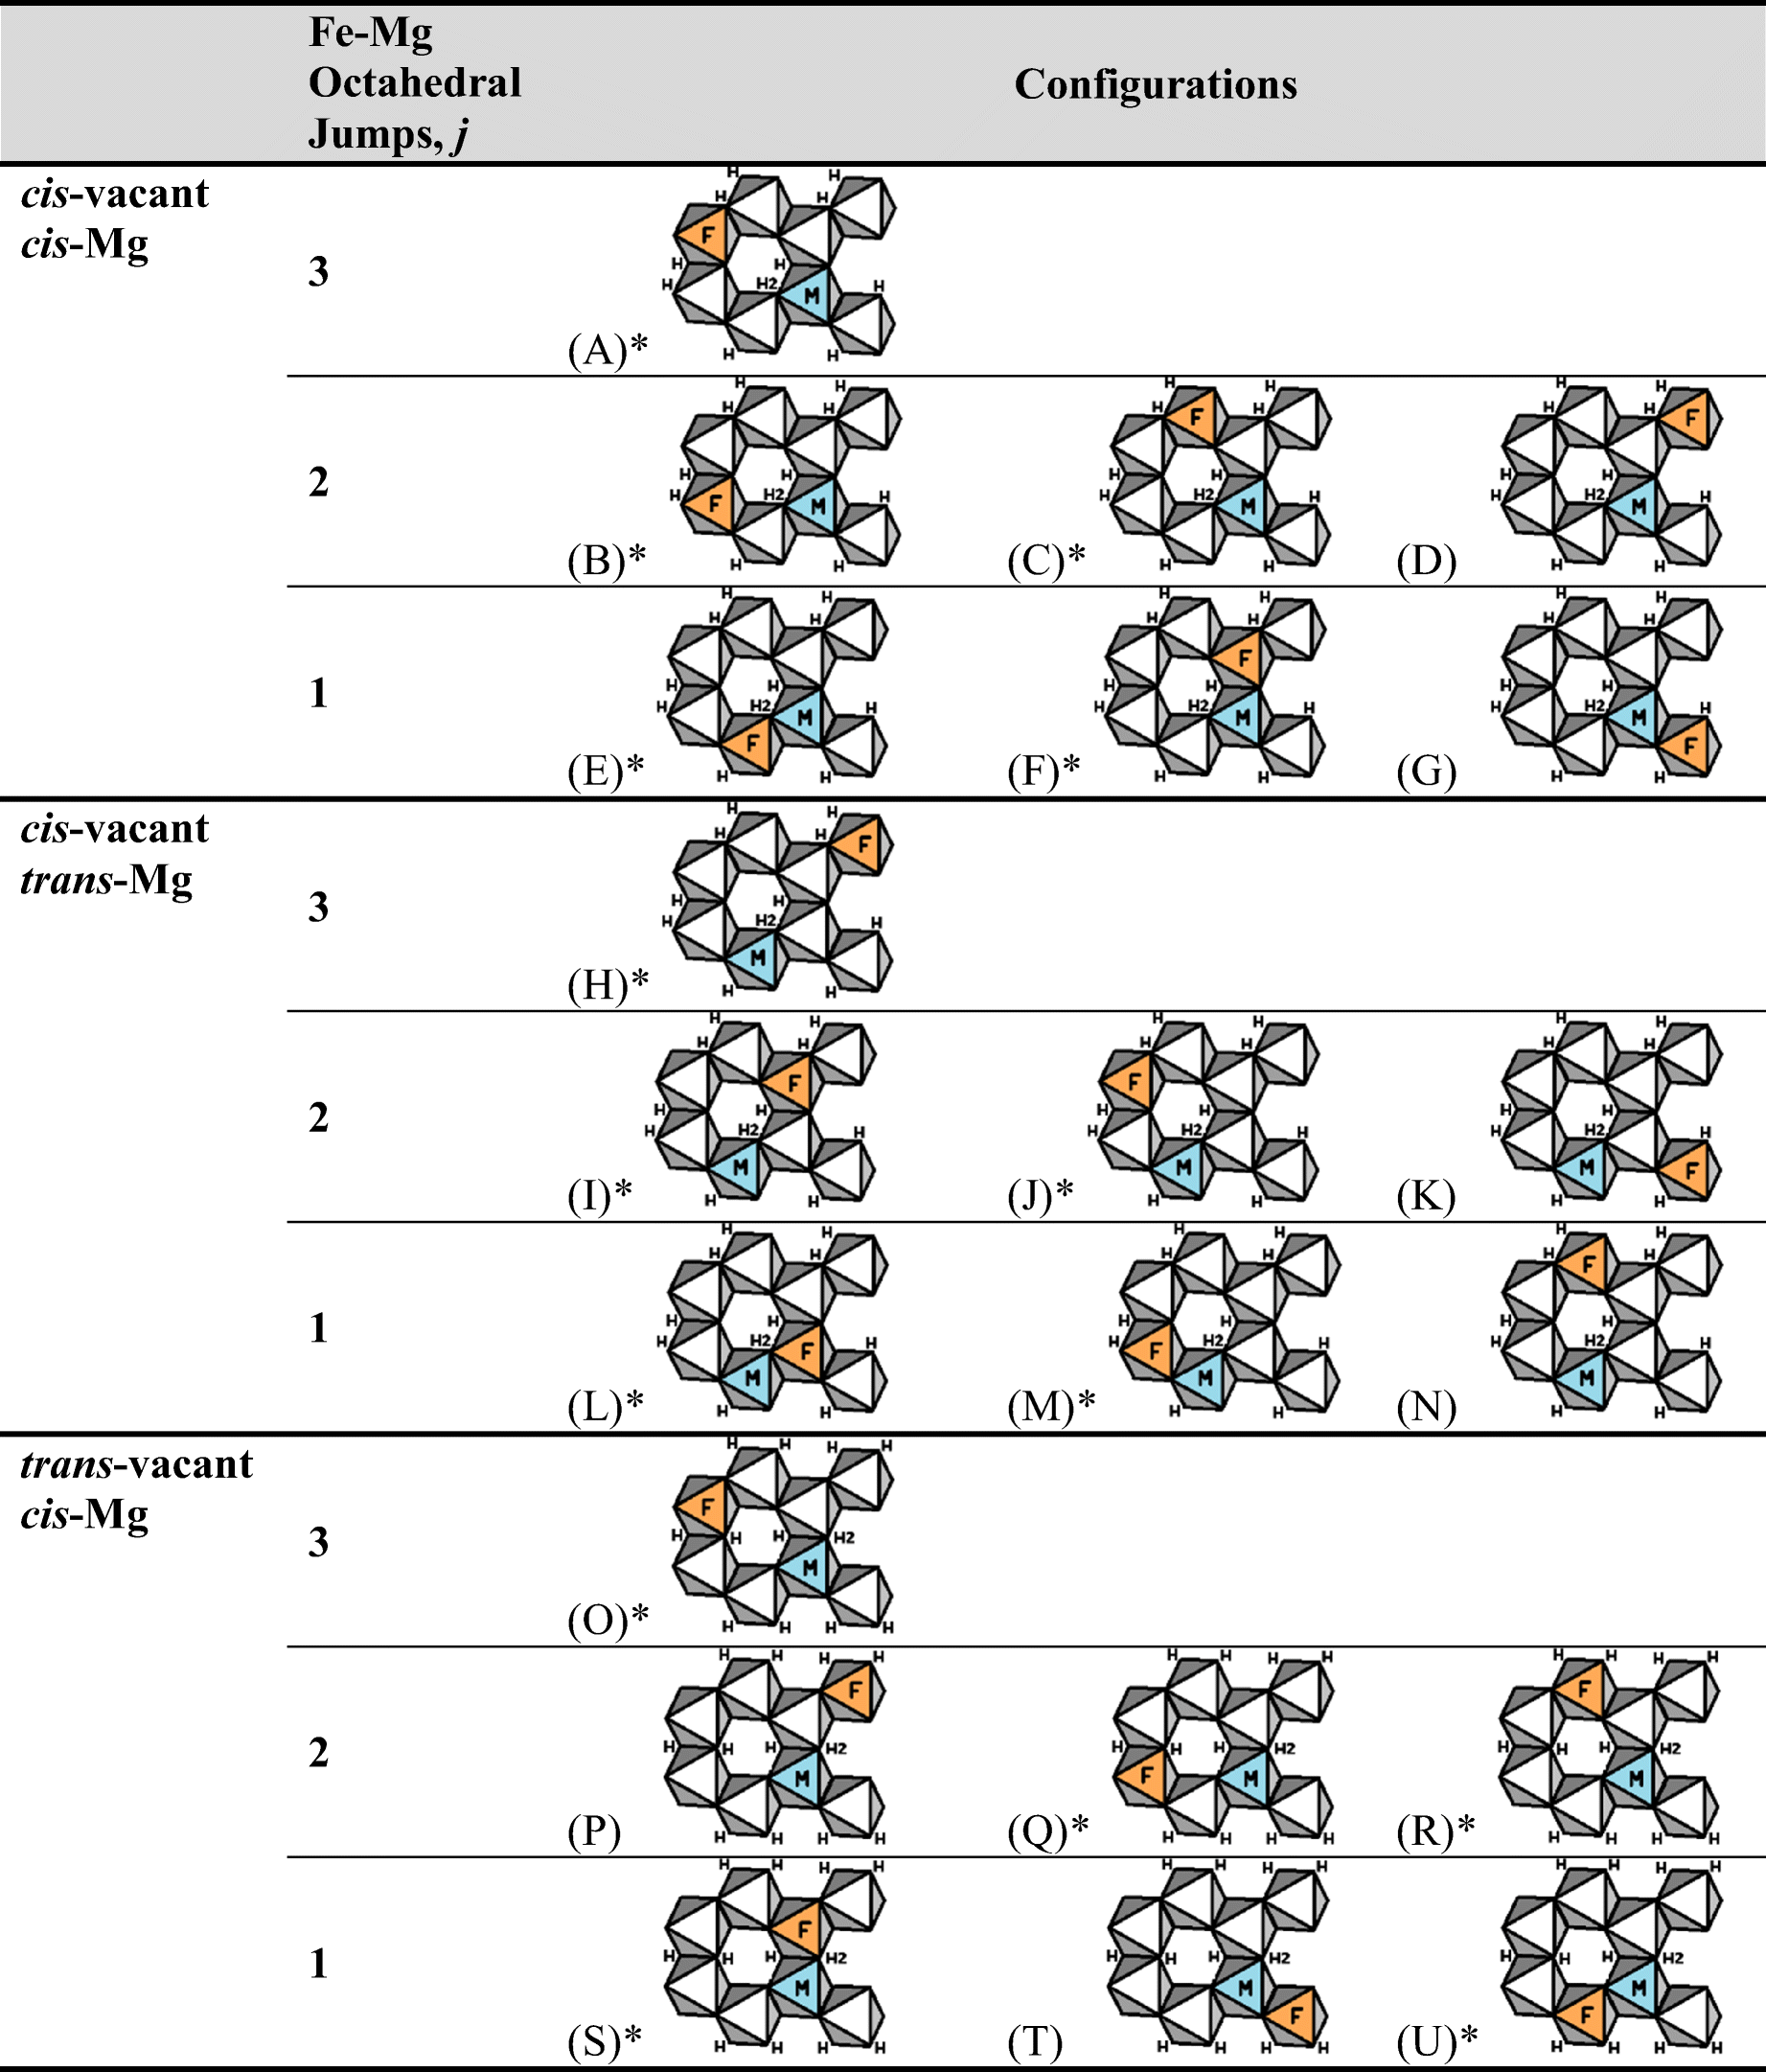
The cv and tv structures and the relative position of octahedral Fe to Mg yielded a total of 21 different possible configurations (Table 1). For the cv structures, the octahedral OHs can be placed on the same side or on the opposite side of the octahedral Mg cation, which correspond to cis-Mg or trans-Mg structures, respectively. For tv structures, the OHs can be placed only at the same side of the octahedral Mg cation, and form only cis-Mg structures. Accordingly, there are a total of three groups of structures: cis-vacant cis-Mg, cis-vacant trans-Mg, and trans-vacant cis-Mg. For each group of structures, Fe can be placed next to Mg (noted by j = 1), or further away (noted by j = 2 or 3), where j refers to the number of octahedral jumps from Fe to Mg. Using the Mg octahedron as the reference, Fe can be placed in one of three ways at j = 1 and 2, but only one way for a separation of j = 3. Enantiomers also exist for each of these, but their electronic properties and structural energies should be identical to their mirror images.
The 21 different octahedral configurations in montmorillonite. F: octahedral Fe; M: octahedral Mg; cis-Mg: octahedral OHs are on the same Mg-octahedral edge; trans-Mg: octahedral OHs are on the opposite points of the Mg-octahedra; H2: indicates the location of the hydrogen counter cation. Asterisks (*) denote structures used in the DFT simulations
 |
Initial geometries were taken from models proposed by Viani et al. (Reference Viani, Gualtieri and Artioli2002). The structure is orthorhombic with lattice constants a = 10.36 Å, b = 8.97 Å, c = 9.5 Å, and with a 2.86 Å interlayer space. The initial location of the charge compensating H+ was put in the ditrigonal cavities. Lattice vectors and the atomic positions of the doped models were thoroughly optimized to eliminate residual interatomic forces.
Computational Methods
For all configurations, the extra H+ was always bound to the oxygen atom of Mg-OH. The models that span the three possible Fe-Mg distances were selected because the Mg-Fe distance was expected to represent the most significant difference among all configurations. Two permutations per row for rows with j = 1 or 2 were selected from a symmetry point of view, as noted by asterisks in Table 1. The down selection of fifteen configurations was expected to be sufficient to represent the possible separation distances.
Crystal models were generated by substituting Mg and Fe for Al in the octahedral sheet of pure pyrophyllite. The Mg substitution caused a charged defect, and the added H+ cation was found to bind to Mg-OH, resulting in the H+ bond resting normal to the ditrigonal cavity (Sposito Reference Sposito2008).
Super cell calculations were performed using the spin-polarized density functional theory within the generalized gradient approximation (GGA) where the Perdew-Burke-Ernzerhof (PBE) parametrization was used (Perdew et al. Reference Perdew, Burke and Ernzerhof1996). The core and valence electrons were treated with the projector augmented wave method (Blöchl Reference Blöchl1994) and the kinetic energy cutoff for the plane waves was set to 500 eV. The supercell for the basic model without adsorbed H+ consisted of 80 atoms. The energy cut-off for the plane wave basis set was chosen as 500 eV, which was 25% larger than the highest value of cut-off energy in the pseudopotentials of the atomic species. The integrations in the Brillouin zone were performed in a discretized Monkhorst-Pack k-points mesh of 5×5×5. Consideration of crystal symmetry reduced the number of independent k-points to 63 (Monkhorst and Pack Reference Monkhorst and Pack1976). Geometrical optimization for the models was carried out using the conjugate gradient method where the tolerance for total energy convergence was set to 10-6 eV. This amount of energy tolerance ensured a force tolerance of 0.001 eV/Å. The Vienna ab initio simulation package (VASP) was used for all computations using the plane wave basis sets (Kresse and Furthmüller Reference Kresse and Furthmüller1996; Kresse and Joubert Reference Kresse and Joubert1999; Gajdoš et al. Reference Gajdoš, Hummer, Kresse, Furthmüller and Bechstedt2006).
H+ Adsorption Energy Analysis
The H+ adsorption energy (HAE) was calculated as follows:

where E w/H is the total energy of the system with H+ cation adsorbed for charge compensation, E w/o H is the total energy of the same structure without the H+, and μH is the chemical potential of the H+ cation. The μH was calculated based on two different types of H+: the H+ in the H2O molecule (H-poor), and H+ in its pure atmospheric form (H-rich). The μH in the H-poor condition was calculated with equation (2), and the μH in the H-rich condition was calculated with DFT simulations via equation (3):


where
 ,
 , and
 are the total potential energy of H2O, O2, and H2 molecules, respectively. The values of
 (–15.58 eV) and
 (–9.85 eV) were obtained from the database Materials Project https://materialsproject.org/, and were kept fixed to calculate the HAE for all cases. The value of
 (–6.69 eV) was calculated from the optimized total energy of the H2 molecule. Statistical analysis of variance of the geometrical parameters, total potential energies, and HAE values were performed using RStudio software (Version 1.2.5019; RStudio 2019).
Results and Discussion
Optimized Geometry and Total Potential Energy of Different Configurations
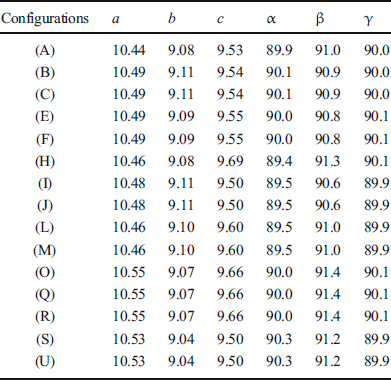
Atomic and bond details of the resultant 15 montmorillonite structural models from this DFT study are shown in the Supplementary Materials section. Configuration A with alternate locations for Fe atoms is shown as an example of an optimized structure in Fig. 1. Slight variations were noted in the clay structures with different octahedral cation distributions (Table 2). The a dimension of cv configurations (10.47 ± 0.02 Å) were smaller (p < 0.001) than the tv ones (10.54 ± 0.01 Å). The b dimension of cv configurations (9.10 ± 0.01 Å) were larger (p < 0.001) than the tv ones (9.06 ± 0.02 Å), but the c dimension (9.57 ± 0.06 Å) was not significantly different for all configurations. The α angles of cis-Mg configurations (90.08 ± 0.14ο) were larger (p < 0.001) than the trans-Mg ones (89.49 ± 0.05ο). The β (91.01 ± 0.26ο) and γ (89.98 ± 0.10ο) angles showed no significant differences among the configurations. The slight variations observed were due to the different ionic radii of the octahedral cations in each clay structure: Al3+ (0.61 Å), Mg2+ (0.80 Å,) and Fe3+ (0.73 Å). Similar results were also obtained in DFT simulations of smectites where the a, c, and β parameters of cv structures were smaller than tv ones (Sainz-Diaz et al. Reference Sainz-Diaz, Hernández-Laguna and Dove2001).
A [001] (A) and [100] (B) projection of cis-vacant cis-Mg montmorillonite supercell model with the top plane of silica removed for clarity for the [001] projection. The positions of Mg and H+ are kept fixed in all models; Fe replaces Al in the octahedral sheet and is indexed by the number of octahedral jumps (j) separating Fe from Mg. The digits (1 to 3, 1* and 2*) indicate the several octahedral jumps of Fe positioned with respect to the Mg within the clay structure.

The optimized main lattice parameters (length in Ångstroms and angles in degrees)

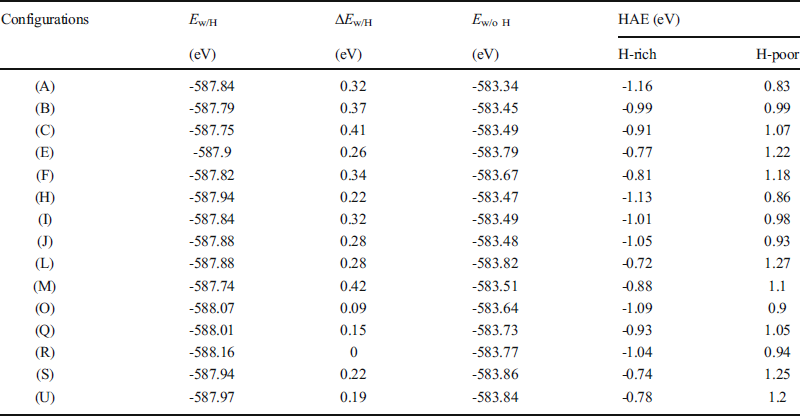
These structural and elemental variations resulted in internal energy stresses expressed by the total potential energy of the clay (Table 3). The average of all the total potential energies of the structures with and without charge-compensating H+ were –587.90 eV and –583.62 eV, respectively. The changes of total potential energy were within 0.42 eV and 0.52 eV for configurations with (E w/H) and without (E w/o H) charge-compensating H+. These values were within 0.07% and 0.09% of the average total potential energy of structures with and without charge-compensating H+, respectively. These energy differences of different configurations were very small considering the size of the supercell structure studied (80 or 81 atoms). These small energy differences came from the interactions among Al3+, Mg2+, and Fe3+ cations as first, second, and third neighbors in the octahedral sheet. Small energy differences of simulated clay structures with different dioctahedral cation distributions were also observed in other DFT studies (Sainz-Diaz et al. Reference Sainz-Diaz, Hernández-Laguna and Dove2001; Hernández-Laguna et al. Reference Hernández-Laguna, Escamilla-Roa, Timón, Dove and Sainz-Díaz2006; Tunega et al. Reference Tunega, Goodman, Haberhauer, Reichenauer, Gerzabek and Lischka2007; Ortega-Castro et al. Reference Ortega-Castro, Hernández-Haro, Dove, HernándezLaguna and Sainz-Díaz2010; Hernández-Haro et al. Reference Hernández-Haro, Ortega-Castro, Pruneda, Sainz-Díaz and Hernández-Laguna2014; Ohkubo et al. Reference Ohkubo, Okamoto, Kawamura, Guégan, Deguchi, Ohki, Shimizu, Tachi and Iwadate2018).
The optimized total potential energy of configurations with (E w/H) and without (E w/o H) the charge-compensating H+. The relative total potential energy (∆E w/H) of configurations with H+ cations was calculated by using the minimum energy of configuration R as 0 eV. The HAE indicate the H+ adsorption energy in H-rich or H-poor environments for each configuration. Configurations correspond to those shown in Table 1.

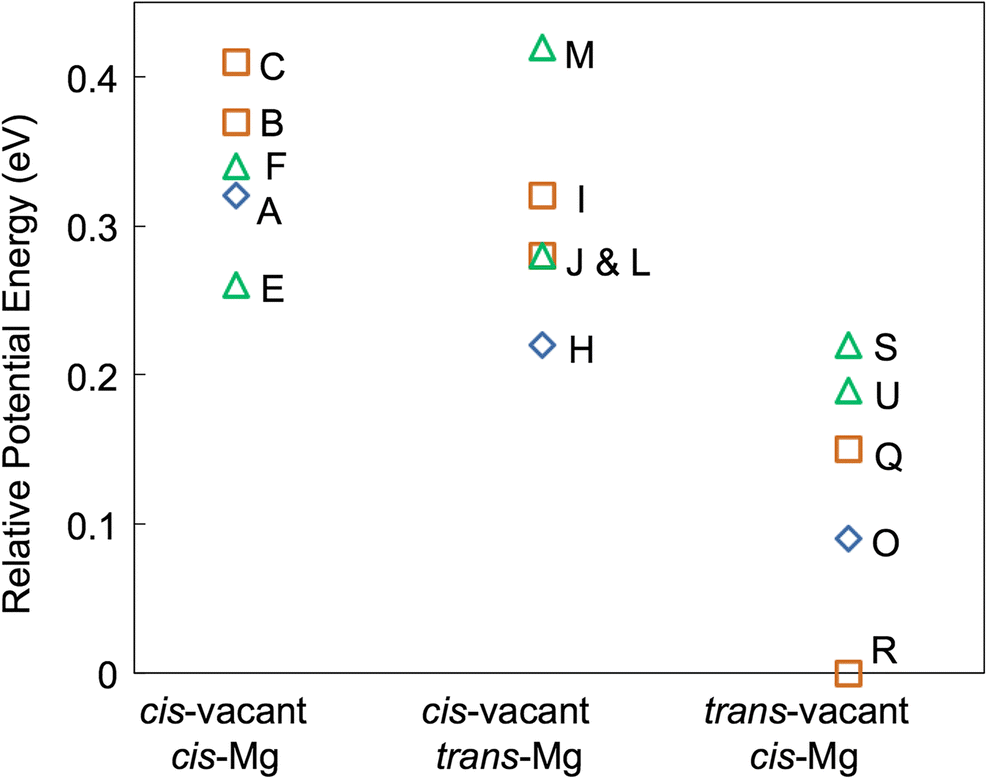
The relative energy was obtained by setting the minimum energy of structure R as 0 eV. The average of the relative energy change (ΔE w/H) of cis-vacant cis-Mg structures (0.34 ± 0.05 eV) revealed no significant difference from the cis-vacant trans-Mg structures (0.30 ± 0.07 eV), but both were significantly larger (p < 0.001) than the trans-vacant cis-Mg structures (0.13 ± 0.08 eV) (Fig. 2). Therefore, the tv configurations were more stable than the cv ones, and the relative position of octahedral hydroxyls (cis-Mg vs trans-Mg) did not influence the stability of the structures. Using DFT simulations, Tunega et al. (Reference Tunega, Goodman, Haberhauer, Reichenauer, Gerzabek and Lischka2007) also showed that the tv structures were more stable than the cv structures when isomorphic substitution occurred in the octahedral sheet.
The optimized total relative potential energy ΔE w/H with the charge-compensating H+ for each configuration. Configurations correspond to those shown in Table 1. The ▲, ■, and ♦ symbols represent configurations with octahedral jumps from Fe to Mg as 1, 2, and 3, respectively.

Additionally, these small energy differences suggest that cv and tv structures can be transformed from one to the other, which is substantiated in the literature. Dehydroxylation-rehydroxylation reactions of two dioctahedral micas (celadonite and glauconite) resulted in the transformation of the tv structure into the cv structure (Muller et al. Reference Muller, Drits, Plançon and Robert2000). Similarly, a cv montmorillonite was transformed into a tv structure by dehydroxylation at high temperature (510–630°C) and subsequent rehydroxylation under steam between 1.5 and 8.0 MPa (Emmerich and Kahr Reference Emmerich and Kahr2001). Using hydrothermal treatments, the proportion of cv and tv layers in synthesized low-charge beidellites can be modified by controlling the synthesis pressure, temperature, and starting materials (Lantenois et al. Reference Lantenois, Muller, Bény, Mahiaoui and Champallier2008). This also suggests that the probability of occurrence of natural smectites with similar composition and structure should be nearly equal.
The octahedral Fe-Mg distance did not significantly influence the stability of the various configurations, where the relative total potential energies were 0.21 ± 0.12, 0.26 ± 0.15, and 0.29 ± 0.08 eV for j = 3, 2, and 1, respectively (Table 3, Fig. 2). Therefore, no significant preference should occur for the formation of any specific structure with a specific octahedral Fe-Mg distance. That is, the octahedral Al, Fe, and Mg atoms in this mineral should be randomly distributed. Accordingly, the relative possibilities of the formation of configurations with j = 3, 2, and 1 were 1/7, 3/7, and 3/7, respectively, regardless of the presence of cv or tv, and cis- or trans-Mg structures.
Influence of Fe Octahedra on the H+ Adsorption Strength
The H+ adsorption energies (HAE) were calculated for two H+ environments: H-rich and H-poor conditions (Table 3). The HAE of configurations in the H-poor environment were 1.98 eV higher than the HAE values in the H-rich environment because of the difference in the μH value for H-rich versus H-poor environments. The negative values of HAE in the H-rich environment indicated that the H+ adsorption was an exothermic reaction, and the clay preferred to adsorb the added H+. The positive HAE values in the H-poor environment indicated that the H+ adsorption was an endothermic reaction and the H+ adsorption strength was very weak. The more negative HAE values corresponded to higher H+ adsorption stability.
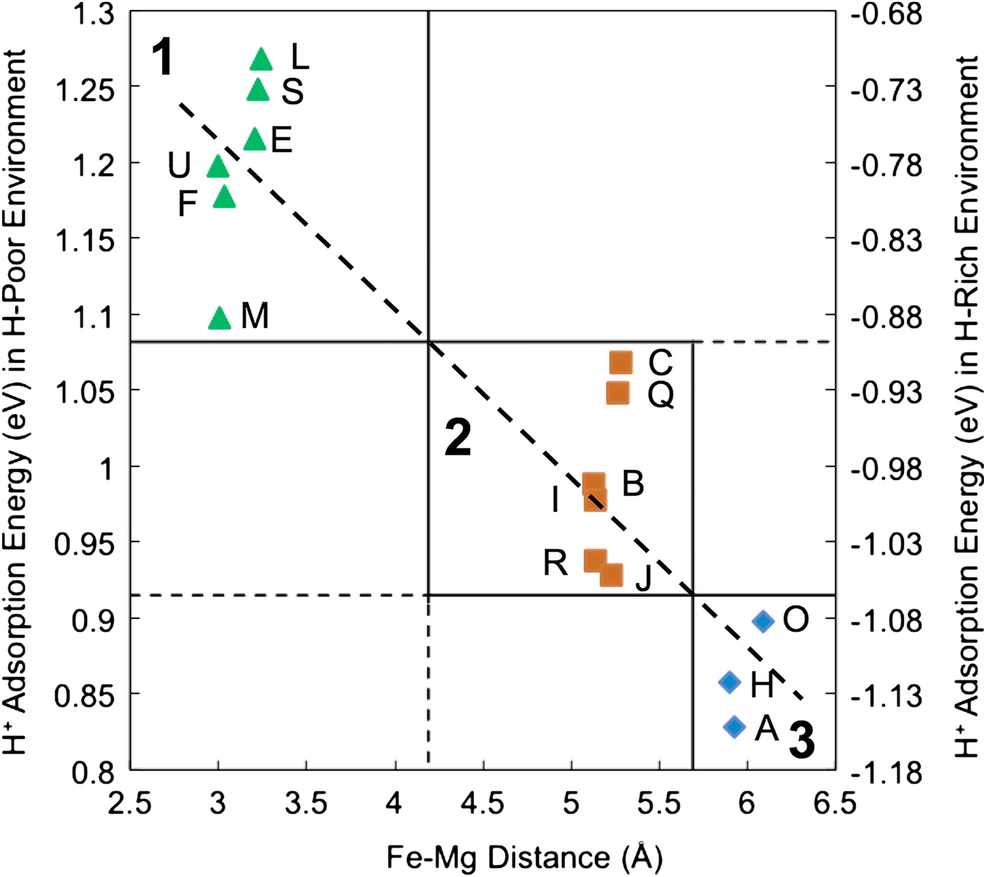
A strong linear correlation of HAE with the direct Fe-Mg distance was found for both H-rich and H-poor environments (R 2 = 0.83, Fig. 3). The results were separated into three distinct groups (labeled 1, 2, and 3) based on the number of octahedral jumps (j) from Fe to Mg and HAE values. The average HAE values were –0.78 ± 0.05, –0.99 ± 0.05, and –1.12 ± 0.03 eV for groups 1, 2, and 3 in the H-rich environment, respectively. These average HAE values were significantly different from each other (p < 0.001). Accordingly, the H+ adsorption stability increased significantly as a function of Mg-Fe distance: group 1 < group 2 < group 3.
The H+ adsorption energy as a function of the Fe-Mg distance under H-rich and H-poor conditions. The letters beside each symbol correspond to the configurations in Table 1. Three groups (labeled 1, 2, and 3) correspond to the number of octahedral jumps from Fe to Mg (noted by j values in Table 1). The dashed line is the linear regression line with R 2 = 0.83.

The influence of the relative distance of octahedral Fe to Mg on the H+ adsorption strength (Fig. 3) can be ascribed to the electronegativity of these cations. The electronegativity of Fe3+ (1.83) is larger than Al3+ (1.61) and Mg2+ (1.31) (Pauling Reference Pauling1960). Thus, the Fe3+ cation tends to pull electrons toward itself and influences the polarity of bonds within these ions. The closer the Fe3+ cation was to the Mg2+ cation, the more electrons were pulled away from Mg2+, causing diffusion of the electron charge density of the Mg2+ cation and a weaker adsorption strength of the H+ cation. Similarly, Lavikainen et al. (Reference Lavikainen, Tanskanen, Schatz, Kasa and Pakkanen2015) observed that the distance of Mg-substitutions on montmorillonite affected the electron density around the surface oxygens. An analogous example to this phenomenon was the inductive effect observed in organic compounds, where the distance of the functional group substitutions influences the strength of the bonds (Carey and Sundberg Reference Carey and Sundberg2007). For example, if X withdraws electrons in X←COO-, the anion XCOO- is stabilized and the acid is strengthened (that is, the ratio of XCOO-/XCOOH increases). Conversely, if X releases electrons in X→COO-, the anion XCOO- is destabilized and the acid is weakened (that is, the ratio of XCOO-/XCOOH decreases).
The three groups of configurations with significantly different HAE identified from this DFT simulation were consistent with the observations from published cation adsorption data on Wyoming SWy-1 montmorillonite (Schulthess and Huang Reference Schulthess and Huang1990; Nolin Reference Nolin1997), which had Mg and Fe concentrations similar to those used in this DFT study. The adsorption capacities of these three types of adsorption sites on Wyoming SWy-1 montmorillonite were 43, 41, and 16% of the total CEC, respectively (Nolin Reference Nolin1997). These values agreed with the relative possibilities of the formation of configurations with j = 1, 2, and 3 as noted above, which were 43, 43, and 14%. These ratios will not be influenced by the formation of a certain group of structures. For example, if both cis- and trans- structures were formed, nine structures out of a total of 21 will be formed with j = 1, and the possibility is 43% (0.43 = 9/21). If only the cv was present, this resulted in 6 out of 14 structures or 43% (= 6/14). If only the tv was present, this resulted in 3 out of 7 structures or 43% (= 3/7). Other combinations will also lead to the same answer, such as cis-Mg or trans-Mg structures. Similarly, j = 2 has 43% probability (= 3/7), and j = 3 has 14% probability (= 1/7). Given the similarity of the chemical composition of Wyoming SWy-1 (SWy-2 or SWy-3) montmorillonite with the composition used in these DFT simulations, these percentages should also apply to the natural SWy montmorillonite. This DFT study offered an entirely new explanation of the location and proportion of these three adsorption sites, namely that all three sites could reside in the interlayer, and that the strength of these adsorption sites is a function of the direct octahedral Fe to Mg distance (or number of octahedral jumps between them).
Naturally, external edge and planar sites also exist, but their contributions to the ion-exchange reactions are small relative to the interlayer sites (Schulthess & Huang Reference Schulthess and Huang1990; McKinley et al. Reference McKinley, Zachara, Smith and Turner1995; Bradbury and Baeyens Reference Bradbury and Baeyens1997; Missana et al. Reference Missana, Benedicto, García-Gutiérrez and Alonso2014). Furthermore, if the NISE effect (Ferreira et al. Reference Ferreira, Schulthess and Giotto2011; Schulthess et al. Reference Schulthess, Taylor and Ferreira2011) can be applied to clay minerals, then the strength of adsorption sites in constrained environments (i.e. interlayer sites) can be much stronger than those of non-constrained environments (i.e. edge and planar sites). This is particularly relevant with weakly adsorbing alkali cations, such as Na+, that are observed to adsorb surprisingly strongly on montmorillonite at low pH values (pH < 2.5; Nolin Reference Nolin1997). Similarly, Cs+ cations adsorbed stronger in the constrained interlayer sites of vermiculite than the external (edge and basal) sites (Dzene et al. Reference Dzene, Tertre, Hubert and Ferrage2015).
This study can be applied to other 2:1 expansive clay minerals with different isomorphic substitutions. For example, the Fe3+:Mg2+ ratio of smectites can vary significantly. Since the electronegativity of Fe3+ is greater than Al3+, increasing the number of octahedral Fe3+ atoms around the Mg2+ atoms should also increase the electronegativity of the environment surrounding the Mg2+ atom. Based on the DFT results (Fig. 3), the smectite clays with higher Fe3+:Mg2+ ratios are presumed to have a weaker affinity toward the H+ counter cations. The presence of trace levels of other metal substitutions in montmorillonite’s octahedral sheet (e.g. Ti4+ or Mn2+) could also account for additional adsorption sites, albeit very small. For example, trace levels of a strong fourth site have been proposed in order to improve adsorption model fit, but the location and chemical structure of this fourth site was not specified (Tertre et al. Reference Tertre, Beaucaire, Coreau and Juery2009; Martin et al. Reference Martin, Wissocq, Benedetti and Latrille2018). Macroscopic data would have trouble distinguishing trace levels of adsorption on trace levels of octahedral substitutions, but statistical correlations of the amount of isomorphic substitution could help resolve this problem. Furthermore, rather than optimizing adsorption site densities and adsorption strengths based only on modeling adsorption data, the adsorption site densities calculated from the chemical structures of the clay minerals would help to simplify and verify the adsorption modeling of clay minerals.
Conclusion
Twenty-one configurations of montmorillonite exist when two octahedral Al out of every eight are substituted by Fe and Mg. The DFT simulation showed no preference for the formation of a specific montmorillonite structure. Three groups of configurations with significantly different H+ adsorption strengths were found as a function of the octahedral Fe to Mg distance. Assuming an even probability of occurrence of 21 octahedral structures in montmorillonite, the percentage of these three groups of configurations were 43, 43, and 14%, which agreed with the three major sites from published experimental adsorption data. This study provided an entirely new explanation of the location and proportion for these three major adsorption sites on montmorillonite. That is, all three major adsorption sites were in the interlayer, and their adsorption strength was a function of the distance of octahedral Fe to Mg. This study confirmed that the adsorption sites on montmorillonite can be influenced by the chemical composition and octahedral cation distribution.
Electronic supplementary material
The online version of this article (https://doi.org/10.1007/s42860-019-00038-9) contains supplementary material, which is available to authorized users.
Acknowledgments
This work was supported by the USDA National Institute of Food and Agriculture, Hatch project accession number 1013470.
Compliance with Ethical Standards
Conflict of Interest
The authors declare that they have no conflict of interest.