

Introduction
As of 2012, obesity in the United States occurs in approximately 1 in 3 adults and 17% of children,Reference Ogden, Carroll, Kit and Flegal1 coined the obesity crisis. In addition to traditional areas of focus in the field, such as increased sedentarism and consumption of energy-dense foods, early-life programming of metabolism is being investigated as a cause of obesity. The Barker Hypothesis originated from evidence in Europe of strong correlations between low birth weight and adult cardiovascular disease.Reference Barker2 Hypocaloric undernutritionReference Delahaye, Breton and Risold3 and protein restrictionReference Cripps, Martin-Gronert, Archer, Hales, Mercer and Ozanne4 have been used as models to mimic this metabolically damaging phenotype. However, the modern obesity epidemic is occurring in a situation of food abundance rather than restriction; therefore, a more relevant question may be how maternal overnutrition affects offspring energy homeostasis.
It is already known that maternal diet-induced obesity (DIO), produced through high-fat diet (HFD) feeding during pregnancy and lactation, causes obesity in male offspring regardless of their subsequent diet.Reference Howie, Sloboda, Kamal and Vickers5 This treatment also impairs glucose metabolism.Reference Rother, Kuschewski and Angel6 There is evidence of early hypothalamic inflammation, suggesting a mechanistic link between the Barker Hypothesis and the hypothalamic inflammation hypothesis of DIO.Reference Velloso, Araújo and de Souza7 Females may be protected from the obesogenic effects of maternal DIO through 17β-estradiol control of hypothalamic and peripheral energy homeostasis. Recently, we demonstrated that the loss of estrogen receptor (ER)α partially interferes with the effects of maternal HFD in female mice and that ERα signaling independent of the estrogen response element restores that sensitivity.Reference Roepke, Yasrebi, Villalobos, Krumm, Yang and Mamounis8
Caloric abundance is a characteristic of modern Western life, but changes in the types of foods consumed have also occurred during this time period. HFD-induced DIO, while closer to the Western diet than caloric restriction, is not an entirely accurate comparison. Fat intake did not substantially increase during the 20th century,Reference Taubes9 however, over that time period, the representation of n-6 polyunsaturated fatty acids (PUFAs) like linoleic acid (LA) increased enormously.Reference Blasbalg, Hibbeln, Ramsden, Majchrzak and Rawlings10 Breast milk LA has increased with general consumption, and infant formulas use n-6 laden vegetable oil as their primary fat source.Reference Ailhaud and Guesnet11 In fact, regulations require that infant intake is at least, but not limited to, the amount of LA measured in modern samples of breast milk. DIO research has targeted specific fatty acids (FAs) in their HFDs as a way to address this real-world phenomenon.Reference Ikemoto, Takahashi, Tsunoda, Maruyama, Itakura and Ezaki12 In some studies, high LA oils have been shown to be obesogenic compared to saturated fatty acid (SFA),Reference Alvheim, Malde and Osei-Hyiaman13 while others show SFA,Reference Wit, Derrien and Bosch-Vermeulen14 and even monounsaturated fat,Reference Tsunoda, Ikemoto and Takahashi15 to be potent obesogens. These conflicting results may be due to inconsistencies in FA profile reporting, especially when using lard without confirmation of FA profile.Reference Masterjohn16 Our group recently showed that both SFA and LA were obesogenic in mice, LA slightly more so.Reference Mamounis, Yasrebi and Roepke17
There is reason to believe that the FA profile of maternal diet, in addition to the total fat content, variably affects offspring. High LA intake during pregnancy increased hypothalamic ER abundance in female offspring, as well as voluntary alcohol intake.Reference Cabanes, Assis and Gustafsson18 Maternal high-LA feeding produced obesity and greater adipocyte maturation and size in offspring, an effect that was blunted by increasing alpha-linoleic acid (ALA), which is a competitor for prostaglandin-producing enzymes.Reference Massiera, Saint-Marc and Seydoux19 The stimulatory effect of LA/ALA ratio on early-life adipogenesis has been shown in guinea pigsReference Pouteau, Aprikian and Grenot20 and other animals.Reference Muhlhausler and Ailhaud21 Although these studies look at the effects on offspring obesity of maternal intake of LA per se, comparing a high LA/ALA ratio to a more balanced one, rather than to a high SFA intake is not a good comparison to the change in human diet. Early 20th century and before, the American diet was not high in LA and ALA intake, but rather high in SFA, monounsaturated fatty acids, and much lower in overall PUFA with a fraction of the n-6/n-3 ratio consumed today.
Therefore, we hypothesize that offspring of dams fed high LA HFD will develop greater obesity and metabolic impairments than offspring of dams fed high SFA HFD. To address this hypothesis, we fed female mice with either primarily vegetable oil or primarily coconut oil HFDs, or a standard low-fat control (CON), during breeding, pregnancy, and lactation. Obesity, metabolic outcomes, and hepatic gene expression of male and female offspring were recorded.
Materials and methods
Animal care
All animal treatments were in accordance with institutional guidelines based on the National Institutes of Health standards and performed with the Institutional Animal Care and Use Committee approval at Rutgers University. Female and male wild-type C57BL6/J mice were selectively bred in-house, maintained under controlled temperature (23°C) and photoperiod conditions (12/12 h light/dark cycle), and given access to food and water ad libitum. Mice were weaned and ear tagged at postnatal day 21 (PND 21) and housed in groups until the start of experiment.
Breeding
At ∼7 weeks of age, female dams (n = 6–8/diet) were acclimated for 4 weeks to their experimental diet, then paired with males for mating. Males were removed at first sign of pregnancy, either by copulation plug or rapid body weight gain in dams. Dams were maintained on their experimental diet through pregnancy and lactation, and offspring were weaned, tagged, and housed in groups by sex at PND 21. Litters were culled to 6–8 to remove potential litter size effects. Mating males were reintroduced for a second breeding, while the dams were maintained on their experimental diet. All females were limited to two matings to reduce the impact of multiparity on offspring energy homeostasis.Reference Rebholz, Jones and Burke22
Experimental diets
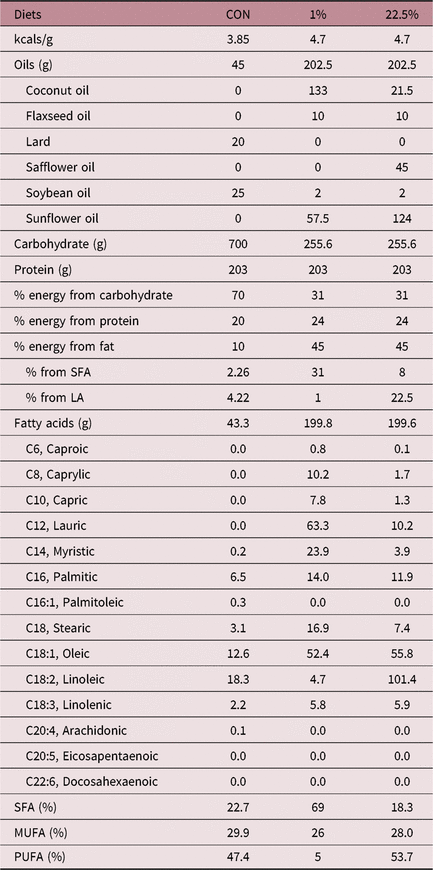
All experimental diets were prepared as pellets by Research Diets (New Brunswick, NJ, USA). FA profile was assured through in-house gas chromatography–mass spectroscopy. Research Diets D12450B (10% kcals from fat) was used as the control diet (CON). We used two HFDs that were isocaloric and isolipidic to Research Diets D12451 (45% kcals from fat) and named for the percentage of calories derived from LA; 1% = mostly coconut oil with some seed oils, 22.5% = mostly safflower and sunflower seed oils (see Table 1 for FA profile). A constant n-3 ratio content, which led to a rising n-6/n-3 ratio in 22.5%, was used to model the changes in Western dietary FA profile during the 20th century. Coconut oil was chosen as the source of SFA because it is 98% saturated and does not contain the long chain PUFA that animal sources of SFA contain, making these diets a direct comparison of SFA and LA. All diets had identical protein, fiber, and micronutrient contents.
Composition of all diets fed to female mice

SFAs, saturated fatty acids; MUFAs, monounsaturated fatty acids; PUFAs, polyunsaturated fatty acids
Offspring experimental design
Experimental feeding of offspring began at weaning on PND 21. Mice were housed by sex, 3–6 per cage depending on litter size, and given ad libitum access to food and water. Offspring diet was either low-fat diet (LFD – 10% kCal fat; Research Diets D12450H) or a standard high-fat diet (HFD – 45% kCal fat; Research Diets D12451). Body weight and food intake (per cage food intake) were recorded weekly for 25 weeks followed by body composition measurements using an EchoMRI 3-in-1 Body Composition Analyzer (Echo Medical Systems, Houston, TX, USA) and calorimetric and activity measurements (48 h run) via Columbus Instruments’ Comprehensive Lab Animal Monitoring System (Columbus Instruments, Inc., Columbus, OH, USA). A glucose tolerance test (GTT), following a 5 h fast, was administered via intraperitoneal (ip) injection of 2 g/kg glucose in 0.9% saline solution. Blood glucose (BG) from tail blood was measured with an AlphaTrak 2 Blood Glucose Monitoring System (Abbott Laboratories, Abbott Park, IL, USA) pre-injection and 15, 30, 60, 90, 120, and 180-min post-injection. An insulin tolerance test (ITT) following a 4 h fast involved an injection of 0.75 U/kg insulin (Humulin R, Lilly, Indianapolis, IN, USA) in 0.9% saline solution and followed the same BG measurement scheme as GTT. Mice were given 4 days of rest each between CLAMS, GTT, and ITT.
Tissue collection
At completion of physiological assays, mice were given another 4 days of rest while remaining on the same diet and then killed by decapitation after ketamine sedation (100 μl of 100 mg/ml, ip). Trunk blood was collected and prepared for plasma analysis of the peptide hormones insulin and leptin, and the cytokines interleukin-6 (IL6), and monocyte chemoattractant protein-1 (MCP1) by Luminex Magpix multiplex (EMD Millipore, Billerica, MA, USA). Plasma was prepared by adding a protease inhibitor, 4-(2-Aminoethyl) benzenesulfonyl fluoride hydrochloride (1 mg/ml, Sigma-Aldrich) to each K+ EDTA collection tube. Samples were maintained on ice until centrifugation at 3000 rpm for 10 min at 4°C. Supernatant was then collected and stored at –80°C until analysis.
Quantitative real-time PCR
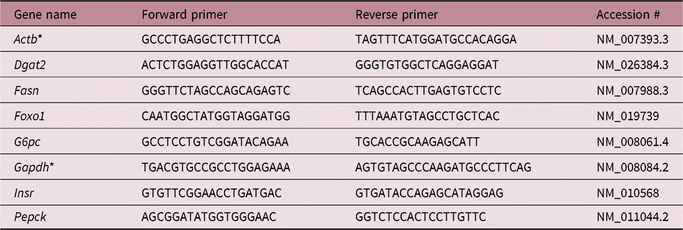
In preparation for RNA extraction and measurement, liver samples were collected and transferred to RNAlater (Life Technologies, Inc., Grand Island, NE, USA) and stored at −80°C. Total RNA was extracted using Trizol (Life Technologies, Inc.) and NucleoSpin RNA extraction Kits (Macherey-Nagel, Inc, Bethelehem, PA, USA) according to the manufacturer’s protocol. Total RNA was DNase I-treated, using the extraction kits, to minimize genomic DNA contamination. RNA quantity and quality were determined using a NanoDrop ND-2000 spectrophotometer (ThermoFisher, Inc., Waltham, MA, USA) and an Agilent 2100 Bioanalyzer and RNA Nano Chips (Agilent Technologies, Inc., Santa Clara, CA, USA). Samples with an RNA Integrity Number below six were not used. cDNA was synthesized from 500 ng of total RNA using Superscript III reverse transcriptase (Life Technologies, Inc.), 4 μl 5 × Buffer, 25 mM MgCl2, 10 mM dNTP (Clontech Laboratories, Inc., Mountain View, CA, USA), 100 ng random hexamer primers (Promega Corporation, Madison, WI, USA), 40 U/μl RNasin (Promega) and 100 mM DTT in DEPC-treated water (GeneMate, Bioexpress, Inc., Kaysville, UT, USA) to a total volume of 20 μl. Reverse transcription was conducted using the following protocol: 5 min at 25°C, 60 min at 50°C, and 15 min at 70°C. The cDNA was diluted 1:20 with Nuclease-free water (GeneMate, Bioexpress) for a final cDNA concentration of 1.5 ng/μl and stored at −20°C. All primers were designed to span exon–exon junctions and synthesized by Life Technologies, Inc., using Clone Manager 5 software (Sci Ed Software, Cary, NC, USA). See Table 2 for a list of all primer sets used for quantitative real-time PCR (qPCR). For qPCR, 4 μl of cDNA template (an equivalent of 2 ng total RNA) was amplified using either PowerSYBR Green master mix (Life Technologies) or Sso Advanced SYBR Green (BioRad, Inc., Hercules, CA, USA) on CFX-Connect Real-time PCR instrument (BioRad). Standard curves for each primer pair were prepared using serial dilutions of liver cDNA in triplicate to determine the efficiency [E = 10(−1/m) − 1, m = slope] of each primer pair. All efficiencies expressed as percent efficiency were approximately equal (one doubling per cycle, 90%–110%). The relative mRNA expression data were analyzed using the ΔΔCT method.Reference Livak and Schmittgen23,Reference Pfaffl24 Amplification protocol for all the genes was as follows: initial denaturing at 95°C for 10 min (PowerSYBR) or 3 min (Sso Advanced) followed by 40 cycles of amplification at 94°C for 10 s (denaturing), 60°C for 45 s (annealing), and completed with a dissociation step for melting point analysis with 60 cycles of 95°C for 10 s, 65°C to 95°C (in increments of 0.5°C) for 5 s, and 95°C for 5 s. The Cq geomean of reference genes, Actb and Gapdh, were used to calculate fold change. Quantification values were generated only from samples showing a single product at the expected melting point.
Primer sequences

Actb, beta-actin; Dgat2, diglyceride acyltransferase; Fas, fatty acid synthase; Foxo1, forkhead box O1; G6pase, glucose 6-phosphatase; Gapdh, glyceraldehyde-3-phosphate dehydrogenase; Insr, insulin receptor; Pepck, phosphorenolpyruvate carboxykinase.
* Denotes reference genes.
Data analysis
All data were analyzed as litter averages and expressed as means ± SEM. All data from the weekly body weight and food intake measurements, GTT, and ITT were analyzed using a repeated-measures, two-way ANOVA followed by a post hoc Bonferroni–Dunn multiple comparisons test. CLAMS calorimetry analysis used a two-way ANOVA with Bonferroni–Dunn post hoc multiple comparisons test. Body composition, CLAMS activity, and plasma protein were analyzed using a one-way ANOVA followed by a post hoc Bonferroni–Dunn multiple comparisons test (unpaired). All data analyses were performed on GraphPad Prism 6 software (GraphPad Software, Inc., La Jolla, CA, USA) and in all cases, effects were considered significant at p < 0.05.
Results
Body weight, composition, and food intake
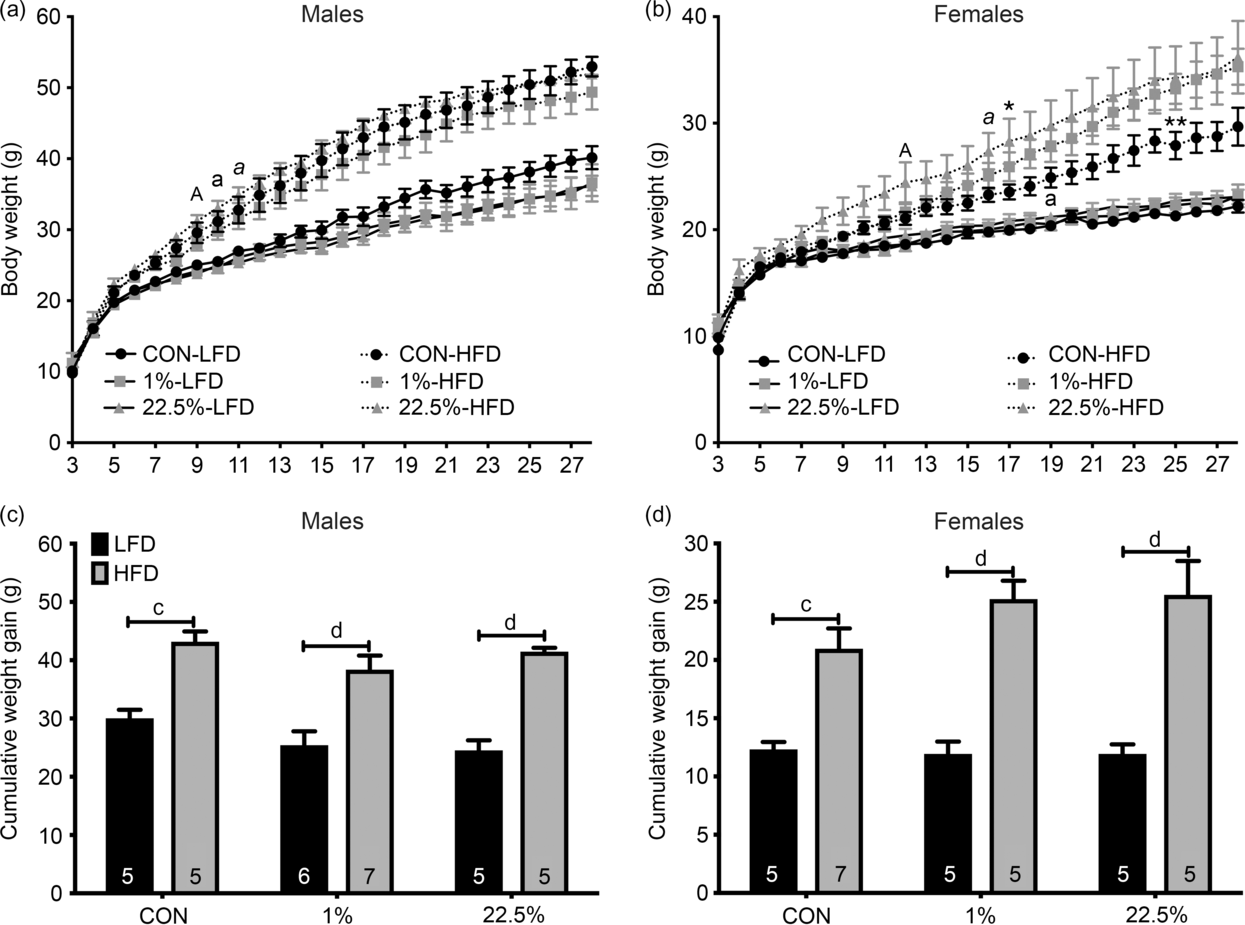
Male and female weaning weights at PND 21 were generally similar, with CON litters trending lighter but without any significant inter-group differences in males: (CON: 9.95 ± 0.31 g [n = 10 litters]; 1%: 11.07 ± 0.31 g [n = 13]; 22.5%: 11.5 ± 0.56 g [n = 10]). However, in females, both HFD increased PND 21 body weights (CON: 9.19 ± 0.25 g [n = 12]; 1%: 10.93 ± 0.23 g [n = 10, p < 0.01]; 22.5%: 10.87 ± 0.53 g [n = 10; p < 0.01]; ANOVA: F(2, 29) = 8.389, p < 0.01). In males, only offspring diet affected final bodyweights (p < 0.0001, Fig. 1a). Regardless of maternal diet, males weaned onto HFD had similarly higher bodyweights than those weaned onto CON. HFD-fed offspring of dams fed 22.5% became heavier at week 9, week 10 for CON-fed dams, and week 11 for 1%-fed dams. At the end of the 25-week feeding study, the HFD-fed offspring of 1%-fed dams were trending lower in bodyweight but without significant differences than the other HFD-fed groups, whereas the CON-fed offspring had the opposite trend, those of both HFD-fed dams trending lower later in the study. As with the males, final bodyweights for females were higher when weaned onto HFD, regardless of maternal diet (p < 0.001, Fig. 1d). Weights diverge at week 12 for offspring of 22.5% fed dams, week 16 for 1%, and week 19 for CON. HFD-fed offspring of 22.5% fed dams became heavier than those of CON-fed dams at week 17; HFD-fed offspring of 1% fed dams did so at week 25 (Fig. 1b).
Body weight of male and female offspring. (a) Male weekly body weights. (b) Female weekly body weights. (c) Male cumulative weight gain 25 weeks post-weaning. (d) Female cumulative weight gain 25 weeks post-weaning. Numbers in columns represent sample size (number of litters) per group. Lowercase letters denote when CON-LFD and CON-HFD first become different. Italicized letters denote when 1%-LFD and 1%-HFD are first different. Capital letters denote when 22.5%-LFD and 22.5%-HFD first become different. Single asterisk denotes a difference between 22.5%-HFD and CON-HFD, double asterisk denotes difference between 1%-HFD and CON-HFD (* or a = p < 0.05, ** or b = p < 0.01, c = p < 0.001, d = p < 0.0001).

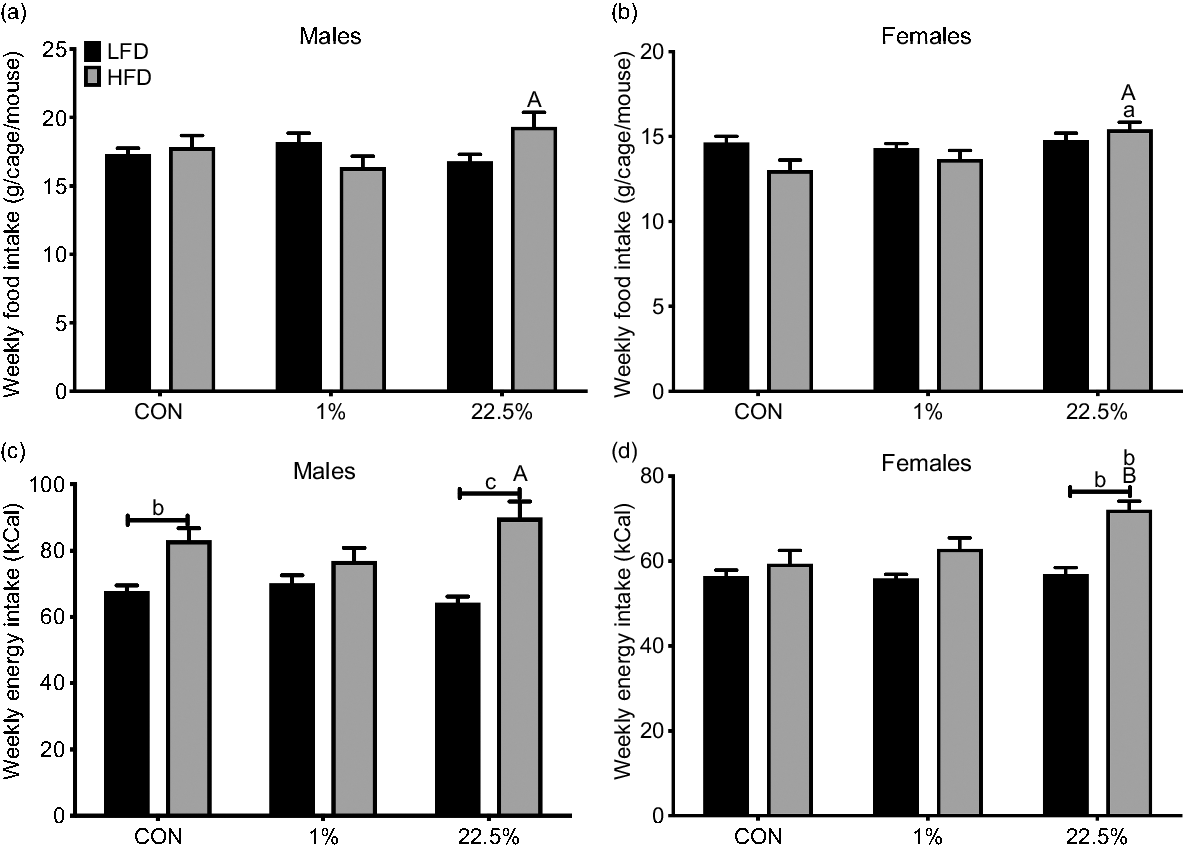
HFD-fed male offspring of 22.5% fed dams consumed more food, in grams, than their CON-fed counterparts (Fig. 2a). Average weekly energy intake in males was primarily affected by offspring diet (p < 0.0001), leading to an increased intake in HFD-fed compared to CON-fed offspring of CON and 22.5%-fed dams (Fig. 2c). HFD-fed male offspring of 22.5%-fed dams had higher food intake than those of 1%-fed dams. HFD-fed female offspring of 22.5%-fed dams consumed more food than their CON-fed counterparts as well as HFD-fed offspring of 1%-fed dams (p < 0.05, Fig. 2c). HFD-fed female offspring of 22.5%-fed dams had higher energy intake than all other females (p < 0.05), which had similar energy intakes to each other (Fig. 2d).
Weekly food intake of male and female offspring. (a) Average weekly food intake (grams) in males. (b) Average weekly food intake (kcals) in females. (c) Average weekly energy intake (grams) in males. (d) Average weekly energy intake (kcals) in females. Lowercase letters denote comparisons within maternal treatment between weaned diets or between CON and 1% or 22.5% within the same adult diet. Uppercase letters denote a difference between 1% and 22.5% within the same adult diet (a = p < 0.05, b = p < 0.01, c = p < 0.001, d = p < 0.0001).

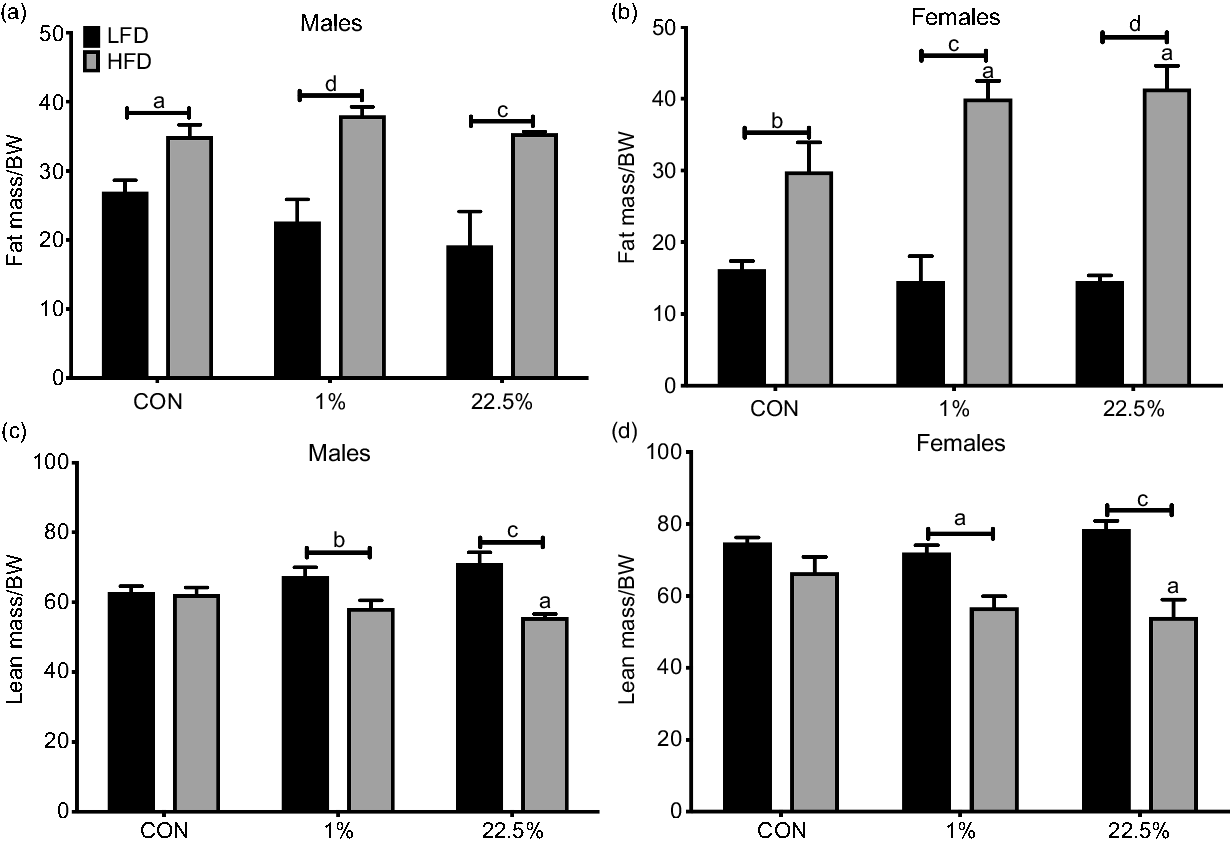
HFD-fed male offspring had a higher ratio of fat mass to bodyweight than CON-fed across maternal diets (p < 0.0001); HFD-fed male offspring of 1%- and 22.5%-fed dams had a lower ratio of lean mass to bodyweight than CON-fed (p < 0.0001, Fig. 3a, 3c). HFD-fed male offspring of 22.5%-fed dams had a lower lean body mass to bodyweight ratio than HFD-fed offspring of CON-fed dams. HFD feeding for female offspring had the same effect as for male offspring, producing a higher ratio of fat mass to bodyweight (p < 0.0001) for all maternal diets and a lower ratio of lean mass to bodyweight for offspring of 1%- and 22.5%-fed dams (p < 0.0001; Fig. 3b, 3d). Both maternal HFDs caused higher fat mass to bodyweight ratio within HFD-fed female offspring than did maternal CON diet, and 22.5% maternal diet caused a lower lean-to-bodyweight ratio than CON.
Body composition of male and female offspring. (a) Male fat mass as a percentage of body weight. (b) Female fat mass as a percentage of body weight. (c) Male lean mass as a percentage of body weight. (d) Female lean mass as a percentage of body weight. Lowercase letters denote comparisons within maternal treatment between weaned diets or between CON and 1% or 22.5% within the same adult diet. Uppercase letters denote a difference between 1% and 22.5% within the same adult diet (a = p < 0.05, b = p < 0.01, c = p < 0.001, d = p < 0.0001).

Glucose metabolism
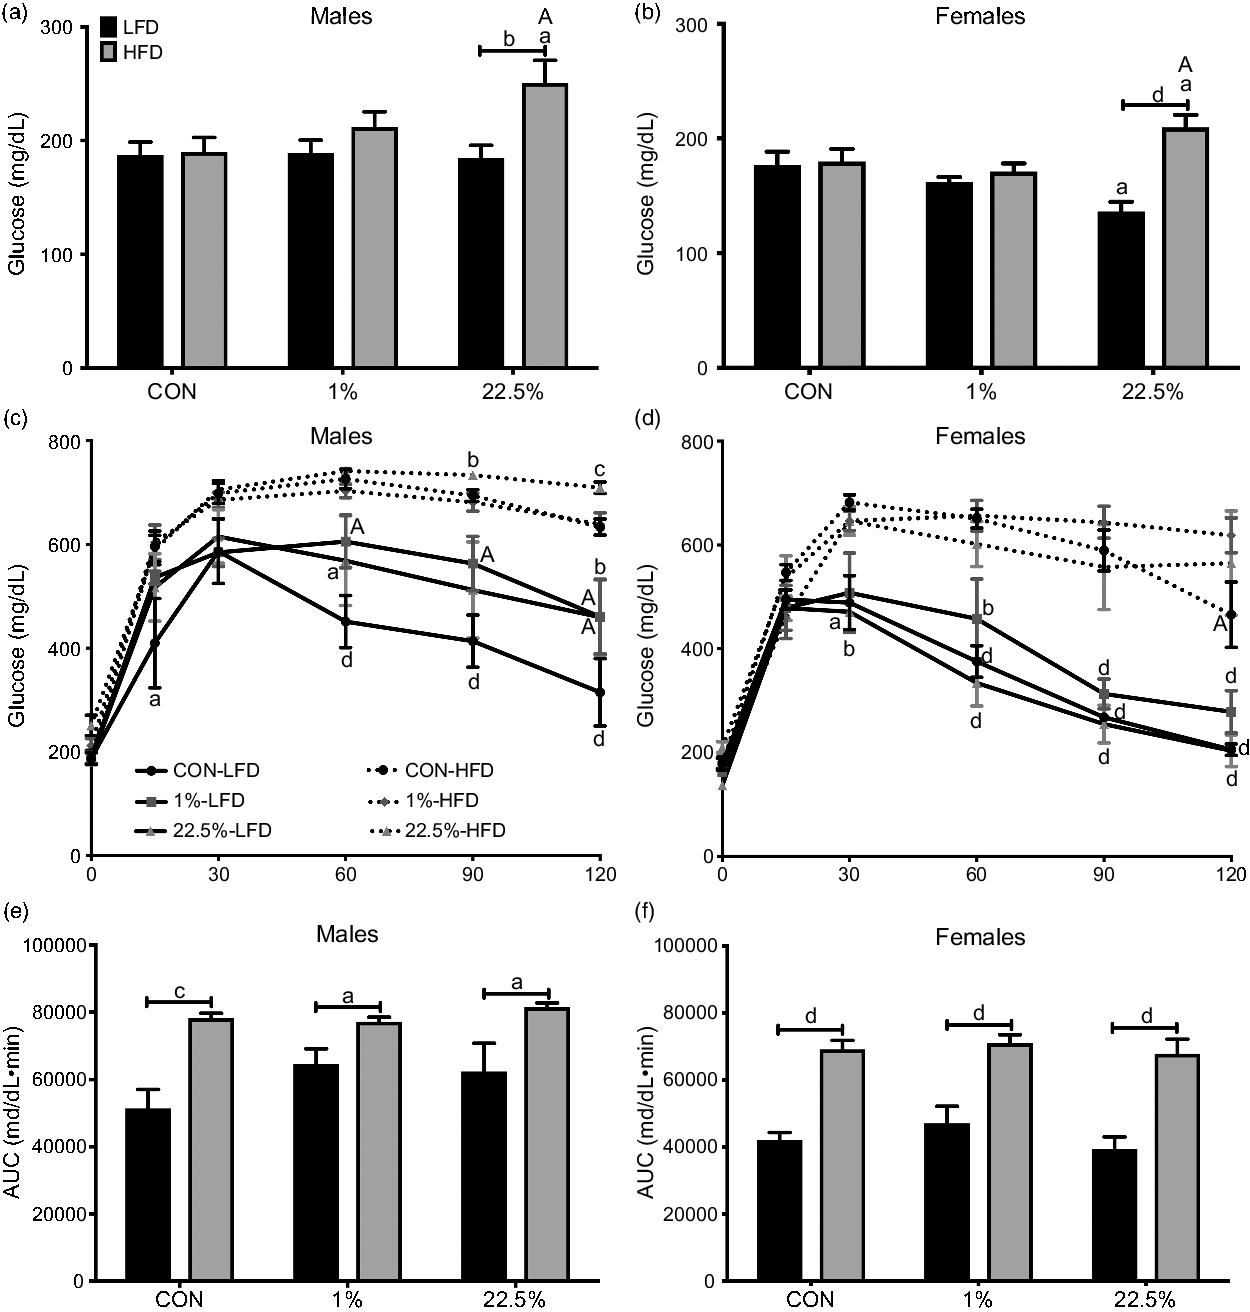
HFD produced higher fasting BG in male offspring of dams fed 22.5% but not CON or 1% (p < 0.05; Fig. 4a). During GTT, offspring diet had a larger impact than maternal diet in determining BG (p < 0.0001) and time course BG area under the curve (AUC) (p < 0.0001), but maternal HFD was needed to potentiate this. Within CON-fed males, offspring of 1%-fed dams had higher BG than offspring of CON-fed dams at 60 and 90 min (p < 0.05) and both 1% and 22.5% were higher than CON at the final 120-min reading (p < 0.05; Fig. 4c). CON-fed offspring of CON-fed dams had lower BG than their HFD-fed counterparts. HFD-fed males had higher BG AUC regardless of maternal diet (Fig. 4e).
Glucose tolerance of male and female offspring. (a) Male fasting blood glucose. (b) Female fasting blood glucose. (c) Male blood glucose during glucose tolerance test. (d) Female blood glucose during glucose tolerance test. (e) Male area under the curve of glucose tolerance test blood glucose. (f) Female area under the curve of glucose tolerance test blood glucose. In (a), (b), (e), and (f): lowercase letters denote comparisons within maternal treatment between adult diets or between CON and 1% or 22.5% within adult diet. Uppercase letters denote a difference between 1% and 22.5% within adult diet. In (c) and (d): lowercase letters denote comparisons within maternal treatments between adult diets, uppercase letters denote comparisons between maternal treatments within adult diets (a = p < 0.05, b = p < 0.01, c = p < 0.001, d = p < 0.0001).

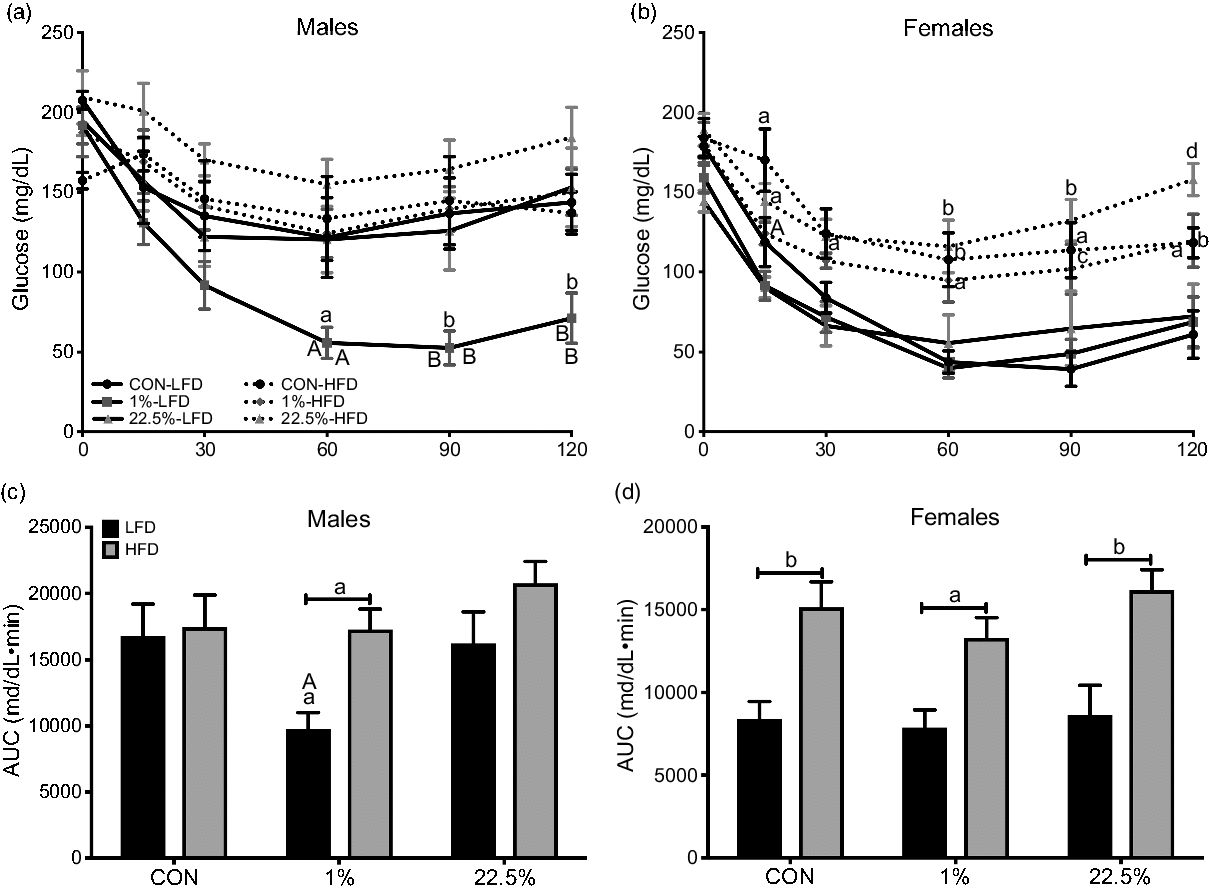
Insulin tolerance of male and female offspring. (a) Male blood glucose during insulin tolerance test. (b) Female blood glucose during insulin tolerance test. (c) Male area under the curve of insulin tolerance test blood glucose. (d) Female area under the curve of insulin tolerance test blood glucose. In (a) and (c): lowercase letters denote comparisons between maternal treatment within adult diets. In (b) and (d): lowercase letters denote a comparison within maternal treatment between adult diets or between CON and 1% or 22.5% within adult diets. Uppercase letters denote a comparison between 1% and 22.5% within adult diets (a = p < 0.05, b = p < 0.01, c = p < 0.001, d = p < 0.0001).

Female fasting BG was similar in all offspring of CON- and 1%-fed dams, but was lower in CON-fed offspring of 22.5%-fed dams than other CON-fed offspring (p < 0.05) and higher in HFD-fed offspring of 22.5%-fed dams than other HFD-fed offspring (p < 0.05; Fig. 4b). There was also a difference between CON- and HFD-fed offspring of 22.5%-fed dams (p < 0.0001), whereas offspring of CON- and 1%-fed dams did not have an intergroup difference. From 60 min onward, all HFD-fed females had higher BG than CON-fed (Fig. 4d). At the end of GTT, HFD-fed offspring of CON-fed dams had lower BG than the other two HFD-fed female groups. Like in males, offspring diet determined GTT AUC, which was higher in all HFD-fed offspring (p < 0.0001; Fig. 4f).
During ITT, both maternal (p < 0.05) and offspring diet (p < 0.05) affected BG in males. HFD-fed offspring trended higher in BG, but the only treatment leading to differences in time course and AUC BG was in the 1% maternal, CON-fed males (Fig. 5a, 5c). CON-fed male offspring of 1%-fed dams had greater BG suppression from 60 min (p < 0.05) and onward (p < 0.01) during ITT than HFD-fed, as well as between CON-fed male offspring of the other two maternal diets. Females reacted to ITT similarly as to GTT, with offspring diet producing the observed differences (p < 0.0001), potentiated by maternal HFD. As with GTT, from 60 min onward CON-fed females had greater BG suppression than HFD-fed females across maternal diets (Fig. 5b). Although CON-fed offspring of 1% dams did not show greater BG suppression from insulin like they did in males, by the end of ITT the HFD-fed offspring of 22.5% dams had nearly recovered to fasting BG levels while their counterpart offspring of CON- and 1%-fed dams had not. ITT AUC was determined by offspring diet similar to GTT (p < 0.0001; Fig. 5d).
Indirect calorimetry and activity
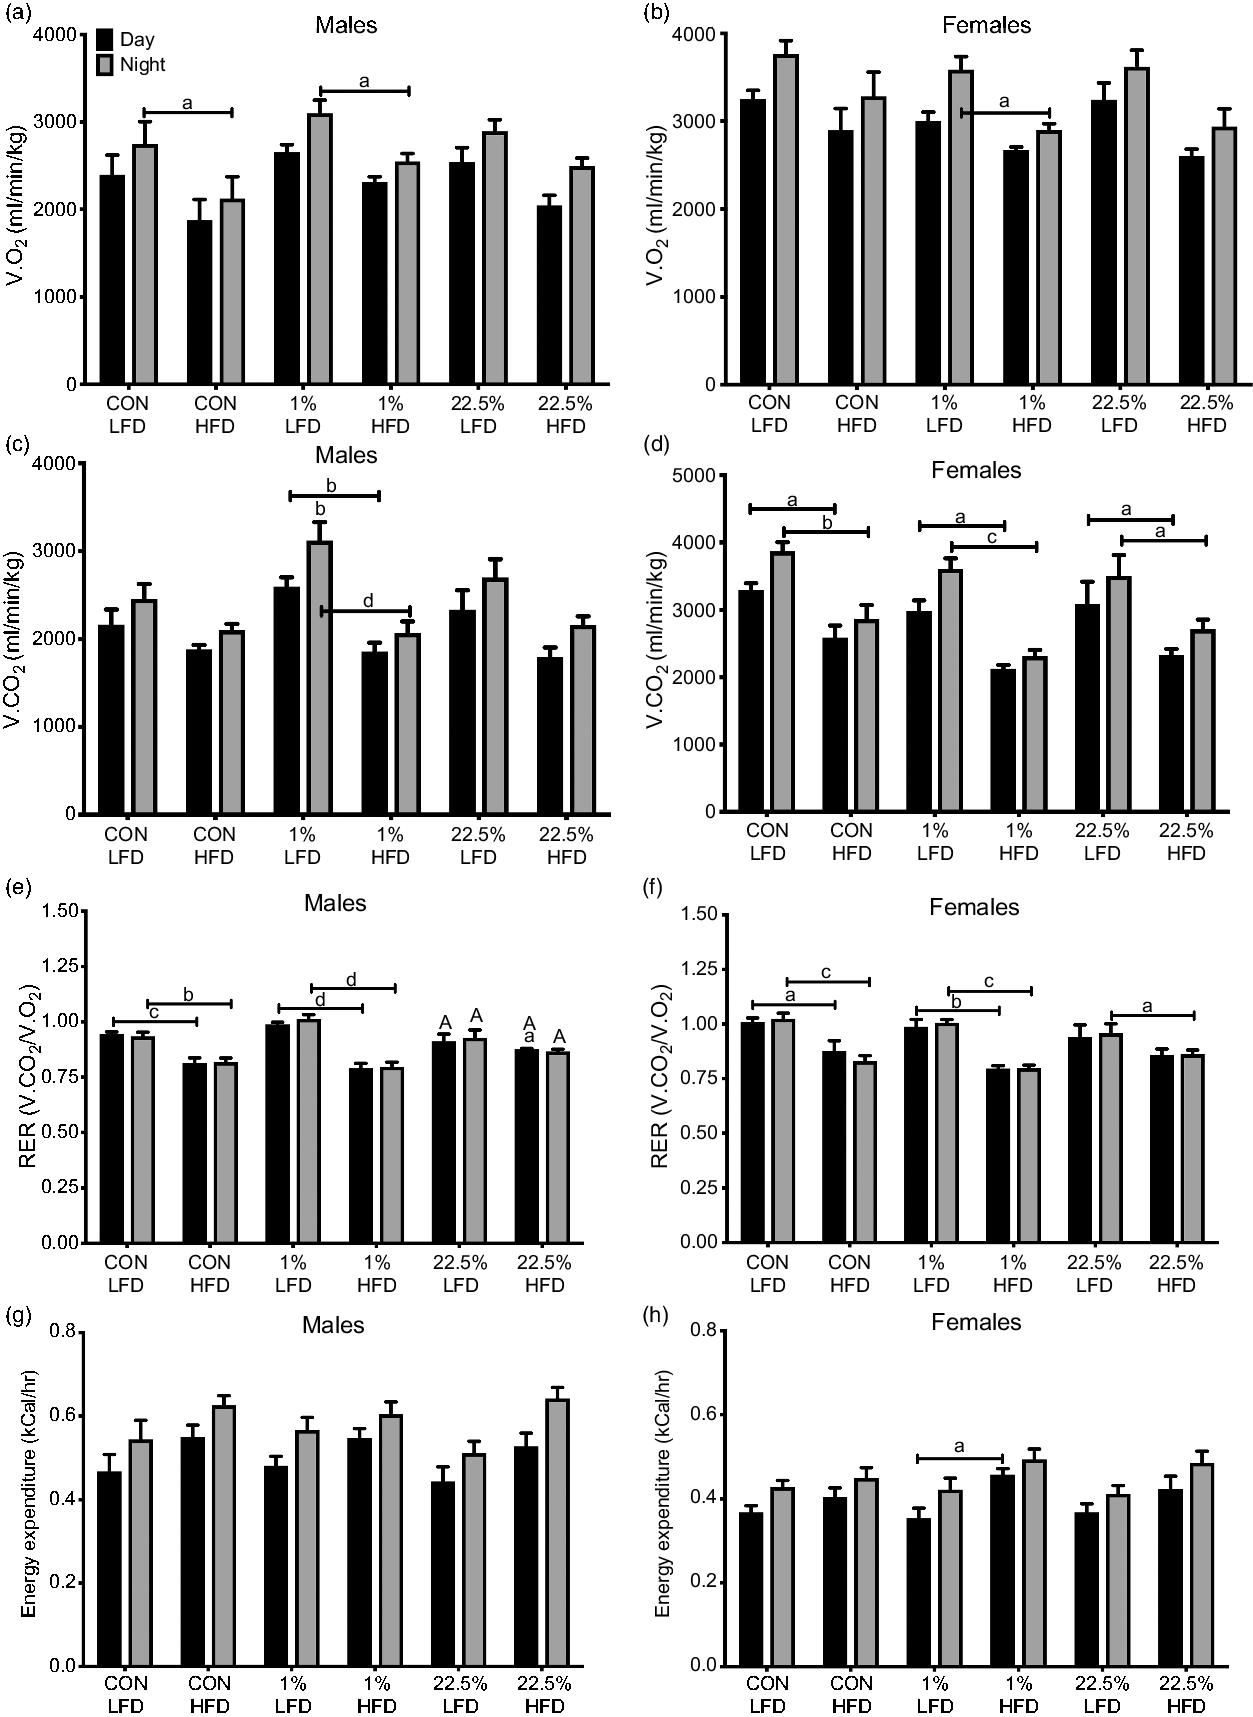
O2 consumption, CO2 production, and energy expenditure were generally higher in both males and females during the night. HFD feeding suppressed O2 consumption in offspring of CON- and 1%-fed dams (p < 0.05; Fig. 6a), and suppressed CO2 production in offspring of 1%-fed dams (p < 0.05; Fig. 6c). HFD decreased the respiratory exchange ratio (RER) in offspring of CON- and 1%-fed dams (p < 0.001), but did so only slightly during the day for offspring of 22.5%-fed dams (p < 0.05; Fig. 6e). Energy expenditure was not affected by offspring or maternal diet (Fig. 6g). In females, the suppression of O2 consumption by HFD was only seen in offspring of 1%-fed dams (p < 0.05; Fig. 6b), but CO2 production was suppressed by HFD in all maternal diet groups (p < 0.05; Fig. 6d). HFD also led to lower RER in all maternal diet groups (p < 0.05, Fig. 6f) and, surprisingly, higher energy expenditure in female offspring of 1%-fed dams (p < 0.05; Fig. 6h).
Metabolic parameters of male and female offspring. (a) Male O2 consumption. (b) Female O2 consumption. (c) Male CO2 production. (d) Female CO2 production. (e) Ratio of CO2 production to O2 consumption in males. (f) Ratio of CO2 production to O2 consumption in females. (g) Estimated male energy expenditure. (h) Estimated female energy expenditure. Capped lowercase letters denote comparisons within maternal diet between adult diets, or between day and night within the same treatment. Lowercase letters denote comparisons between CON and 1% or 22.5% within adult diets. Uppercase letters denote comparisons between 1% and 22.5% within the same treatment (a = p < 0.05, b = p < 0.01, c = p < 0.001, d = p < 0.0001).

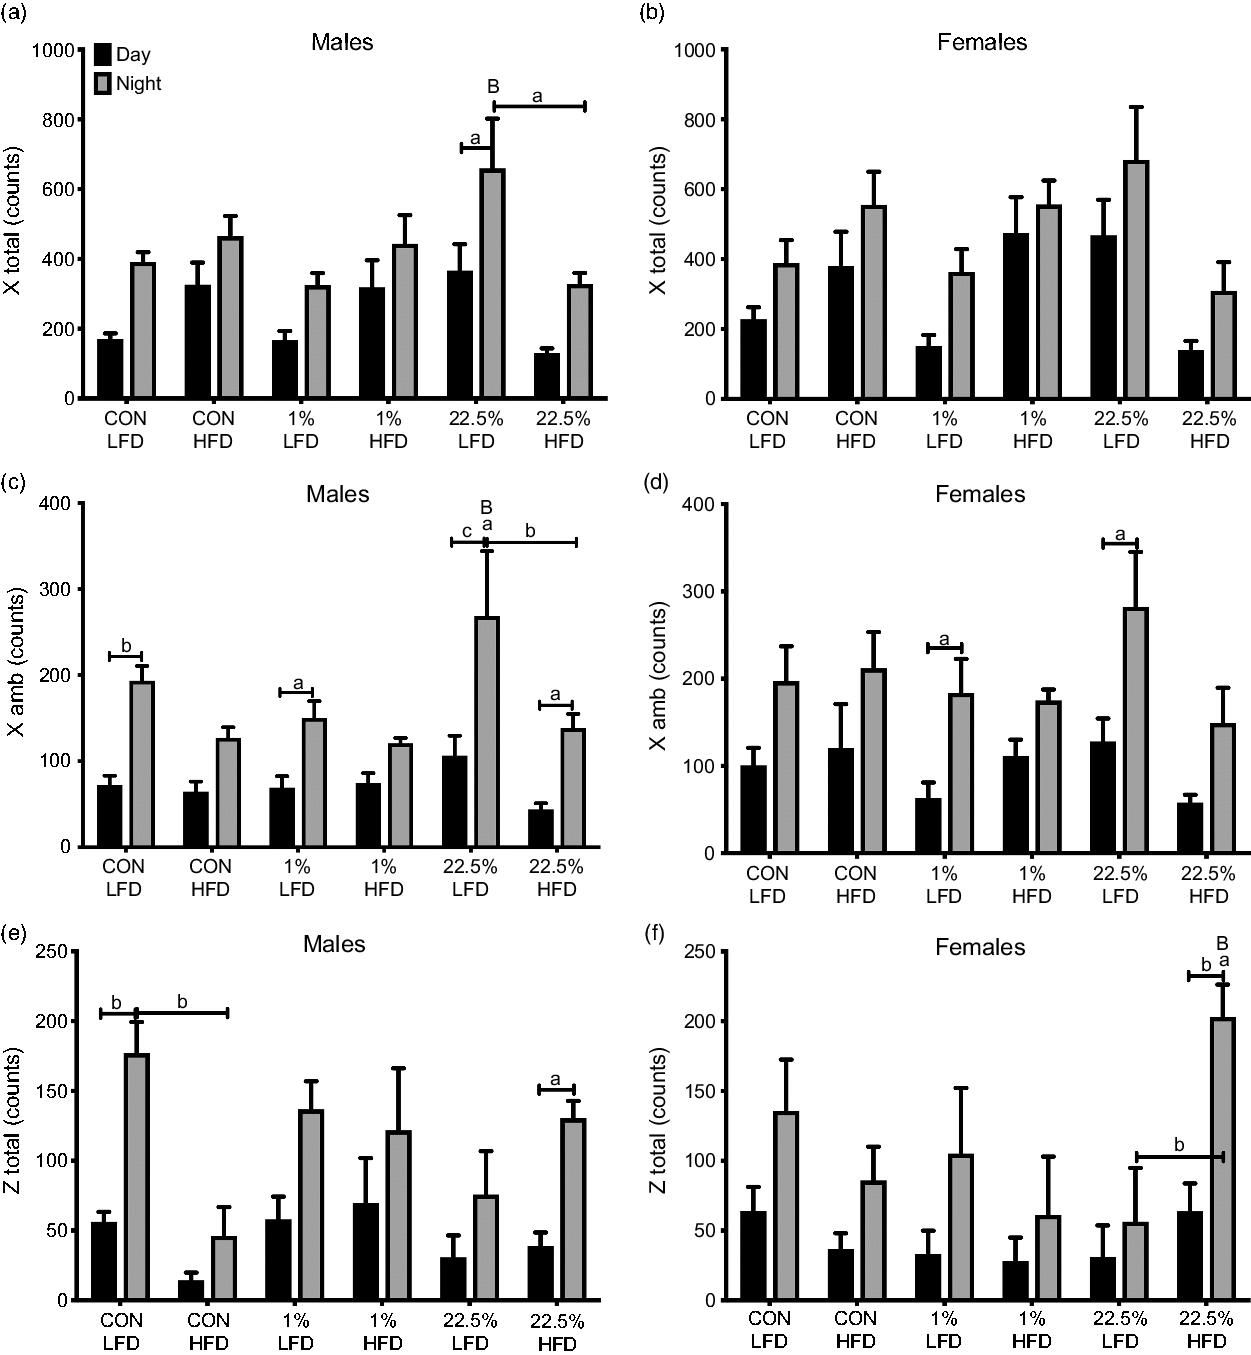
As with gas exchange and energy expenditure, activity was generally higher at night than during the day in all treatment groups. In males, HFD decreased total and ambulatory X-axis movement counts in offspring of 22.5%-fed dams (p < 0.05; Fig. 7a, 7c). HFD decreased movement in the Z-axis in offspring of CON-fed dams (p < 0.01; Fig. 7e). Total and ambulatory X-axis movement was unaffected by offspring or maternal diet in females (Fig. 7b, 7d). Z-axis movement, however, was increased by HFD in female offspring of 22.5%-fed dams, although all groups had high variability in nighttime activity (p < 0.01; Fig. 7f).
Activity of male and female offspring. (a) Male total activity counts on the horizontal axis. (b) Female activity counts on the horizontal axis. (c) Male novel activity counts on the horizontal axis. (d) Female novel activity counts on the horizontal axis. (e) Male total activity counts on the vertical axis. (f) Female total activity counts on the vertical axis. Capped lowercase letters denote comparisons within maternal diet between adult diets, or between day and night within the same treatment. Lowercase letters denote comparisons between CON and 1% or 22.5% within adult diets. Uppercase letters denote comparisons between 1% and 22.5% within the same treatment (a = p < 0.05, b = p < 0.01, c = p < 0.001, d = p < 0.0001).

Plasma proteins
In males, the plasma levels of metabolic hormones insulin (p < 0.01) and leptin (p < 0.0001) were determined by offspring rather than maternal diet (Table 3). All three HFD-fed male groups trended higher than their CON-fed counterparts, but offspring of 22.5%-fed dams had mean circulating insulin more than twice that of the other HFD-fed groups (p < 0.05). Leptin levels were elevated by HFD feeding similarly across all maternal diets (p < 0.05). Levels of inflammatory cytokines IL-6 and MCP-1 (data not shown) had great variability between groups, generally trending lower in offspring of 1%- and 22.5%-fed dams than CON-fed. Within CON-fed offspring, 22.5% maternal diet suppressed IL-6 compared to CON maternal diet (p < 0.05). In females (Table 3), HFD elevated plasma insulin levels in offspring of 1%-fed dams (p < 0.05); all other groups were similar. Plasma leptin was elevated by HFD in all three maternal diet groups (p < 0.05), but to a much greater extend in offspring of 1%- and 22.5%-fed dams than CON-fed. Like in the male offspring, plasma IL-6 and MCP-1 (data not shown) expression were highly variable with trends moving in different directions depending on both offspring and maternal diet, but did not produce a clear effect.
Peptide hormone and inflammatory cytokine plasma concentrations

All units are ng/ml for insulin and leptin and pg/ml for IL-6. Numbers are mean ± SEM. Letters denote significance between LFD and HFD within the same maternal diet.
* Significance between maternal HFD and control maternal diet with the same adult diet.
# Difference between HFD (1% vs. 22.5%).
a,*,# = p < 0.05.
Hepatic gene expression
In males, hepatic Fasn (p < 0.05) and Foxo1 (p < 0.05) expression were influenced by offspring diet and G6pc (p < 0.05) and Insr (p < 0.05) by an interaction between maternal and offspring diets (Table 4). Foxo1 expression was increased by HFD in male offspring of CON-fed dams (p < 0.05). G6pc expression was suppressed by HFD in offspring of 1%-fed dams (p < 0.05) and Isnr in offspring of 22.5%-fed dams (p < 0.05). In females, there was less variability overall in hepatic gene expression than in males (Table 4). Only Fasn and G6pc had differences between groups, both related to maternal 1% diet. 1% maternal diet increased Fasn expression in CON-fed offspring compared to those of CON-fed dams (p < 0.05). Within offspring of 1%-fed dams, HFD suppressed G6pc levels (p < 0.05). No effect of adult or maternal HFD was observed with Dgat2 or Pepck (data not shown).
Hepatic gene expression cytokine plasma concentrations

Fasn, fatty acid synthase; Foxo1, forkhead box O1; G6pc, glucose 6-phosphatase; Insr, insulin receptor. Numbers are fold change ± SEM relative to CON-LFD within each sex. Letters denote significance between LFD and HFD within the same maternal diet.
* Significance between maternal HFD and control maternal diet with the same adult diet.
a,* = p < 0.05.
Discussion
It was previously shown that males are susceptible to maternal overnutrition-induced obesity and metabolic impairment,Reference Howie, Sloboda, Kamal and Vickers5,Reference Rother, Kuschewski and Angel6 and that females, when studied, are partially protected at both the whole physiological and specific tissue levels.Reference Samuelsson, Matthews and Argenton25 In our study of maternal dietary effects, we included male and female offspring in the analysis to observe sex-specific results. The protection from intergenerational effects in females could vary across treatments, and comparing FAs in the context of DIO is a different treatment than simple “overnutrition.” Particular effects of LA on female offspring have already been demonstrated,Reference Massiera, Saint-Marc and Seydoux19 and an interaction with ERα suggests the involvement of sex steroids. The combination of an intergenerational treatment with the targeting of FA changes concurrent with the obesity epidemic is a novel application of nutritional epidemiology to an animal model. The increase in LA intakeReference Blasbalg, Hibbeln, Ramsden, Majchrzak and Rawlings10 is given little consideration in obesity research relative to other dietary changes, such as the increase in sugar consumption, especially when one compares these changes on a caloric-percentage basis. The evidence for an endocrinological, in addition to nutritive, action of FAs through cell surfaceReference Kotarsky, Nilsson, Flodgren, Owman and Olde26 and nuclearReference Georgiadi and Kersten27 receptors makes dietary fat an even more appealing candidate for studying intergenerational effects. In the current study, maternal dietary FA profile amplified the effects of an obesogenic diet in female offspring while subtly reducing body weight gain in males fed LFD. The offspring of dams fed the 22.5% diet appeared to be more susceptible to the obesogenic effects of HFD feeding, showing an increase in body weight 4 and 7 weeks earlier compared to offspring of dams fed the 1% and CON diets, respectively. However, maternal dietary FA profile did substantially effect glucose metabolism in both male and female offspring.
Maternal HFD, especially 22.5%, suppressed IL-6 in CON-fed males but not females, which may be related to the lower body weights of those males in the face of higher energy intakes. An important aspect of low-LA diet is that essential fatty acid (EFA) content is sufficient for growth. The fourth revised addition of Nutrient Requirements of Laboratory Animals recommends 0.68% of energy from LA as necessary to prevent symptoms of EFA deficiency such as growth retardation and acrodynia,28 which is achieved in our 1% diet, and no scaling of thickening of the trunk or tail skin, a more conspicuous sign of EFA deficiency than lower growth rates, was seen. HFD feeding of males from HFD dams caused greater weight gain. Maternal HFD did, however, lead to a less lean body mass in HFD-fed males, a small effect that seems to have come from HFD per se rather than a specific type of FA.
Suggested mechanisms for differences in obesity produced by different FAs, such as endocannabinoid tone,Reference Alvheim, Torstensen and Lin29 may not apply equally between early life and adult exposure. The receptors purported to control differentiation and maturation of pre-adipocytes, the peroxisome proliferator activated receptor (PPAR) family, show binding affinity to PUFA and their downstream eicosanoid metabolites more than to other FAs.Reference Grygiel-Górniak30 PPAR activation produces a pro-adipoblastic signaling environment in pre-adipocytes through elevated cyclic AMP.Reference Massiera, Weill, Legrand, Alessandri and Guesnet31 The resulting higher number of mature adipocytes would tend to accumulate FAs more readily from the circulationReference Jo, Gavrilova and Pack32 and, when induced, produce more obesogenic cytokines.Reference Mamounis, Yasrebi and Roepke17 Several activators of PPARs, especially PPAR gamma, are also known epigenetic actors.Reference Sugii and Evans33 FA receptors, such as the PPARs, would make an effective tool for monitoring and integrating environmental conditions into the gene expression of future generations, since they interact with the most energy-dense macronutrient. In our cohort, however, the effects of adult diet for the most part overruled maternal diet, and both SFA and LA-based HFD were similar.
Maternal FA profile had the most significant results on the glucose metabolism system. Plasma insulin did not strictly follow adiposity, as is usually seen,Reference Wang, Mariman, Renes and Keijer34 but was greatly increased in HFD-fed male offspring of 22.5% fed dams. Predictably, Insr expression in the liver was suppressed. An effective lack of insulin signal reception, causing increased rates of secretion in an attempt to compensate, may reduce satiety; this may be why that group’s food intake was greatest. The most striking results of the study were the deranged glucose metabolism of this group, which displayed both higher fasting BG and attenuated glucose clearance. These results are similar to our previous findings of 22.5% producing glucose intolerance in male mice.Reference Mamounis, Yasrebi and Roepke17 The results of maternal 22.5% on ITT in females, likewise, were similar to the results of that same diet on adult female miceReference Mamounis, Hernandez, Margolies, Yasrebi and Roepke35 and to insulin resistance previously demonstrated from dietary LA,Reference Alvheim, Malde and Osei-Hyiaman13 through the mechanism of increasing stimulation of the carnitine palmitoyltransferase I systemReference Power, Yaqoob, Harvey, Newsholme and Calder36 and subsequent inhibition of mitochondrial glucose oxidation. This provides evidence for a relationship between the intergenerational and adult effects on LA on glucose metabolism. Leptin predictably followed adiposity in males, but an increase from maternal HFD in females, indicative of greater resistance, may point to an additional lack of potentiation of insulin-mediated glucose clearance.
O2 consumption and CO2 production were higher in CON-fed male offspring of 1%-fed dams. In addition to a similar food intake between offspring of CON-fed and 1%-fed dams, this suggests that the reduced body weights in that group are due to a higher metabolic rate. HFD-fed female offspring of 22.5%-fed dams had suppressed O2 consumption and CO2 production, likely caused by suppressed glucose metabolism.
Since our measurement of spontaneous activity did not show effects of maternal or offspring diet, but only effects of night and day, the differences in weight gain and glucose metabolism are likely due to basal metabolic rate. This is supported by the reduced CO2 production in HFD-fed females, and HFD-fed male offspring of 1%-fed dams, compared to the leaner mice fed a low-fat diet. Respiratory O2 consumption may be overestimated in animals with high concentrations of PUFA in their tissues, due to oxygen being added to reactive lipids to form peroxides.Reference Yin, Xu and Porter37 The difference in O2 used in cellular respiration is, therefore, likely larger than that measured through indirect calorimetry. This could account for the bigger difference in CO2 production between groups than O2 consumption, in addition to different amounts of CO2 liberated from oxidation of carbohydrates compared to FAs. An easy way to account for non-respiratory tissue O2 consumption would be very helpful when studying the effects of FAs that can oxidize at physiological temperatures.
The clearest results obtained from our maternal application of these LA or SFA-laden HFDs was not on weight or body composition but on glucose metabolism. These results are not explainable by any observed change in food intake, activity level, or markers of systemic or central inflammation. Additionally, these results are consistent with previous applications of these diets to male and female adult mice. An endocrinological effect not captured in these assays, or a general metabolic difference between the use of saturated versus unsaturated fats for energy production, is likely to be the cause of this change in glucose metabolism.
It was proposed that obesity induced by early-life LA intake is due to the pro-adipogenic molecular effects of n-6 PUFA on pre-adipocytes through binding of PPARs, and that ERα signaling in female offspring is a source of protection from these effects. A maternal diet high in LA impaired glucose metabolism in HFD-fed male and female offspring, but did not substantially differ from the low LA maternal diet in the response to adult HFD in increasing body fat and obesity in female offspring. If FA profile can alter the propensity of offspring to become glucose intolerant in one generation, addressing this in the food supply might be an effective strategy for preventing, rather than the difficulty in treating, metabolic syndrome. Future studies of longer treatment periods, either beginning the breeders on their experimental diets earlier in their lives or using multiple generations of treatment, may cause a greater observable divergence in offspring, in particular in protein and gene expression that was highly variable in our study. Liver fat analysis, less prone to rapid change than protein and gene expression, could be added to future experiments to support the more volatile molecular assays performed herein. For future studies, an attempt should be made, within practical limits, to model experimental animal diets more closely to the human populations that they are models for rather than forming these diets around what has been used previously in the literature.
Supplementary materials
To view supplementary material for this article, please visit https://doi.org/10.1017/S2040174419000540
Acknowledgments
The authors thank Dr. Sara Campbell for the use of the EMD Millipore MAGPIX® Multiplex® System and Dr. Judy Storch for the use of the Comprehensive Lab Animal Monitoring System and EchoMRI Body Composition Analyzer.
Author Contributions
KJM and TAR contributed to the conceptualization of and to methodology. KJM, NRS, and TAR contribued to formal analysis. KJM, NRS, NM, AY and TAR contributed to investigation. KJM, NRS, and TAR contributed to writing, review, and editing of document. TAR contributed to funding acquisition and supervised the research.
Financial Support
This research was supported by funds from USDA-NIFA NJ06107 and from National Institutes of Health R00DK083457, R00DK083457-S1, P30ES005022, and R21ES027119.
Ethical standards
The authors assert that all procedures contributing to this work comply with the ethical standards of the relevant national guides on the care and use of laboratory animals Mus musculus and has been approved by the institutional committee of Rutgers University.