


Approximately 40% of those inhabiting democracies live in systems that have Westminster-style features, inter alia a fusion of executive-legislative relations, strong norms of majoritarian government, and few checks and balances on executive agenda-setting power (Lijphart Reference Lijphart1999, 10–11).Footnote 1 A central behavioral regularity observed in such systems is a pattern of “government-versus-opposition” roll call voting, whereby government proposals are supported by a cohesive governing majority and opposed by a cohesive opposition minority. Indeed, it is only during periods of minority government or national emergency,Footnote 2 when bills are supported by heterogenous coalitions of legislators, that this pattern is broken.
What can account for this behavioral regularity in the pattern of legislative voting? An obvious answer is “whipping”: inducements and punishments are meted out, ensuring attendance and enforcement of the party line. As shown by Kam (Reference Kam2009), party leaders have at their disposal a range of formal and informal measures that provide incentives to backbenchers to act cohesively. Yet, this offers an incomplete explanation for the general pattern of cohesive government-versus-opposition voting. The key elements of cohesion, on one hand, and “government-versus-opposition” voting, on the other, are not synonymous. In principle, opposition party leaders could enforce any voting strategy (including, for example, supporting rather than opposing the government on every bill). Thus, although whipping may well militate party cohesion, the specific pattern of unified roll call voting requires a separate explanation.
The historical case for the claim is similarly lacking: Cox (Reference Cox1992), for example, can find no evidence of any official whipping before 1832; yet, contemporary observers of parliament wrote of “government” and “opposition” forces and their behaviors well before this date (see Namier and Brooke Reference Namier and Brooke1964, 190–91). Indeed, even the claim that whipping uniquely begets roll call homogeneity is suspect in the Westminster context. In an authoritative study of the origins of party cohesion, Cox (Reference Cox1987, 25) writes that “cohesion increased markedly within the category of whipped votes, starting in the late 1860s and 1870s. Thus, although it is true that the percentage of votes whipped increased in the 1870s, this does not in itself explain the trends in cohesion.” In fact, the relative timing of the origins these behaviors suggests that, if anything, the causal process runs in the opposite direction, with whipping perhaps introduced as an implicit structural innovation for opposition parties in the face of a government majority with agenda power. Indeed, Cox (Reference Cox1982) provides evidence that between 1832 and 1871, cohesion among the opposition was on average higher for the opposition Tories than the governing Whigs.
A more subtle explanation for government-versus-opposition voting is that cohesion within government and opposition ranks, and polarization between these groups, are the result of a simple sorting process. That is, members of parliament (MPs) join parties that advocate the policies they prefer and thus naturally find themselves agreeing and opposing the same sets of policies when considered on the floor of the legislature. Moreover, this pattern may be reinforced over time: parties develop reputations for standing on particular policy issues; like-minded MPs are selected and stand under the party label; and socialization between MPs on the backbenches, and in the lobbies and clubs eventually compounds the behavior. Put otherwise, “birds of a feather flock together”: members of the governing and opposition parties vote cohesively primarily because they share similar preferences.Footnote 3
We present evidence that strongly suggests that voting patterns in Westminster-style democracies cannot be explained by preference alignment alone. Using new data from the Scottish Parliaments between 1999 and 2003 and 2003 and 2007, we show that a pattern of cohesive government-versus-opposition voting is apparent from the outset. This is hard to reconcile with what one would expect given stated preferences on the underlying issues. To give an example, between 1992 and 1997, the Scottish National Party (SNP) voted differently than the Labour Party on just 4% of bills in the House of Commons. This congruence is exactly as one might expect from two center-left parties in opposition. In contrast, just two years later in the first Scottish Parliament, the Nationalists, now the main opposition party, were in disagreement with the Labour Party 69% of the time. Moreover, our analysis of the data shows that a single dimension can correctly predict 95% of the roll calls for Scotland. This dimension fits a government-opposition divide with the Labour Party and the Liberal Democrats at one end, the SNP and Scottish Socialists at the other, and the Conservatives in between. We show that this pattern cannot be explained by an underlying issue dimension.
We provide microfoundations for the emergence of government-versus-opposition voting in relating such behavior to individual incentives that arise due to the basic institutional infrastructure of Westminster democracies. In particular, we investigate the possible associations between voting patterns and the procedural rules for reaching collective decisions in such systems: agenda-setting power is (usually) held by the governing majority in the Commons; a status quo policy is replaced only if the government brings a proposal to the floor that is majority preferred to it; and this decision cannot be overturned by a second chamber. We adapt the basic toolkit of the spatial model: a set of MPs with single peaked preferences on a set of policies each in unidimensional policy space; members are sorted into two main parties, one in government and one in opposition; and on each policy, a member belonging to the government is given agenda-setting power. To this setup, we add that parties can commit to their voting strategies: they can bind themselves, for example, by invoking the party whip before the proposal is made and votes are cast. This allows us to explore how different voting strategies affect policy proposals and hence outcomes and payoffs: “sincere voting” occurs when each MP votes for a proposal as long as it does not leave her worse off than she would be if the status quo remains in place, whereas “opposition voting” occurs when each member of the opposition always votes against the government irrespective of the proposal. We show that on some bills, “opposition voting” yields higher opposition payoffs than sincere voting. On such bills, the opposition binds itself to opposing any government proposal. The equilibrium involves a convex combination of “opposition” and “sincere” voting and fits the stylized facts of government-opposition systems: (1) government and opposition tend to vote cohesively, (2) the opposition votes against the proposals put forward by the government, and (3) the opposition votes against government proposals that leave them better off than they would be if the status quo remained in place.
Our analysis provides a simple strategic rationale for government-versus-opposition voting. By committing to oppose the government, the opposition forces it into proposals that appeal to a majority formed by its own (i.e., government) backbenchers. This can benefit the opposition. A necessary condition is that parliament is not completely polarized. Specifically, we require that on some bills, there is a degree of “overlap” in the preferences of government and opposition MPs: on some policies, the members of the opposition party have preferences closer to those of the agenda setter than some members of government. This is a very weak condition, almost certainly satisfied in all Westminster systems, and we provide empirical evidence to demonstrate that it holds in practice. An implication of this finding is that the conditions that give rise to sincere and strategic voting are not the same: sincere voting should be (relatively) higher when government and opposition are completely polarized, strategic government-opposition voting of the type that we analyze is higher when there is a degree of convergence in underlying preferences.
A main result stemming from our analysis is that strategic opposition and cohesive government voting are two sides of the same coin: in equilibrium, cohesive government-versus-opposition voting is mutually reinforcing; strategic opposition forces the government to take account of its own backbenchers, thus inducing cohesion on the government backbenches. Our focus on strategic interaction between government and opposition forces offers a different perspective to the predominant view that relates cohesion to internal party factors (e.g., Cox and McCubbins Reference Cox and McCubbins2005). Moreover, our analysis counters conventional wisdom that opposition is marginal to policy outcomes in majoritarian democracies, described by Powell (Reference Powell2006):
opposition parties can use their legislative forum to raise embarrassing questions in anticipation of the next election and may occasionally find procedural levers of influence. Nonetheless, no observer of usual policy-making processes in Britain or France can doubt that the ability of minority oppositions to shape policy in the interests of their constituents is usually extremely limited. (309)
Furthermore, we show that, contrary to conventional wisdom, cohesive government-versus-opposition voting can lead to greater moderation in policy outcomes. In particular, when the opposition adopts a strategy of outright rejection, outcomes are closer on average to the median MP position than those under sincere voting. Thus, although the institutions of “consociational” democracy allow for greater inclusiveness (Lijphart Reference Lijphart1977), the importance of voting strategies deployed by opposition parties in Westminster systems should not be discounted. Even though it is generally accepted that opposition parties can exert pressure on minority governments, our results suggest that they continue to do so when the government enjoys majority status.
This article is structured a follows: we justify our case selection before discussing and presenting analysis on our new data from the Scottish Parliament that confirms the robustness of government-versus-opposition voting in Westminster systems. We then present a simple model and results confirming the relationship between strategic voting and the institutional structure of Westminster. In the remainder of the article, we then consider alternative theories and extensions. Proofs and other technical details are found in Appendices A to E.
OUR CASE SELECTION
Although Westminster systems have features that make our analysis particularly pertinent—the relative absence of checks and balances on executive power means that the opposition is limited to the use of its voting strategies in order to yield influence—government-versus-opposition patterns are found elsewhere. There are, however, practical reasons of data availability—along with a desire to evaluate the relative, nuanced claims of competing alternatives—to keep the analysis more tightly focused. Although government-versus-opposition voting is a pervasive feature in different countries, it is possible that this empirical regularity evolved independently in each country rather than being related to a common set of institutions. Since government-versus-opposition voting is observed in different places and at different points in time, its emergence may be due to a common set of circumstances that can have an independent effect on the voting patterns in these parliaments. Moreover, even though such voting patterns may plausibly be related to the institutional features of certain democracies, the question remains: which of these institutional features are important determinants of government-versus-opposition voting? To analyze statements about necessary conditions for behavior, we want cases that present a particular pattern of variation on the “right hand side.” Specifically, and for various competing theories, we desire (at least) two cases that differ (only) on the claimed variable of interest, holding other potential confounders constant.
Data from the United Kingdom, the home of the Westminster system, provide just this. The Scottish Parliament shares with the assemblies in Wales and Northern Ireland both timing of its inception and a common, inherited, political culture; thus, we can exploit institutional variation between these countries to explore our hypothesis. To assess our main claim that a majoritarian executive is a requirement for the voting pattern in question, we can compare the Northern Ireland Assembly—which abandons this practice—to that of Scotland. To rule out (or rule in) alternative hypothesis about other institutional factors that may act as driving forces, we can compare and contrast different cases. To assess the effect of legislative domain, we can contrast the Welsh case—which has no budgetary powers—with that of Scotland. If we want to determine whether the behavior in question is driven by electoral considerations, then we can examine the House of Lords, where uniquely, membership is for life. Finally, relative to Westminster, the devolved assemblies are particularly interesting because some MPs are elected directly by their constituents, whereas others are elected from a party list. Thus, we can exploit this within-country variation to assess the importance of different electoral incentives in driving opposition behavior. Performing such analysis provides interesting insights that distinguish the particular institutional basis of government-versus-opposition voting from other factors. As we see, careful case selection allows us to provide concrete evidence that supports our claim that majoritarian control over agenda setting, rather than other institutional factors, explains the pattern of government-versus-opposition voting. We postpone such comparative analysis until the section dealing with alternative theories and the plausibility of our assumptions. In the next section, we introduce our main data for the Scottish case.
THE EMERGENCE OF GOVERNMENT-VERSUS-OPPOSITION IN SCOTLAND
Established in 1998, the Scottish Parliament is the devolved national, unicameral legislature of Scotland, which has 129 elected members each elected for a four-year term. Its ambit includes all Scottish matters not specifically “reserved” to the United Kingdom Parliament; in practice, this means that members may legislate in areas such as education, agriculture, health, local government, and justice. Indeed, ministers in Edinburgh have the same executive powers in these particular policy arenas as their counterparts in London enjoy for their portfolios. A comparison between the behavior of its members with that of members of the Westminster Parliament is instructive. Although most of the members of the newly elected parliament had not previously served in Westminster, the parties they represented were the same as those represented in the House of Commons. This allows us to compare party behavior in both legislatures at the same points in time.
However, there are important institutional differences between the two parliaments that allow us to draw conclusions about the likely cause of any variation in the behavior we find. Unlike its counterpart in London, the Scottish Parliament was designed, both architecturally and in terms of its institutional make-up, to avoid the adversarial nature of politics in Westminster. The crafters of the constitutional reform that brought to an end the period of history since 1707, by which all Scottish affairs were dealt with by Westminster, envisaged a devolved assembly that would work on more consensual lines. For example, the assembly itself was designed so that members of the Scottish Parliament (MSPs) sit in a semicircle rather than on opposing benches.Footnote 4 Perhaps more important, MSPs are elected under a mixed member proportional system: 73 constituency members are elected under “first past the post,” whereas a further 56 are elected under proportional representation from party lists in 8 regions. The first two governments comprised a coalition between the Scottish Labour Party and the Scottish Liberal Democrats.
Although the Scottish Parliament deviates from the classic model in important ways, many of the quintessential features of the Westminster democracy are intact. The chamber is unicameral and, although provisions are made for committee and individual members to introduce bills, the lion's share of parliamentary business involves the discussion and debate on measures introduced by the executive (Mitchell Reference Mitchell2000, 610–11). Thus, although the composition of parliament and the rules by which members are elected differ from those found at Westminster, the key feature of Westminster democracy—namely, the fusion of executive-legislative relations with agenda-setting power being given to the majority party—remains central to politics at Holyrood. Similarities in the behavior of the parties across these parliaments can then be related to this common institutional feature. In fact, although avoiding the confrontational politics of Westminster-style arrangements was the aim, a pattern of government-versus-opposition was evident from the outset (see Mitchell Reference Mitchell2000, 620). To show this, we begin by calculating the agreement between party A and party B as the proportion of times the majority of each party vote the same way (“aye” or “no”), dropping all divisions on which one or other of the parties had no members voting.Footnote 5 The “disagreement” between any two parties is then calculated as one minus the agreement score.
Figure 1 shows the parties in the three Westminster Parliaments from 1992 to 2005, and the first two Scottish Parliaments from 1999 to 2003 and from 2003 to 2007.Footnote 6 Each line represents a parliament, and each point a party in terms of its disagreement score relative to the Labour Party. Because, by definition, the Labour Party must agree with itself 100% of the time, its disagreement is zero, and that party appears to the far left. The party that disagrees with the Labour Party most often in each parliament is assigned to the far right of the line: in this way, the parliaments are easily comparable in terms of relative differences between the parties. The specific numbers listed in the graphic are the actual, absolute, disagreement scores with the Labour Party. Thus, the Conservatives are the furthest from the Labour Party in the 1997–2001 Westminster Parliament, disagreeing 91% of the time. A striking feature of these data is the position of the SNP: broadly aligned with the Labour Party in the 1992–1997 Westminster Parliament, when both are in opposition, but strongly opposed to the Labour Party in Scotland.
Parties Relative to One Another in “Agreement” Terms, Specific Numbers Are Actual, Absolute Disagreement Scores for Parties

The evidence suggests that despite their ideological profiles, parties play different roles depending on the parliament in question. Specifically, the Tories appear to be the most recalcitrant members at Westminster, whereas it is the Scottish Nationalists (along with the Scottish Socialists, who do not have seats at Westminster) who are the more antagonistic at Holyrood. These observations fit the notion that during this period the SNP was the main opposition party who opposed measures introduced by the Labour Party-Liberal Democrat coalition. The analysis suggests that the structure of government-opposition voting can be related to the institutional similarities between the Scottish Parliament and the Westminster Parliament.
Of course, although it is well known that “government-versus-opposition” voting is dominant at Westminster (Spirling and McLean Reference Spirling and McLean2007), it is plausible that roll call patterns at Holyrood are dictated by other dynamics. In particular, voting might, in fact, reflect underlying policy divisions. Because we do not observe exactly the same individuals voting in both parliaments and, moreover, because the precise institutional rules differ between parliaments, we need to investigate other factors that may underpin these voting patterns. In addition, our claim that the SNP agrees with the Labour Party in Westminster “x percent of the time” assumes that the parties vote cohesively. It is possible that some members are more or less aligned with their counterparts in other parties.
First, then, we explore the level of intraparty cohesion. In Table 1, we report the “Rice index,” denoted r, which attempts to capture the unity of a party on any particular vote (MacRae Reference MacRae1970; Rice Reference Rice1928). That is, r = 100|p − (1 − p)|, where p is the proportion of the party voting “aye” on the roll call. As can be readily seen, parties at both Westminster and Holyrood average a mean Rice score of more than 95%. Bearing in mind that this includes purported “free votes”, it seems safe to assert that party cohesion is as prevalent and robust in the Scottish Parliament as in the House of Commons. Indeed, with the exception of the Liberal Democrats at Westminster in 1992–97, the median value of the Rice index in every case is 100%.
Mean Rice Index Scores for Various Parties at Westminster and Holyrood

aScottish Socialists consist of one member in the first Scottish Parliament and thus receive a 100% Rice index score by definition. SNP, Scottish National Party.
Establishing that there is one predominant dimension to roll call voting and that dimension is “government-versus-opposition” is slightly less straightforward. We proceed by rank ordering members via the nonparametric optimal classification (OC) routine (Poole Reference Poole2000) and inspect the dimensions in terms of both substantive interpretation and goodness-of-fit. In Table 2, we report the proportion of votes correctly predicted from this procedure and the aggregate proportional reduction in error from the relevant dimension of model.Footnote 7 As with all such techniques, these numbers must (almost) always increase as the model becomes more complex; the key is to select a dimension number wherein an additional dimension is not “worth” the extra parameter. In practice, we see that a simple one-dimensional model predicts approximately 95% of the voting decisions correctly for both the first and second Scottish Parliaments.Footnote 8 Adding a further dimension allows us an improvement of just 4%. As a comparison, the equivalent figure for the House of Commons (1997–2001) is 99% and for the U.S. Senate (90th), a relatively low 84%. We thus settle for the single-dimensional fit and offer a substantive interpretation of this dimension.
Votes in Scottish Parliament Explained in One and More Dimensions

Table 3 reports the rank position (from 1 through 134) of each party by using the party leader's score as a proxy. In terms of Figure 1, the results are similar. Once again, we see the Labour Party and the Liberal Democrats at one end of the continuum, and the Tories and Greens somewhere between them and the Scottish Nationalists and Scottish Socialists. Given that the Labour Party—a traditional party of the trade unions—and the Scottish Socialists occupy opposite poles of the rank order with the right wing Conservatives between them, it is difficult to believe that we are observing a left-to-right phenomenon. An alternative is to regard this dimension as a Scottish independence continuum, with the Scottish Nationalists—who are actively campaigning for full political autonomyFootnote 9—at one end and the Labour Party, which opposes such moves, at the other.Footnote 10 The position of the Conservative Party scuppers this interpretation: unionists by name and nature, they opposed the original creation of the Scottish Parliament. We would thus expect them to appear at one end of the independence spectrum, but here they appear between the Labour Party and the Nationalists on this dimension.
Number of seats and Optimal Classification (OC) of First and Second Scottish Parliaments

For each parliament, the first row shows the number of members of (the Scottish) Parliament by party. The numbers in the second row are OC ranks of the leaders of the various parties. Both parliaments have a total of 134 members. MSP, member of the Scottish Parliament.
To summarize, our analysis suggests that parties in Scotland are extremely cohesive in their voting and, in terms of overall patterns of roll call behavior, “government-versus-opposition” is the order of the day. The pattern of government-versus-opposition voting is very different than what we would expect if MPs were voting along ideological lines, and this suggests that this voting is strategic. Moreover, the fact that there is institutional variation between the Westminster and Holyrood parliaments implies that this strategic aspect is related to the common institutional features of these parliaments. The key feature that links them is that the government agenda is implemented by the majority party, which operates without checks and balances.
A MODEL OF WESTMINSTER DEMOCRACY
The data suggest that a pattern of cohesive government-opposition voting is unlikely to arise due to preference-based voting alone and that a significant aspect of government-versus-opposition voting relates to strategic considerations that arise given the institutional infrastructure of Westminster democracies. The key institutional feature related to such voting patterns is the near monopoly of agenda-setting power enjoyed by the executive.Footnote 11 To provide microfoundations, we craft a simple “bare bones” model that captures this core element of Westminster democracies, combined with strong party discipline, and show how these ingredients relate to the voting strategies deployed by government and opposition forces.
Parliamentary Agenda and Party Structure. We begin with a parliamentary agenda that consists of a set of J independent policies. We assume that the policy space for each j ∈ J is unidimensional. As already stated, the main institutional feature of Westminster democracy is that the government agenda is implemented by the majority party. For most of our results, we concentrate on the case where the agenda setter on policy j is the median of the governing party on that policy, but the exact identity of the government representative who holds the agenda-setting power is of no consequence to our results. We write the proposal of the agenda setter on the jth policy as ψj.Footnote 12
We make a simple adaptation to the agenda-setting model of Romer and Rosenthal (Reference Romer and Rosenthal1978), which has been used to analyze majority party control over the agenda in congressional systems under different procedural rules (Cox and McCubbins Reference Cox and McCubbins2005). Analysis of these models focuses on the unique subgame perfect Nash equilibrium in which, given a proposal made by the agenda-setter, all players vote sincerely. The game we analyze is, in contrast, more suited to the Westminster scenario, where the government majority has strong agenda-setting powers; can block opposition amendments and curtail parliamentary debate via guillotine measures and programming of government bills; and, critically, where parties can commit to their voting strategies. As noted at the beginning of the article, empirical scholars of parliamentary settings have viewed the ability of parties to discipline their members as a distinguishing feature of such systems. Cox's authoritative study, for example, shows that party discipline emerged in the United Kingdom in the 19th century in tandem with increasing control over the agenda exerted by the governing majority. Our framework allows us to explore the implications of this commitment ability alongside the agenda-setting powers of the government. The critical aspect of our timing is that we assume that MPs can choose whether to bind themselves (e.g., invoke the party whip) to voting together before the proposal is made. This is, of course, equivalent to opposition members casting their votes before the government introduces its bill to the floor. In short, we treat the party whip as a “bridge-burning” device that is central to policy outcomes in Westminster systems.Footnote 13
To capture the basic party division in Westminster democracy, we begin by assuming a set m of MPs who belong to a governing party and a set n who belong to an opposition party. We assume that the governing party has a majority (i.e., m > n) and that parties are jointly exhaustive and mutually exclusive: all members belong either to the governing or to the opposition party, and no member belongs to both. We define a member as belonging to a party when, on average, her views on a particular policy coincide with those of an (average) member of her party. Thus, parties are formed of like-minded individuals. More formally, we assume that on each policy issue, the ideal points of members of the same party are independent and identically distributed (iid) draws from a (possibly common and known) continuous distribution. For example, for some of our simulations later in this article, we treat the ideal point of each member of the governing party on the jth policy as a draw from a normal distribution with the same mean and variance, and a member of the opposition party has a draw from a normal distribution with a different mean and (possibly) different variance. This assumption means that whereas ex ante backbenchers are homogenous, ex post they are heterogenous with respect to their ideal points on a particular policy. The uncertainty in payoffs is itself not important—what is important is that members can bind themselves to voting with their party once preferences on the real line are revealed (but before the proposal is brought forward).Footnote 14 However, the variance in members' ideal points across policies captures an important element of Westminster democracy, namely, that on some policies members of the opposition may find themselves more aligned with the government than with their fellow partisans. Somewhat surprisingly, and as we show, this feature of Westminster life is a critical ingredient toward cohesive government-opposition voting.
Voting Strategies. Given the parliamentary agenda, a voting strategy is a vector of votes for the ith member where the jth element of the voting vector corresponds to a binary decision—either “aye” or “no”—on a division over policy j. Some voting strategies are of immediate interest. With “sincere” voting, member i, with “ideal point” xij on the real line that forms the policy space of policy j, compares her utility from the jth status quo, which we write as xqj, with the utility she receives from the jth proposed bill. Assuming that utility decreases monotonically in the distance between a member's ideal point and the alternatives, then the member votes for the proposal if and only if  , where the weak inequality implies the imposition, with no loss of generality, of a tie-break rule whereby indifferent legislators back the proposal over the status quo. Another interesting case is where a member of the opposition votes “no” irrespective of whether this critical inequality is satisfied. This suggests that a member of the opposition strategically opposes a proposal that, in the event that it receives majority support, would provide her with a payoff higher than that attained when the status quo remains in place. The question we ask is: under which circumstances will MPs bind themselves to voting together? In the case of the opposition, such binding commitments can take a very stark form: they commit to voting against any proposal the government brings to the floor. We refer to such voting as “opposition” voting. Our main focus is on situations where MPs can bind themselves in the event where all members from their party are better off by so doing. That is, they bind themselves to a vote on a particular bill when the payoff to all members from doing so exceeds that attained from following a different protocol. Since all must agree to invoke the commitment device, a natural focus is on the Pareto-dominant Nash equilibria of the subgame that involves the agenda setter bringing a proposal to the floor before MPs cast their (final) votes.
Asymmetric Commitment versus Government Agenda-setting Power. Our framework allows us to explore the implications of party commitment alongside the agenda-setting powers of the governing party. We begin by establishing our main results for the case where the opposition has greater ability to commit to its voting strategies. In this sense, we think of commitment as a substitute mechanism that the opposition has available when the government is granted agenda-setting powers. As motivation for this example, we might consider that the government, which maintains a majority, must appeal to a broader coalition of voters than the opposition, which, by definition, is smaller in size and thus more compact. This would be the case, for example, where, as in the UK, many districts are partisan and won by landslides, whereas others are more closely fought contests. When the majority party has a relatively large share of MPs elected in close-run elections, they have less ability to discipline their members. The opposition, in contrast, when reduced to its core, has greater control over the actions of its representatives. We capture this distinction in stark form by assuming that the opposition can commit to a voting strategy, whereas the government backbenchers only ever vote sincerely. This serves as a useful theoretical exercise that helps us establish an interesting baseline result that shows that the ability of the opposition to commit to opposing government proposals can counteract the agenda-setting power of the government.
We illustrate this effect with a simple example in Figure 2 that depicts a single policy agenda: j = 1, m = 3, and n = 2. For this example, we order and label the members of the government by their ideal points g 1 < g 2 < g 3, and do likewise for the opposition so that o 1 < o 2. We assume that g 2 is the government agenda setter. The dashed line indicates ψj, her optimal proposal conditioned on different voting strategies deployed by the opposition, and the status quo SQ. The top row illustrates the optimal policy when the opposition opposes all government proposals, whereas the bottom row indicates the optimal policy when the opposition vote sincerely. Under an opposition voting strategy, the proposal must make the (right) pivot with ideal point g 3 indifferent between her voting strategies. In contrast, under sincere voting, the proposal must leave the median member o 1 indifferent between the status quo and the proposed policy. It is clear by inspection of Figure 2 that “opposition voting” leaves both opposition members better off than sincere voting. Moreover, given this opposition voting strategy, the government members can do no better than vote sincerely. Thus, although for these parameter values both strategies would be Nash equilibria of the subgame in which the government makes a proposal and MPs cast their votes, here the opposition would choose to bind themselves to voting against any government proposal.
Five-member Example

There are two critical features of this example. First, the status quo policy lies on the “opposition” side of the agenda setter's ideal point. In Figure 2, the agenda setter belongs to a “left” governing party, and the status quo is to the right of her ideal point. Clearly, when the status quo is to the left of the agenda setter's ideal point, then she can propose her own preferred policy and thus receive the support of her own backbenchers irrespective of the actions taken by the opposition. The second feature is that there is overlap in the ideal points of the government and opposition members. In Figure 2, the ideal point of the rightmost member of the governing party is to the right of the leftmost member of the opposition. When this is not so, then again the votes of the opposition are irrelevant to the final outcome because the agenda setter need only appeal to the government backbenchers. In Lemma 1 in Appendix A, we show that this result generalizes to all such policies.
Here, we focus on the main intuition. On any given bill, with a given status quo and government proposal, an opposition member can find herself in one of two situations: either (1) her vote is irrelevant to the final outcome because, given the government proposal, a majority of government members vote “aye”; or (2) her vote can influence the final outcome, and as a member of the opposition bloc, she votes against the proposal. The latter situation may arise when she finds herself in agreement with the government proposal under sincere voting, whereas some members who belong to the government majority are at odds with the proposed policy. In this situation, the optimal policy proposal (under sincere voting) makes the member strictly indifferent between voting for or against the government. If, in contrast, she strategically votes “no,” then the government must satisfy its recalcitrant government members. Such strategic opposition can induce a proposal that is more favorable to all opposition members; thus, if they could (and they can), then opposition members would bind themselves to voting in this way.
This example provides an illustration of behavior consistent with the stylized fact of cohesive government-versus-opposition behavior: the opposition votes cohesively; the government is cohesive; and, although the government supports the agenda setter's motion, the opposition does not. Several other features are interesting: the opposition votes against proposals that leave them better off than the status quo; and, finally, there are policy consequences of the opposition's action—the outcome is closer to the median preference of parliament than it would be under sincere voting. The more general insight is that strategic opposition can induce a proposal that is more favorable to all opposition members. In short, opposition voting counteracts the government's agenda power.
In our discussion, we have focussed on the comparison between “opposition” and “sincere” voting on a particular bill. As we have shown there are bills on which, if the opposition were faced with a choice between these options, they will bind themselves to use of the former. Of course, we must also consider other voting strategies—it is possible that there is another option between outright opposition and sincerity that yields a better outcome for all—and we do so in Proposition 1 in Appendix A, where we state our result more formally. There, we show that the equilibrium of our voting game for the entire parliamentary agenda, with asymmetric commitment, involves the opposition adopting a strategy that is a convex combination of “opposition voting” on some bills and “sincere” voting on others; in the former, the opposition binds its members to voting against any proposal; in the latter they are free from party discipline. We also show (Proposition 2) that for some range of the parameter space, this equilibrium is robust to deviations by coalitions of opposition members (technically, it is coalition proof).
Symmetric Commitment. Thus far, we have considered a situation where the opposition has greater commitment ability than the government. Although the government can bring take-it-or-leave-it policies to the floor, the opposition can then combine to counteract the government's agenda-setting power. As seen, the party whip is a particularly powerful tool for the opposition to wield because it brings them policy concessions that, in the absence of such a commitment device, they would be unable to attain. In light of this, it is useful to consider a world where the government has access to a similar commitment technology that it can use to buttress its agenda-setting power. We suppose that the government can also commit to its voting strategies in the event where, doing so, they make all members better off. The equilibrium of our game is robust to this adaptation. In short, regardless of whether the opposition chooses to bind itself to opposing all government policies, all combinations of proposals and government voting strategies must make at least one member of the government worse off than they would be under under sincere voting. As a result, the government cannot bind itself to do other than vote sincerely. We state this result formally in Proposition 3 in Appendix A. The intuition is, however, immediate from inspection of our example depicted in Figure 2. There, recall that the opposition opposes all government proposals. Then the final outcome lies within the Pareto set of government MPs ideal points. Thus, although commitment yields a Pareto improvement for opposition members, it can yield no such improvement for the government. Cohesive opposition voting underpinned by the development of stringent whipping can then be viewed as a prudent strategy in response to a government with agenda control that cannot best respond by using similar strategies. A conjecture is that such opposition strategies provide incentives for the governing executive to increase centralization of the legislative initiative (see Cox Reference Cox1987, ch. 6).
Other Forms of Commitment. We have yet to consider what happens when the government has commitment ability and the opposition has none, or when the government can commit to other voting strategies that do not yield Pareto improvements over those obtained by sincere voting. As seen, the strength of opposition voting hinges on the fact that, when the opposition votes against all government proposals, the government must appeal to their recalcitrant backbenchers by making a policy concession to them. Suppose, however, that the government could obtain a “yes” vote from some such members on policy proposals that, if realized, leave these MPs worse off on that particular bill than they would be under sincere voting. For example, returning to Figure 2, suppose that the agenda setter could obtain a policy closer to g 2. As shown by Huber (Reference Huber1996) and Diermeier and Feddersen (Reference Diermeier and Feddersen1998), if the government can credibly invoke the threat of a confidence vote procedure, under which they might lose their agenda-setting power, then they can extract policy concessions from their backbenchers.Footnote 15 If, on a given bill, the government has credible access to such a procedure, then, in our setting, the opposition would no longer be able to extract any gains through the use of their voting strategies. They may well oppose (or perhaps not), but either way there are no policy concessions to be had from so doing.
Opposition Voting in a Large Parliament. Our results show that a strategy involving outright opposition on some bills can yield dividends to the opposition. Here, we exploit a key element of our model—namely, that, on average, members of the opposition are in agreement with each other; thus, the average gains from use of their voting strategies should be similar. We explore how the magnitude of this advantage varies with different exogenous parameters: the distribution of ideal points, the size of the assembly, and the relative size of the government.Footnote 16 We proceed by making distributional assumptions on these key parameters and simulating roll call behavior in large parliaments.
Overlap and Strategic Advantage. Our main results confirm that the relationship between polarization and the advantage of strategic voting is nonmonotonic. In particular, if some members of the opposition are closer to the government agenda setter than to members of the government who would be decisive if the opposition vote strategically, then the incentives for strategic voting are undermined. Why is strategic voting dominant only when polarization takes intermediate values? The intuition is straightforward. If polarization is high, then the opposition is largely irrelevant to outcomes, and members of the opposition are indifferent between their voting strategies. If it is too low, then at least some opposition members find themselves in relative agreement with the government agenda setter and prefer to vote sincerely. We illustrate this result in Figure 3, which simulates a large parliament where 301 members belong to the governing party and a range belong to the opposition. On each policy j, the ideal points of the governing party members are drawn from a normal distribution with mean −1 and variance 2, whereas all opposition members’ ideal points are drawn from a normal distribution with a mean that varies between 7 and 11 at regular intervals. A status quo is generated as a single draw from a uniform distribution with a given maximum and minimum on the real line. For each mean value in the sequence, a total of twenty parliaments are simulated, each consisting of 1,000 bills.
Simulation Results, Assuming Government of Fixed Size (301 Members)

On the horizontal axis, we plot a measure of polarization that we term “overlap.” This is the proportion of opposition members whose ideal points are to the left of the rightmost member of the government divided by the size of the parliament. When this measure equals zero, the set of ideal points of government and opposition members are disjoint. In contrast, if overlap is 1, then, on average, there is no ideological distinction between the views of members of government and opposition. The (smoothed) curves on the vertical axis depict the payoff differential to the most moderate (most “left wing”) member of the opposition between adopting a sincere voting strategy and an opposition one when the proposal is endogenous to these voting strategies.Footnote 17 When the curve lies above zero, on average, the payoff of an opposition strategy for the most moderate member of the nongoverning party, and therefore all other members of the opposition, is higher than that of a sincere voting one. Each curve relates to a different size of opposition ranging from 100 to 300. The shape of the curves depicting the payoff differential follows the logic described previously: starting at zero overlap (complete polarization), the payoff differential is increasing, and it reaches a maximum at intermediate levels of polarization.
Strategic Voting and Policy Moderation. A related question concerns the impact of different voting strategies on the policy outcomes of the parliament. Under sincere voting, upon conclusion of the parliamentary agenda, and on each policy, the outcome will lie in the set of points between the ideal point of the agenda setter and the median member. Under strategic voting, all outcomes lie in the set of points bounded by the ideal point of the agenda setter and the government pivot. In both situations, the agenda setter exploits her role to induce outcomes that are as close as possible to her ideal point, and so the Condorcet outcome is chosen only in the rare case where the agenda setter has the median preference. A corollary of our main result is that if the opposition vote strategically, then outcomes can be closer to the outcome that would prevail under sincere voting. To illustrate, we simulated a large parliament as previously shown. We recorded, for every bill, the distance between the ideal point of the median legislator and the outcome under opposition voting minus the distance that emerges under sincere voting. We then took means. When this (mean) difference is negative, opposition voting yields outcomes closer to the median legislator than sincere voting does. Conversely, when this difference is positive, the outcome from opposition voting must be further from the median legislator (and thus the distance further) than that under sincere voting. Figure 4 displays our results for different opposition sizes and demonstrates a nonmonotonic relationship: the welfare improvement due to “opposition” voting initially increases with polarization, before decreasing as “sincere voting” becomes beneficial.
Simulation Results, Assuming Government of Fixed Size (301 Members)

Related Notions of Opposition. We end this section by briefly discussing how our results relate to other approaches to cohesion. An observational implication of our findings is that individually rational MPs cast in the role of opposition should vote as a bloc. In our account, they do so because, by cohesively opposing the government, they counteract its agenda-setting power. Our noncooperative and policy-based approach provides an alternative to that found in the cooperative literature. Straffin (Reference Straffin1997) adapts the Shapley index to show that a minority can increase their voting power through bloc voting. However, if the majority best responds (by also voting as a bloc), then the minority would exert more power (in the Shapley-Shubik sense) if there was no bloc voting. Of course, there are other theoretical reasons for bloc voting: Cox (Reference Cox1987, 66), argues that whipped votes were popular precisely because they provided MPs with a strong cue.
Discussion. Although cohesion has previously been understood as arising due to internal party pressures, we have shown that the distinct pattern of government-versus-opposition voting is due to strategic interaction between the backbenches. Opposition parties can use their votes to counteract the agenda-setting power enjoyed by the government. In particular, when the government has the power to make take-it-or-leave-it proposals to the floor of of the House, the opposition can extract policy concessions by adopting a stance of outright rejection of any government proposal. Such opposition, in turn, reinforces government cohesion. A surprising corollary to this result is that policy outcomes can be closer to the median preference of the parliament under strategic rather than sincere voting. The ability of the agenda setter to move outcomes away from those that would be implemented under the Condorcet procedure (in a unidimensional policy space) is mitigated by opposition strategies. Our analysis suggests that Westminster-type systems may not be as unrepresentative, or the role of opposition party members as marginal, as previously believed.
ALTERNATIVE THEORIES AND PLAUSIBILITY OF OUR ASSUMPTIONS
Thus far, we have shown that the basic pattern of government-opposition voting is consistent with what we would expect to find when the opposition adopts optimal voting strategies in Westminster democracies. New data from the Scottish Parliament and our theoretical analysis point to the conclusion that the pattern of government-opposition voting is related to the basic institutional features of Westminster democracies and, in particular, to the agenda-setting power of the majority party that forms the executive. In this section, we check the robustness of our findings by analyzing our underlying assumptions and by taking on board alternative institutional accounts of our data. In particular, we address the possibility that government-versus-opposition voting arises due to (1) electoral signaling, (2) incentives due to the electoral system, and (3) the different jurisdictions of the parliaments in question.
Analyzing Our Assumptions. Our results rely on two main assumptions: the ability of the opposition to credibly commit to their voting strategies, which we have already discussed; and the monopoly over agenda-setting power enjoyed by the government. Our key results depend on a further condition: namely, the existence of overlap in the ideal points of MPs.
Agenda-setting Control. Our analysis suggests that the opposition will adapt its voting strategies in the face of a government with powers to bring take-it-or-leave-it offers to the floor. Doring (Reference Döring2001) uses measures related to three indicators to assess the agenda-setting power of European national governments: the extent of the government's prerogative over bills, the relative autonomy of committees during parliamentary passage of a bill, and the structure of the parliamentary phase of budgeting. Among three countries deemed to have high agenda-setting powers is the United Kingdom, the paradigm case of the Westminster system (the others are France and Greece).Footnote 18 In Westminster systems, we find relatively few checks on executive power, and so agenda setting is a particularly potent weapon for the government. However, even in the absence of regional or other power centers from where they can wield influence, the opposition parties can still extract concessions via the voting strategies they adopt in the lower chamber. In fact, our analysis offers a different interpretation of one of the main findings in Doring (Reference Döring2001), namely, that countries that “rank highest in government control of the agenda, obviously pass more conflictual laws,” where the conflictual nature of a law is determined by the proportion of “no” votes. Our analysis suggests, instead, that opposition voting is a direct strategic response to the government's agenda-setting power, is not conditioned on the type of bills the government proposes, and can lead to greater policy moderation.
The Overlap Condition. A necessary condition for strategic opposition voting is the existence of overlap in the ideal points of government MPs and those of opposition members. This critical overlap condition is a very weak requirement. Nevertheless, empirically identifying this effect is not straightforward. This is because analysis of roll call votes conflates the ideal preferences of MPs with the strategic incentives they face to vote in particular ways. In particular, such votes reveal the pressures for conformity induced by the party whip. That said, we can look at a series of ostensibly “unwhipped” votes—whose status was reported as such in official Commons documentation (see House of Commons Library 2008)—and estimate a one-dimensional spatial model from them for all parties. We give details in Appendix D, but our key finding is that for 1997–2001 and then 2001–2005, approximately one third of the opposition party's MPs are located to the left of the most right-leaning government MP. Hence, to the extent that we can treat these roll calls as valid indicators of sincere latent ideological positions, overlapping preferences are an empirical fact.
Alternative Theories. We consider three alternative accounts of the government-versus-opposition pattern in our data.
Electoral Signaling. We begin by dealing with a (we believe) common view that cohesive government-opposition allows voters to demarcate parties in policy terms. That is, parties adopt such strategies to signal to the electorate that there is, in fact, “clear blue water” between government and opposition on the issues of the day. That is, although the opposition might prefer a particular government to the status quo, it still votes against it to signal general opposition and “difference” to the governing party.Footnote 19 Although the clear blue water hypothesis is, we believe, commonly accepted, it does not provide a convincing account of our data. In elections to Westminster that took place in Scottish constituencies, the main two-party races—in both 1992 and 1997—were between the SNP and the Labour Party. The same is true of elections to the Scottish Parliament. Thus, the clear blue water argument cannot plausibly explain both the Westminster and Holyrood agreement scores observed in Figure 1.
A more compelling argument against the electoral signaling account comes from analyzing data in assemblies that share the basic institutional features of our model but where electoral incentives are absent. Members of the House of Lords are not elected and are appointed for life. As a result, they have no individualized electoral incentives to vote strategically because they have nothing to gain from establishing a difference in policy position between their party and another. Figure 5 displays the results of a one-dimensional OC of the roll call data for the House of Lords in 2001–2005. As seen, the Labour Party is generally to the “left” of the cross-benchers and Liberal Democrats, who are to the “left” of the Conservatives. However, the identities of the ranked peers are instructive: Baroness Amos and Lord Williams—both leaders of the House of Lords during the period—appear to the “left” of their party (actually, they share the same rank). Meanwhile, Labour Party “rebels” such as Baroness Kennedy of the Shaws (see Russell and Sciara Reference Russell and Sciara2007, 307), and Lord Plant appear to the right of these government office holders. Of course, this makes little sense from an ideological perspective, yet is entirely in keeping with what we observe in the House of Commons (Spirling and McLean Reference Spirling and McLean2007): the one-dimensional classification is simply a rank order from most “progovernment” to most “antigovernment” (note that Margaret Thatcher, former Tory prime minister and Lord Strathclyde, the head of the opposition, appear far to the “right” on this plot).Footnote 20 The bottom line here is simple: with unified agenda control, but in the absence of individualized electoral incentives, voting takes a government-versus-opposition form.Footnote 21
OC for House of Lords

The historical record is also more consistent with our account. As early as 1766, contemporary parliamentarians such as Lord Rockingham were able to classify their colleagues in the House into a “government” and “opposition,” along with an approximately equal number of independents (Namier and Brooke Reference Namier and Brooke1964, 190–91). The opposition during the period was not a unified force, but rather a series of personalized (Whig and Tory) factions lead by aristocratic notables. Note that this is some 60 years before the first Reform Act of 1832, and thus there can be no notion that the parties—such as they were—offered alternative programs to woo voters in the constituencies. Indeed, relatively few districts were competitive in any sense: “rotten” boroughs—wherein the electorate was utterly controlled by local landowners—were common and typically elected two members to the legislature. Even as late as 1820, more than one third of the 558 MPs owed their positions to patronage rather than open contest (Thorne Reference Thorne1986, 44). Thus, a pattern of roll call behavior consistent with a government-versus-opposition divide substantially predates competitive elections and parties with well-defined and ideologically distinct appeals to voters.
Incentives Due to the Electoral System. As noted in our previous discussion of the Scottish case, the Holyrood Parliament differs from Westminster in that some Scottish Members of Parliament (SMPs) are elected under list Proportional Representation (PR). The fact that the list system appears to increase parliamentary representation for certain groups (Brown Reference Brown2000) might provide different incentives and lead one to expect differences in the voting behavior of MPs elected under this system. It is then plausible that differences in the behavior of elected Scottish representatives in Whitehall and Holyrood can be explained by differences in the electoral system. As a fillip to our argument that it is the institutional features common to both Westminster and Holyrood—namely, the control over the agenda that is enjoyed by a majoritarian executive—we compare the voting records of those SMPs elected under single member district (SMD) plurality, 73 in all, to that of the 56 members elected under list PR. In fact, and as explained in Tables 4 and 5 in Appendix B, we fail to reject the null hypothesis that the ideal points of the members from these different samples are drawn from the the same distribution; thus, there is no obvious difference between the behavior of list and SMD legislators within the same party.
Kolmogorov-Smirnov Test for Scotland

Null hypothesis is that list and SMD assembly members' estimated ideal points are drawn from the same distribution. A p > .05 implies that we fail to reject the null (i.e., list and SMD members behave similarly). SMD, single member district; SNP, Scottish National Party.
Kolmogorov-Smirnov Test for Wales

Null hypothesis is that list and SMD assembly members' estimated ideal points are drawn from the same distribution. A p > .05 implies that we fail to reject the null (i.e., list and SMD members behave similarly). PC, Plaid Cymru; SMD, single member district.
Differing Jurisdictions. A plausible hypothesis is that patterns in our data reflect the functional separation of policy domains. For example, although Holyrood and Westminster are similar in the structure of the executive, the jurisdiction of the parliaments is markedly different. To explore whether policy domain or executive structure can best explain the pattern of government-versus-opposition voting, we look beyond these parliaments to the assemblies of Wales and Northern Ireland. These assemblies are very similar in terms of their jurisdiction. They also share, to a large extent, a common inherited political culture that may have an independent effect of patterns of legislative behavior. However, and as we describe later, these assemblies are very different with regard to the structure of the executive.
Initially, the powers of the Welsh Assembly were simply those previously held by the Secretary of State for Wales, and there was no separate executive. In 2006, the new Government of Wales Act formally divided the legislative and executive, with the latter drawn from the former. But, even with the earlier arrangement, it was the Cabinet—rather than the committees—that played the key role in developing and introducing legislation for consideration (Laffin and Thomas Reference Laffin and Thomas2000).Footnote 22 Hence, the agenda-setting role we allude to in our model holds for the executive in Wales.Footnote 23
In contrast, the Northern Ireland Assembly, although similar in terms of policy domain to the Welsh Assembly, was designed with “consociational” (in the sense of Lijphart Reference Lijphart1977) principles in mind, and the legislature has various features that make it very different to the House of Commons. In Northern Ireland, in contrast to Westminster, Scotland, and Wales, agenda-setting power is not controlled by a majority. The Cabinet is necessarily drawn from both unionist and nationalist communities with specialized procedures for allocation of portfolios (see O'Leary, Grofman, and Elklit Reference O'Leary, Grofman and Elklit2004). Following the 2007 election, the parties included in government were represented by more than 90% of the members. Moreover, in Northern Ireland, the planned roll call agenda is subject to special voting procedures that require “parallel consent” and “weighted voting” to account for preferences on both sides of the constitutional divide (Wilford Reference Wilford2000, 581). This is combined with a strong (and diverse by composition) committee system and a mutual veto for some matters. In short, in Northern Ireland, in the absence of majority control of the agenda, and with several checks and balances on executive power, we would not expect strategic “opposition” voting at division time.
Figure 6 presents the OC of Welsh roll call votes for the first (1999–2003) and second (2003–2007) meetings of the assembly.Footnote 24 A single dimension correctly predicts more than 97% of the votes in both periods. On this dimension, Plaid Cymru, the Welsh nationalists, appear to the “right” of the ruling Labour government. This cannot represent an ideological scaling because Plaid Cymru are to the left of the Labour Party and the Liberal Democrats on socioeconomic issues, and furthest from the Conservatives on matters of constitutional reform. In fact, their placement is as we would expect according to government-versus-opposition voting, and this is in keeping with qualitative accounts of recent Welsh parliamentary history (McAllister Reference McAllister2000). A further justification for our claim is given by examining the specific position of John Marek, a left wing Labour rebel who was deselected by his party after criticizing its policies as being unduly conservative. Notice that Marek moves “right” in the OC plots: a relocation that makes sense only if we regard the scaling as reflective of government-versus-opposition. That is, Marek's true ideological position is to the left of the Labour Party; yet, his scaled position is to the right because he now opposes its proposals. The Welsh case thus confirms that strategic opposition voting emerges in legislatures outside Westminster and Holyrood, given the basic institutional apparatus of an executive able to control the agenda (and some mild conditions imposed on preferences of members).
Scaling of the Welsh Assemblies: Government-versus-opposition

Figure 7 shows the data from the Northern Ireland Assembly. The first subfigure refers to an OC of roll calls during the period 1999–2002, after which the assembly was suspended. The second subfigure is then the period from the 2007 elections through to June 2008. In the prior period, the Ulster Unionists (UUP) and the nationalist Social Democratic and Labour Party (SDLP) were the largest two parties and earned the first and deputy first minister slots. In the next period, the Democratic Unionist Party (DUP) and Sinn Féin (SF) took those roles. The other major parties were also, by constitutional construction, included in the Cabinet. If our analysis is correct, then we should no longer expect (larger) parties to consider themselves out of power at any particular time, and in the absence of “opposition,” we would expect parties to vote along ideological lines. Figure 7 demonstrates this pattern: in the upper portion, the coalition of the UUP and SDLP appears in the middle of the one-dimensional scaling (which correctly predicts 95% of the votes), whereas the DUP and SF (who did not possess the top positions at this time) disagree more often with the coalition and, crucially, one another. In the second plot, we see the same pattern with the requisite identities reversed: now the DUP and SF form the center of the dimension (again, a single dimension predicts 95% of the votes correctly). Thus, although the pattern we observe in these figures reflects subtle differences in the make-up of the executive at different times, we do not observe anything equivalent to government-versus-opposition voting.
Scaling of the Northern Irish Assemblies: Government-versus-Opposition Pattern is Absent

In sum, the pattern of voting in the Welsh Assembly conforms to what we should expect given the unified control of the agenda by the governing majority. Removing this necessary condition for strategic opposition voting—that of unified agenda-setting power for the executive—leads to the converse prediction: the scaling of roll calls should no longer reflect a government-versus-opposition dynamic. Data from the Northern Ireland Assembly suggest the hypothesis is correct: in the Northern Ireland Assembly, with its “shared” executive, the government-versus-opposition pattern disappears. Thus, constitutional variation in the new assemblies introduced under the New Labour constitutional reforms can account for differences in the voting patterns of these assemblies. The evidence refutes the claim that government-versus-opposition voting is related to differences in policy domain (or that it arises as an “indigenous” aspect of politics in the British Isles).
IMPLICATIONS WITHIN AND BEYOND WESTMINSTER
Within parliamentary systems that provide strong agenda-setting powers to the government, the ability of the opposition to extract policy concessions via their voting strategies might vary according to the structure of the party system. We use the illustrative case of a single-party majority government with single-party opposition. Clearly, our findings extend directly to parliamentary situations where the government and/or opposition contains multiple parties and, in particular, to the case where the ideal points of government and opposition MPs lie, on average, at either side of a single cut point (that may, for example, distinguish a left voting bloc from a right voting bloc). If these conditions are not met, for example, where opposition parties can be found either side of the governing party, then we should still observe strategic opposition voting. Then, whereas it would not be possible for each opposition party to simultaneously extract policy concessions on the same policy dimension, each party would extract concessions on different bills. However, even in this case, if one party were the main party of opposition, and the status quo policies are, on average, closer to the ideal points of their MPs than to those of the government, then a strategy of outright opposition to the government will yield dividends to the minority.
Our focus has been on Westminster systems with their fusion of executive and legislative powers and majoritarian control of the agenda combined with strong party discipline. As shown by Hix and Noury (2008), government-versus-opposition voting is most prominent in Westminster-style systems but also observed elsewhere. It is possible then that our insights carry over to other parliamentary systems. Indeed, in many non-Westminster parliamentary systems, agenda setting is controlled by a minimal winning coalition and strong party discipline exists: thus, majoritarian control of the agenda should also give rise to strategic opposition. However, in non-Westminster systems, the role played by opposition voting strategies may be countered by other constitutional checks and balances; these issues remain ripe for further exploration.
CONCLUDING COMMENTS
Using new evidence from the first two Scottish Parliaments between the years 1999 and 2007, and comparing and contrasting it with evidence from the Westminster Parliament, we challenged the view that cohesive government-versus-opposition voting patterns can be explained by similarity of preferences within and between the government and opposition ranks. By exploiting the institutional variation between Westminster and Holyrood, we showed that government-versus-opposition voting can plausibly be linked with the key institutional similarities of these systems, namely, the procedural rules for reaching collective decisions in Westminster systems in which agenda-setting power is given to the majority party. Our formal analysis reveals that strategic opposition is central toward explaining the cohesive nature and distinct pattern of government-opposition voting. The opposition can gain by adopting “just say no” strategies that counteract the government's control of the agenda. Doing so reinforces the cohesion among government backbenchers, and the end result can be greater policy moderation. Our insights challenge conventional wisdom that the opposition is marginal to policy making in Westminster democracies.Footnote 25
APPENDIX A: FORMAL RESULTS AND PROOFS
To show our main results, we introduce some basic notational definitions. Recall that, on each policy, the government members’ ideal points are iid draws from a (common and known) distribution. With no loss of generality, we suppose that the government is the “left” party. Now suppose that, on each policy, we order each government member according to their ideal points on that policy from the leftmost to rightmost government member. We define  as the ideal point of the leftmost member of the opposition on the jth policy. Adopting Krehbiel's terminology, we define the government's (right) pivot on policy j as the member with ideal point x ‡j such that there are exactly (m + n)/2 government members with ideal points less than (i.e., to the left of) x ‡j.Footnote 26 We define ψ‡j as the policy proposal that leaves this pivot strictly indifferent between voting “aye” or “no” when voting sincerely. Finally, we define x †j as the preference of the median member of parliament and ψ†j as the policy proposal that leaves her strictly indifferent between her actions under sincere voting. We write ψj as the proposal made by the agenda setter of the majority party on the jth policy and refer to the status quo position, which remains in place if the government proposal does not achieve majority support, as xqj.
Asymmetric Commitment. The main case we explore involves asymmetric commitment. On any bill, the opposition can bind itself to vote in a particular way if, by so doing, their MPs can attain higher payoffs. We begin by showing that on some bills opposition MPs will commit to using a voting protocol in which members do not vote sincerely. We do this by showing that on these bills sincere voting is Pareto dominated by “opposition” voting in which opposition MPs vote “no” on all proposals. Our analysis focuses on the interim, after ideal points have been realized but before the agenda setter makes a proposal.
Lemma 1. Suppose that the parliamentary agenda consists of a single policy and that (1) xq > x †, (2)  , and (3)
 . There is a Nash equilibrium in which the opposition members always vote “no” and government members vote “aye,” and then the expected payoffs from this strategy to members of the opposition are higher than those obtained when all members vote sincerely.
Proof of Lemma 1. The key policy outcomes are ψ† and ψ‡: the first occurs when all vote sincerely, and the second when opposition members oppose all proposals. It is straightforward to show that if conditions (1) and (2) hold, then ψ‡ ≥ ψ†. We need only show that the posited profile is an equilibrium and that the opposition member with ideal point  receives a higher payoff from this equilibrium than one in which all vote sincerely. Under the posited profile, MPs from the governing party vote “aye,” the opposition vote “no,” and the policy outcome satisfies ψ‡ = |2x ‡ − xq|. Since, by definition of ψ‡, the right pivot is indifferent between her actions she has no incentive to deviate; all government members for whom xi < x ‡ strictly prefer the proposal to the status quo and have no incentive to deviate either; fixing these voting strategies, the bill then passes, all other MPs xi > x ‡ are indifferent between their voting strategies, and thus none have an incentive to deviate. So, we show that all government members voting “aye,” all opposition members voting “no,” and the agenda setter proposing ψ‡ forms a Nash equilibrium. Suppose that the opposition instead vote sincerely, then the agenda setter can do no better than making the median MP indifferent between her voting strategies and thus ψ† = |2x † − xq|. Suppose that ψ† ≠ ψ‡ that conditions (1), (2), and (3) hold, and that, contrary to our claim, this equilibrium yields a higher payoff to members of the opposition than obtained in equilibrium when all opposition members vote “no” on all government proposals. In particular, it must then yield a higher payoff to the leftmost member of the opposition. But this can only be the case if
 , which contradicts the premise. ■
We have shown that on some bills the opposition will not vote sincerely. Moving further, we characterize the equilibrium for the whole parliamentary agenda:
Proposition 1. For a parliamentary agenda  , d ≥ 1, the equilibrium involves the opposition voting “no,” irrespective of the government proposal, on some bills and voting sincerely on others. The equilibrium has the following form: for any j , if (1) xqj > x ‡j; (2)
 ; and (3)
 then (a) all government members vote sincerely and in favor of the agenda setter's proposal; (b) all opposition members vote against the government on each bill; and (c) the government proposal satisfies
 ; if (1), (2), or (3) do not hold, then the government proposal makes the median member, whether a member of the government or the opposition, indifferent between voting “aye” or “no;” thus, ψ†j = |2x †j − xqj|, and all MPs vote sincerely.
Proof of Proposition 1. The strategy calls on opposition members to vote sincerely unless the conditions in Lemma 1 are satisfied, in which case they oppose all government policies. Recall that on each policy the members’ ideal points are iid draws from a distribution with positive support. Thus, for a given parliamentary agenda, there is a strictly positive probability that the agenda includes a policy such that the conditions in Lemma 1 are satisfied. On such policies, the interim utility from opposing all policies exceeds those from voting sincerely as shown previously. Starting from the subgame where the agenda setter introduces her proposal, “opposition” voting Pareto dominates sincere voting. Since we can therefore rule out sincere voting on these bills, the opposition will bind themselves (to a different voting protocol) on such bills. We make a stronger claim that the opposition will commit to the voting profile described. For this to be so, it must be that such a strategy yields a Pareto improvement over all other voting strategies in the subgame, starting with the agenda setter's proposal. In principle, this is a hard claim to prove since we must check a very large number of different strategies. We take a simpler route. A Pareto improvement must involve an outcome that lies outside the Pareto set of opposition members ideal points. We know that when conditions (1) and (2) hold, then ψj ‡ ≥ ψj †. Moreover, condition (3)  . Since if
 , then no outcome can be Pareto improving; our claim can only be false if, given some voting strategy deployed by the opposition, a Pareto improvement exists and
 . Then, for example, the outcome
 would yield a Pareto improvement. Suppose that the opposition could bind themselves to such a voting strategy that, given the agenda setter's best response, yields this outcome. We leave this voting strategy undefined but—since the best policy opposition members can achieve by all opposing on that particular bill is ψ‡j—it might involve a combination of complicated votes across different bills. However, ψ′j > ψ‡j implies that the agenda setter is worse off when the final policy outcome is ψ′j, and so she prefers outcome ψ‡j. Moreover, given our assumption of sincere voting by government members, she can always attain her payoff from introducing ψ‡j by bringing this proposal to the floor, where it will pass with the support of her own backbenchers. We conclude that, if there were a voting strategy that yields a Pareto improvement to opposition members, then this cannot form part of a Nash equilibrium. The only voting strategy the opposition can commit to then is the one described, and in the equilibrium, they will vote along these lines. ■
Note on Proposition 1. We have used the Pareto criterion to select among the multiplicity. Perhaps a different selection criterion is more appropriate? Bernheim, Peleg, and Whinston (Reference Bernheim, Peleg and Whinston1987) suggest that in selecting equilibria, the Pareto criterion should be applied not to the set of all Nash equilibria, but instead to those equilibria that are coalition proof. This entails that the equilibrium should be robust not only to deviations by individual players (members), but also to deviations by (any) coalitions of players; and that these deviations should themselves be robust to further sub-deviations, which in turn should be robust to finer deviations. (A related concept that does not rely on such a recursive structure is Strong Nash equilibrium.) The justification for using this particular refinement here is that we may have ruled out a voting strategy that, although not better for all, could be better for some members of the opposition party. Whereas previously we allowed the opposition to invoke the party whip only on bills where all opposition members could be made better off when they voted “no,” here they can do so only when there exists no faction, of whatever size, that could do better by following a different voting strategy. In principle, once again, this is hard to show: there are many voting strategies and (now) many different coalitions. Nevertheless, we can make progress by focussing on particular outcomes.
Proposition 2. Suppose that the opposition can invoke the party whip on a bill to enforce a “no” vote only when there exists no faction of opposition members who would do better by voting “aye” on that bill. For a parliamentary agenda  , the equilibrium involves the opposition voting “no,” irrespective of the government proposal, on some bills and sincerely on others. The equilibrium has the following form: for any j , if (1) xqj > x ‡j, (2)
 , (3)
 , and (4)
 then (a) all government members vote sincerely and in favor of the agenda setter's proposal; (b) all opposition members vote against the government on each bill; and (c) the government proposal satisfies ψ‡j = |2x ‡j − xqj|; if (1), (2), (3), or (4) do not hold, then the government proposal makes the median member, whether a member of the government or the opposition, in different between voting “aye” or “no,” thus, ψ†j = |2x †j − xqj|, and all MPs vote sincerely. If the opposition is more restricted in the use of the party whip, then it will adopt “opposition” voting on fewer bills.
Proof. The proof follows the same steps as used in Proposition 1. We first show that there are some bills on which the opposition will not vote sincerely. If (1) and (2) hold, then ψj ‡ > ψj †. Now if  , then it is also the case that there is no coalition of opposition members, of any size, who receive a higher payoff in an equilibrium where they vote sincerely rather than following the prescribed profile. To see why, note that the profile calls on all opposition members to vote “no” on a bill if conditions (1) and (2) are met and if the leftmost member of the opposition, with ideal point , is at least indifferent between her actions. However, when this is so, all members with ideal points
 strictly prefer to vote “no” also. It remains to show that there is no strategy other than the one described that is preferred by any faction of opposition MPs. Since
 , there exist policy outcomes ψj > ψ‡ that would be preferred by a coalition of opposition members. One such policy is
 . However, such outcomes can never be realized in equilibrium. Since government members vote sincerely, the agenda setter can always obtain her payoff from policy outcome ψ‡ by bringing a proposal that leaves the government's pivot indifferent between voting “aye” or “no.” Thus, all government members vote sincerely, and so this proposal will pass. The final part of the proposition contrasts outcomes with those obtained in Proposition 1. This follows because it is possible that conditions (1), (2), and (3), which are the same as those used in the previous result, are met, but that there exists a coalition of opposition members who by voting differently could attain a preferred outcome
 if such a proposal were made; then the requisite proposal will be made by the agenda setter. ■
Symmetric Commitment. We now suppose that both the government and the opposition can bind themselves to a voting protocol on a bill if, by so doing, their MPs can attain higher payoffs. In the absence of such a Pareto improving strategy, we restrict them to voting sincerely.
Proposition 3. Suppose that both the government and the opposition can invoke the use of the party whip when doing so yields higher expected payoffs for their members, then the government votes sincerely and the opposition uses the strategy described in Proposition 1.
Proof of Proposition 3. Under the posited profile, on any policy j, the outcome is either ψ†j or ψ‡j. The former occurs when one of conditions, (1), (2), or (3), in Proposition 1 is left unsatisfied, and so the strategy calls on the opposition to vote sincerely. Suppose that the government could commit to its voting strategies and that there were some combination of proposal and votes that yielded a policy outcome less than ψ†j. This must leave the median member worse off. Either the median is a member of the government or there must be a government member to the right of the median who is also worse off. Any outcome involving ψ > ψ†j can never be part of an equilibrium since the proposer prefers ψ† and thus has a profitable deviation. The more difficult case is when conditions (1), (2), and (3) hold; then the equilibrium policy outcome is ψ‡j, which by definition makes the government “pivot” indifferent between her actions. Any policy outcome ψ < ψ‡j must, by definition, make at least one member of the government worse off. Following the preceding logic, no outcome ψj > ψ‡j can be part of an equilibrium. Thus, in equilibrium, the government votes sincerely because it cannot bind itself to do otherwise, and the opposition best responds by using the strategy described in Proposition 1. ■
Note on Proposition 1. If the opposition has use of the party whip, then the outcomes will correspond to those described in Proposition 1 and our previous results continue to hold. The argument is not watertight. We restrict the government to using sincere voting in the absence of a Pareto improvement; however, if this were not the case, then, although there would still be an equilibrium in the form of that described previously, it would not be unique.
APPENDIX B: BEHAVIORAL SIMILARITY OF LIST AND SINGLE MEMBER DISTRICT MEMBERS IN SCOTLAND AND WALES
Writing the list members of the party p as p l and the SMD members as ps, we proceeded as follows:
1. We estimated a one-dimensional Bayesian IRT model (see Jackman Reference Jackman2008) on these data (10,000 iterations of the sampler, 5,000 iterations as burn-in).
2. We extracted the ideal points for each party p, and compared the distribution of pl's ideal points and ps's ideal points via a two sample Kolmogorov-Smirnov test in which the null hypothesis is that the sets of ideal points for list and SMD members in p are drawn from the same distribution.
Our results are as reported in Tables 4 and 5, where we also report the numbers of legislators in each group and at each time in our sample. Note that, in every case given here, for every parliament, the null hypothesis that pl and ps are drawn from the same distribution cannot be rejected. That is, there is no obvious difference between the behavior of list and SMD legislators within the same party when it comes to roll call voting.
APPENDIX C: OPTIMAL CLASSIFICATION OF THE WELSH AND NORTHERN IRISH ASSEMBLIES
For Wales, our reported OC of legislators was constructed in the following way:
1. Our roll call matrix for the assemblies was constructed from the official reports of daily activity (“Records of Plenary Proceedings”) in the legislature at www.assemblywales.org/bus-home/bus-chamber/bus-chamber-first-assembly.htm and www.assemblywales.org/bus-home/bus-chamber/bus-chamber-second-assembly.htm.
In particular, we used Perl in conjunction with regular expressions to pull the votes from the pdf files and compile them to a matrix with rows as (uniquely named) legislators and columns as items on which they were voting.
2. We fitted an OC in one dimension, in the sense of Poole (Reference Poole2000) using software from Poole et al. (2009) with standard defaults (a minimum of 20 votes for each legislator, with 2.5 set as minimum acceptable standard for “lopsided” votes).
For Northern Ireland, we filled a Freedom of Information (FOI) request and received the relevant matrix of roll calls from the FOI Officer at the Northern Ireland Assembly. These cover the period July 1998–June 2008, although for much of that time the assembly was suspended (2002–2007). Our specification for the OC scaling was as reported for the Welsh case.
The full key for Figure 7 is as follows: Democratic Unionist Party (DUP), United Kingdom Unionist Party (UKUP), Ulster Unionist Assembly Party (UUAP), Northern Ireland Unionist Party (NIUP), Ulster Unionist Party (UUP), Popular Unionist Party (PUP), Alliance Party (Allce), Social Democratic Labour Party (SDLP), Northern Ireland Women's Coalition (NIWC), Sinn Fein (SF), Green Party in Northern Ireland (Greens), Independent Health Coalition (IHC).
APPENDIX D: EMPIRICAL CONDITIONS: ANALYSIS OF FREE VOTES AT WESTMINSTER
Our analysis requires that the status quo lie to the right of the agenda setter's ideal points on some policies. Although from a statistical perspective, it is not generally possible to precisely measure where the status quo for policies lies. Nonetheless, it is reasonable that governments in Westminster systems will predominantly move policy “down” the real line toward their ideal points. Certainly, this is true of the Scottish Parliament where the Labour Party and the Liberal Democrats sought to reverse policies implemented during 18 years of Tory dominance at Westminster. In addition, we require “overlap.” Although calculating the precise degree of overlap in MPs' views in the House of Commons is difficult, almost all roll calls are subject to reasonably strong “whipping,” meaning that “sincere” (latent) preferences are rarely recorded at division time (Spirling and McLean Reference Spirling and McLean2007), and even when votes are ostensibly “free,” mild party-based pressure may still be applied (McLean, Russell, and Spirling Reference McLean, Russell and Spirling2003). Nonetheless, we obtained a rough estimate by proceeding as follows:
1. Using a report from House of Commons Library (2008, 6), we obtained a list of roll calls that “had been announced as being a free vote for Labour, Conservative and Liberal Democrat Members” for the first and second Blair parliaments: 1997–2001 (15 free votes) and then 2001–2005 (65 free votes).
2. We matched these roll call names to voting data provided by Firth and Spirling (Reference Firth and Spirling2005).
3. We estimated a one-dimensional Bayesian IRT model (see Jackman Reference Jackman2008) on these data (25,000 iterations of the sampler, 5,000 iterations as burn-in).
4. We then report the “overlap” between nongovernment parties' ideal points O and the governing Labour Party G as the number of individuals in the opposition whose estimated ideal points were smaller (to the “left of”) the most “right wing” government MP. We write the vector of these individuals' ideal points as o and denote the number of such individuals as |o|. Thus, our measure is
Note that we assume free votes for the three main parties, which comprise 95% of the seats in the Commons, are also free votes for the minor parties.

In Table 6, we record the overlap between the governing party and (1) the main, Conservative, opposition party; and (2) all opposition parties. As seen, these proportions are around one seventh and one third, respectively. We indicate the most “right wing” Labour MP in both periods is Kate Hoey, who is well known as a supporter of fox hunting—an unusual position for a Labour MP, but common among Conservative members. In Figure 8, we display the overlapping densities from the ideal point estimation of 1997–2001, and 2001–2005. The density with the solid outline that peaks to the left of the plot is that of the government; the other density peaking on the right refers to the ideal points of the opposition. Of course, with just 15 and then 65 roll calls to estimate the positions of more than 650 MPs, we cannot claim any particular precision for our findings. Nonetheless, the notion that there is overlap in at least one policy dimension—roughly estimated—is apparent.
Overlap at Westminster: 1997–2001, 2001–2005

Ideal points estimated via Bayesian IRT model.
House of Commons: Empirical Overlap of Ideal Points

APPENDIX E: OPTIMAL CLASSIFICATION OF THE HOUSE OF LORDS
Our reported OC of legislators was constructed in the following way:
1. Our roll call matrix for the 2001–2005 parliament was provided by The Public Whip, www.publicwhip.org.uk.
2. We dropped bishops (who vote very rarely anyway) and fitted an OC in one dimension, in the sense of Poole (Reference Poole2000) using software from Poole et al. (2009) with standard defaults (a minimum of 20 votes for each legislator, with 2.5 set as minimum acceptable standard for “lopsided” votes).
3. In reporting, we dropped seven Lords not attached to the main groups (including the cross-benchers): Lord Beaumont of the Green Party, Lord Stoddart of Swindon (Independent Labour), and five others (Lords Dearing, Fitt, Grenfell, McAlpine, and Young).

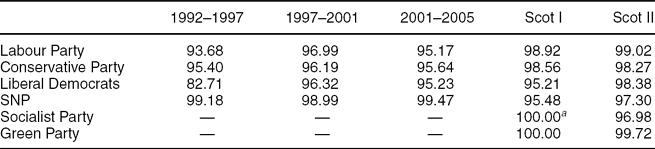

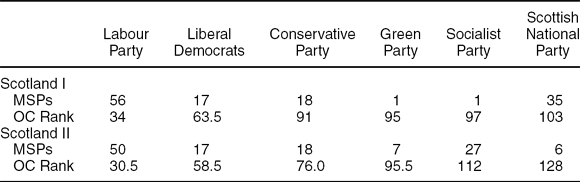
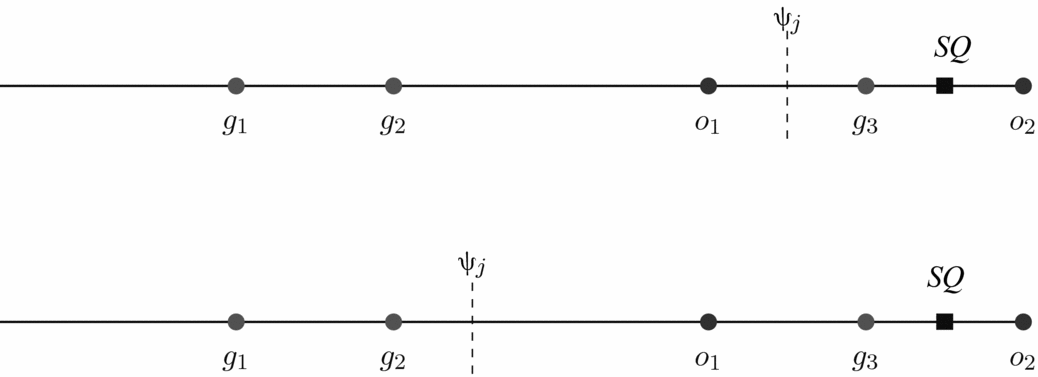
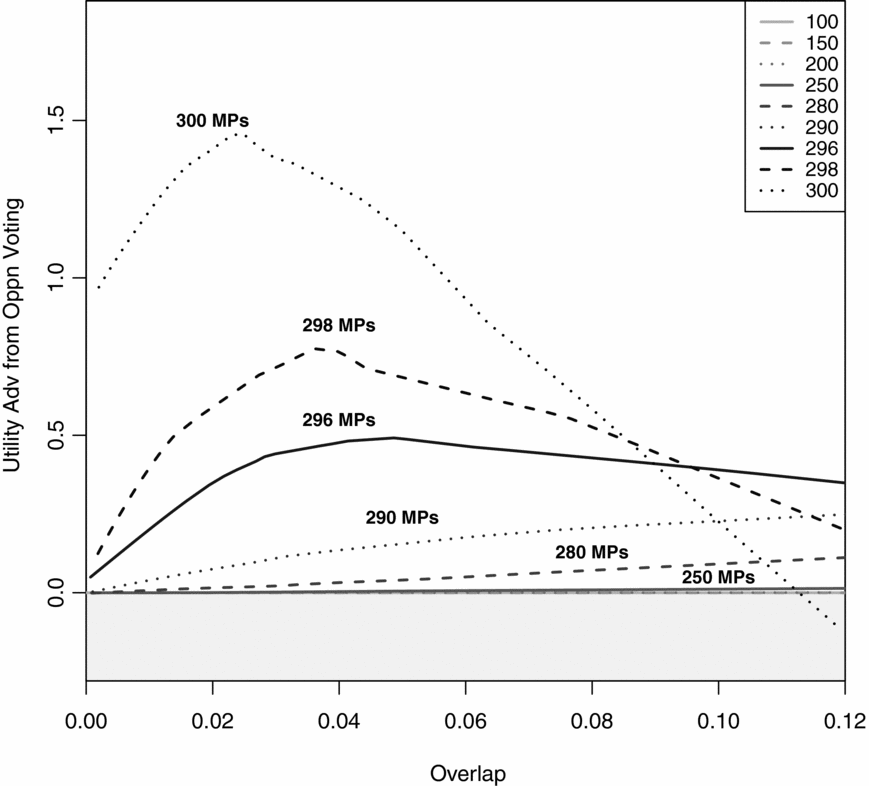
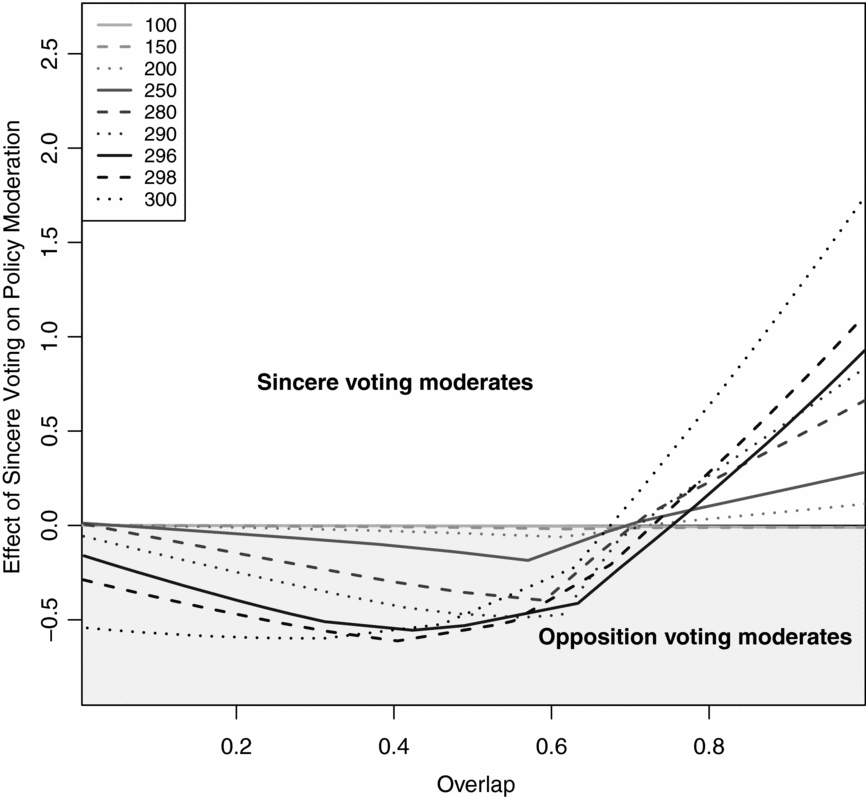
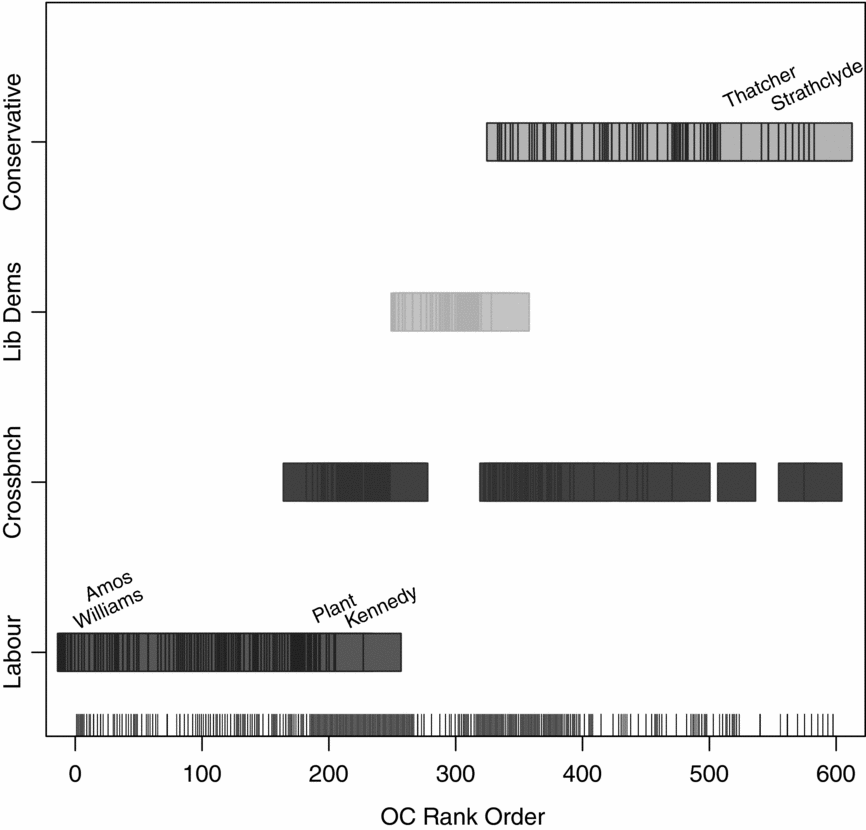
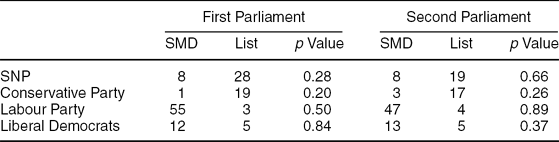
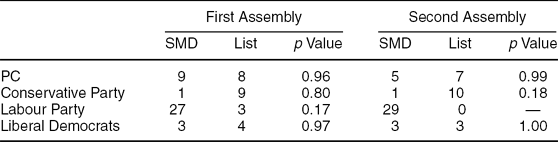
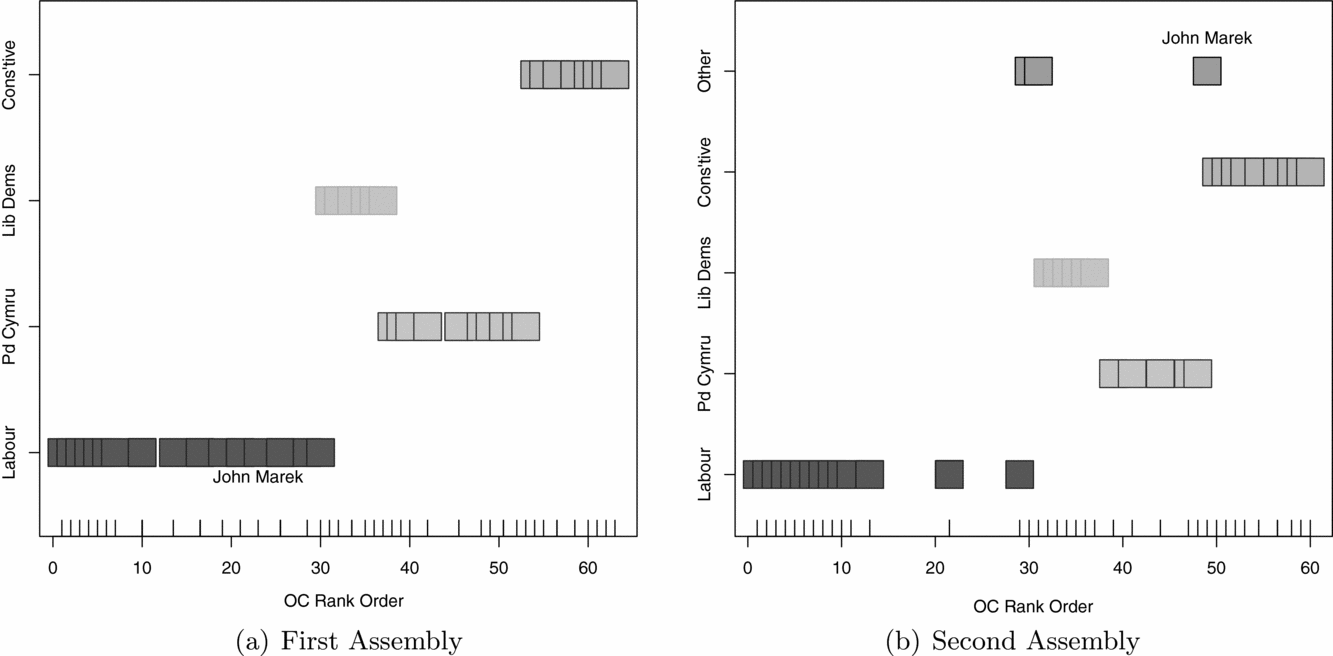
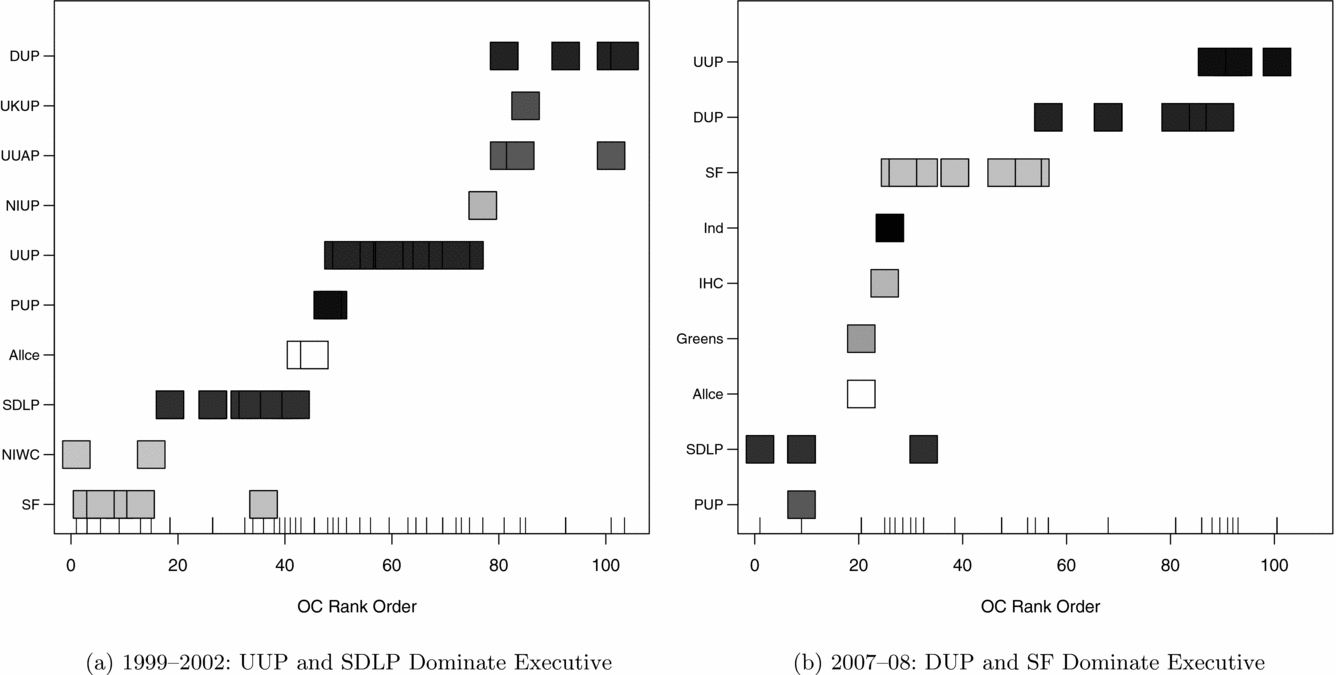
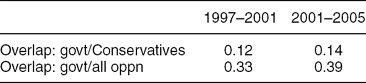
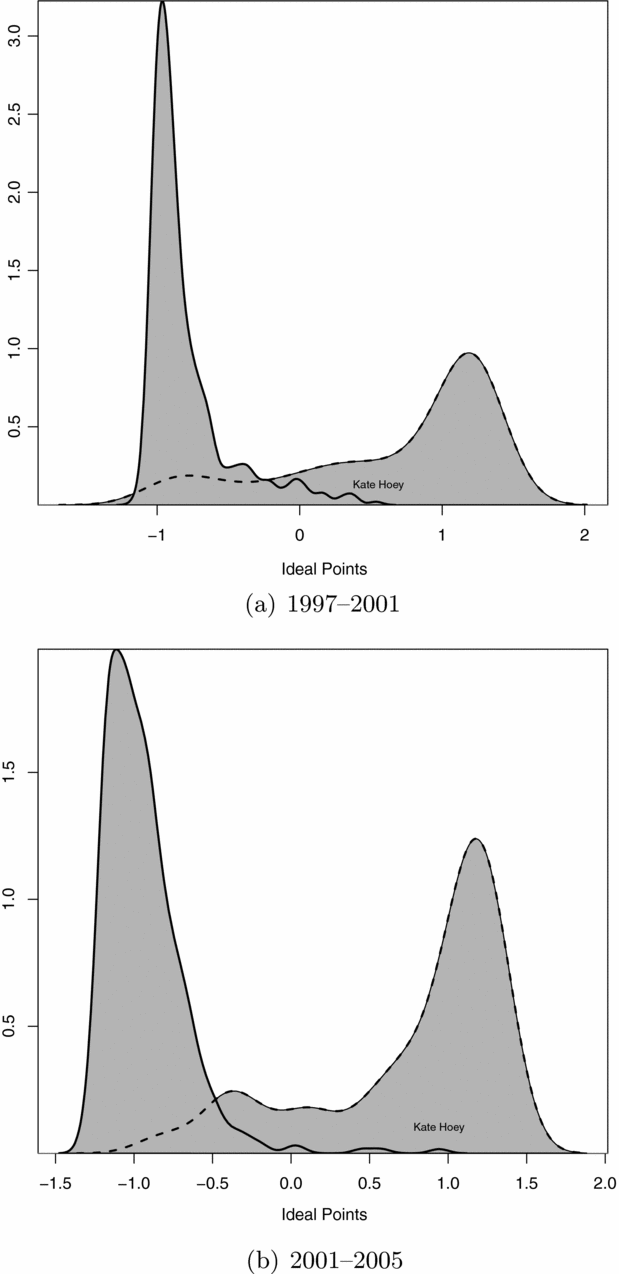



Comments
No Comments have been published for this article.