

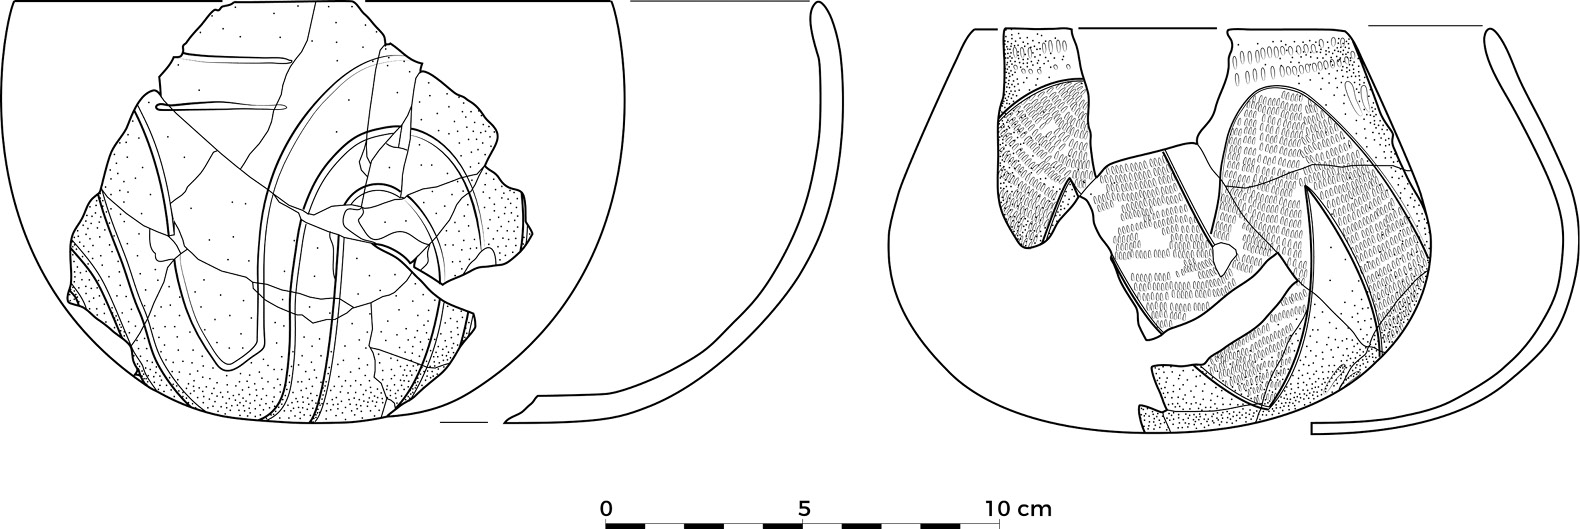
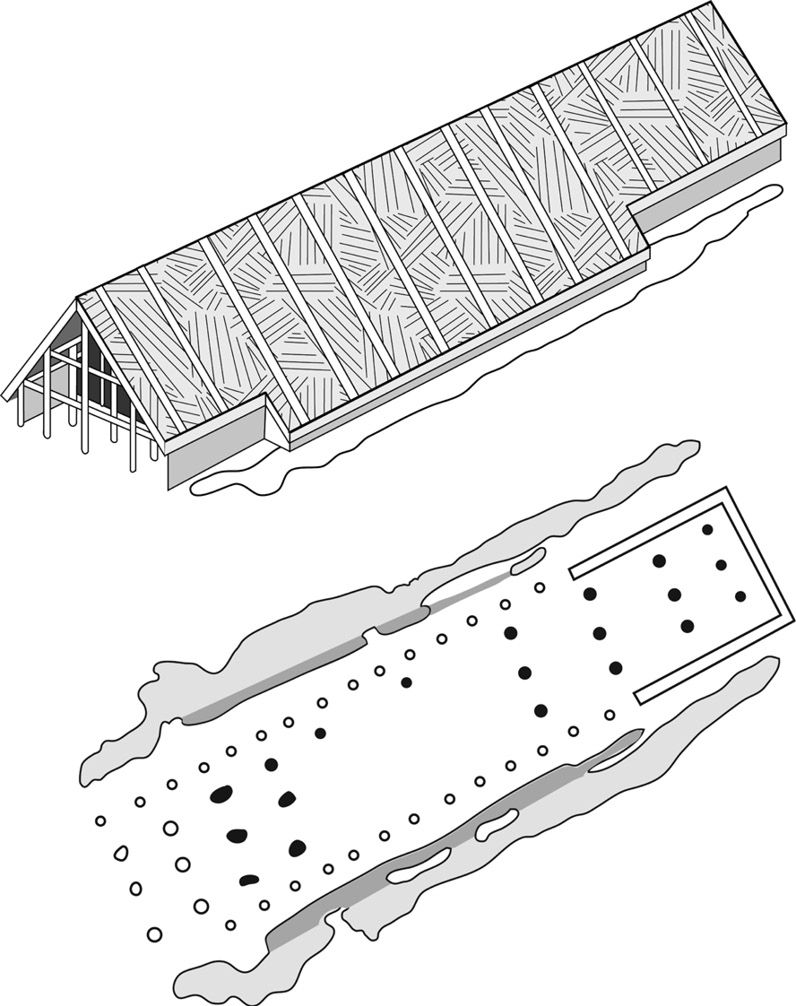
As we saw in the previous chapter, after a pause of around 300–400 years at the northern edge of the Aegean farming spread rapidly through the Balkans from about 8200 BP, reaching the southern edge of the Carpathian Basin and southern Transylvania within 200 years. There the farming frontier stopped again. It was 400–500 years later that the expansion resumed, with the beginning of what is generally referred to by its German name as the Linearbandkeramik (LBK) Culture, after the characteristic bands of incised decoration on the pottery (Fig 4.1). It provides what has become the paradigmatic example of the archaeology of the first farmers in Europe, and has been the focus of many debates about the processes that led to the spread of farming. The main reason for this is its extensive and striking settlement record of large post-built longhouses (see Fig 4.2), which have been revealed in their thousands across Central Europe, from Hungary to the Paris Basin, in the post-war period as a result of large-scale open area rescue excavations in advance of open-cast mining, road-building and industrial developments. The Early Neolithic settlements of the southern Balkans, and later of south-east Europe as a whole, were characterised by the build-up of settlement layers derived from collapsed mud-brick and wattle-and-daub built houses. In contrast, in the environmental conditions of Central Europe there was no such accumulation of sediment as the result of settlement activity. On the contrary, in most places there has been significant erosion, so that all that have survived are the lower parts of pits and post-holes; houses with their floors intact, commonplace in the Balkans, are still virtually unknown despite the thousands that have been excavated. The lack of stratigraphy has led to the devotion of an enormous amount of effort to constructing chronologies of the sites by other means, especially through seriation of the ceramic assemblages preserved in the pits, so that many sites and regions have finer grained relative typo-chronologies than virtually any other period in prehistory. Absolute chronologies, on the other hand, have remained problematic, except in the broadest terms, because the resolution of radiocarbon dates over the period concerned is relatively poor and archaeologists in some regions have been correspondingly reluctant to pay for them.
Examples of earlier and later LBK pottery.
Plan and reconstruction of an LBK house.
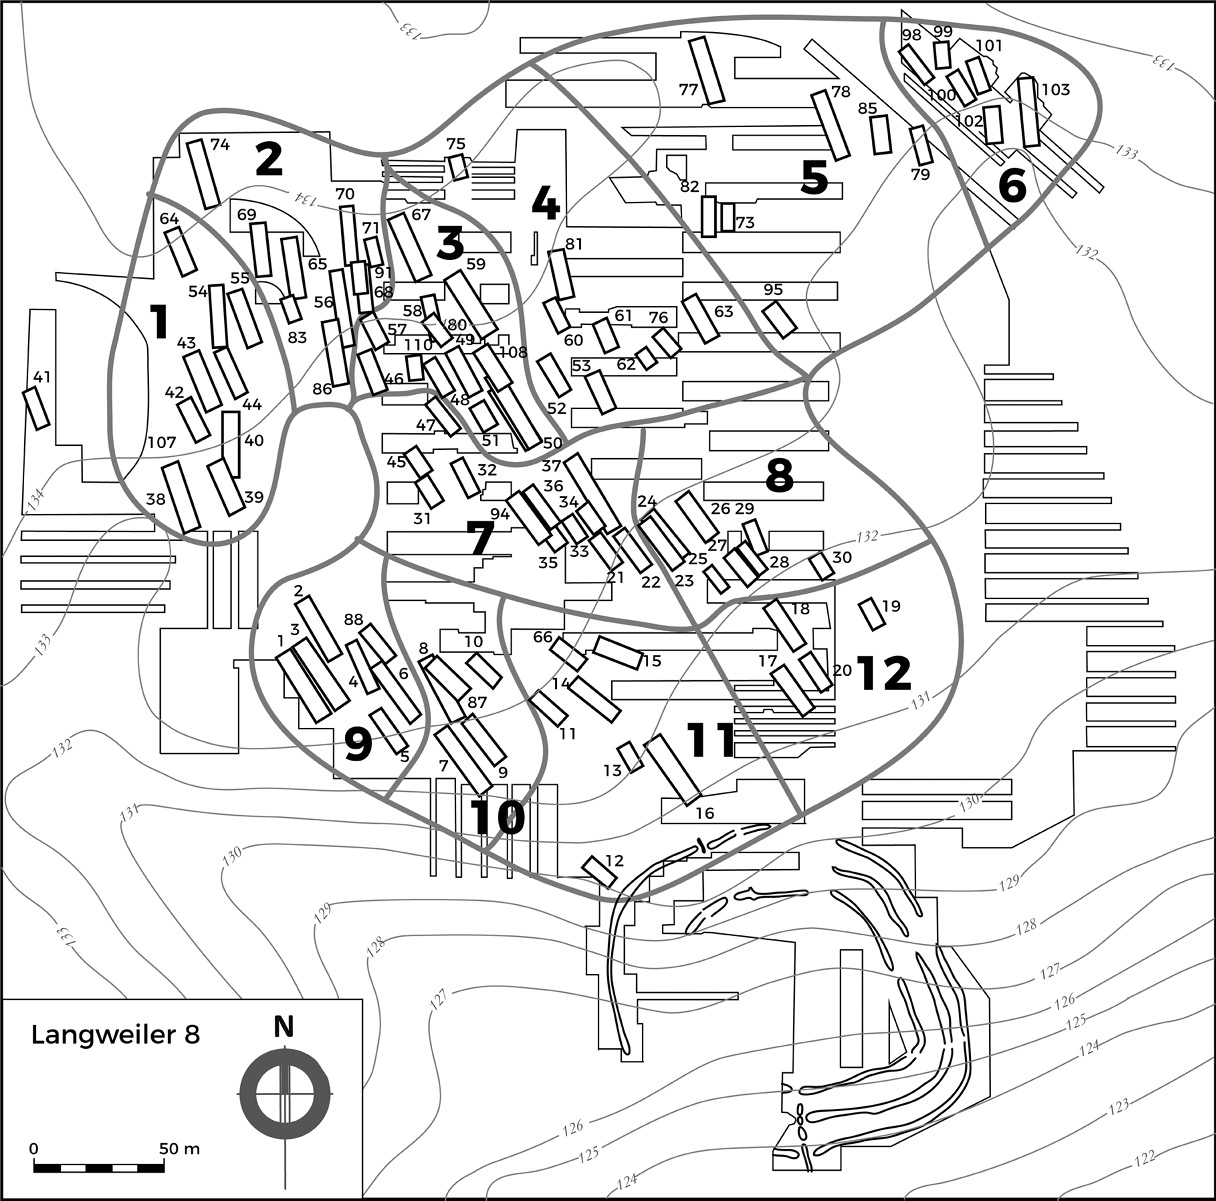
Plan of the Langweiler 8 LBK settlement in the Merzbach valley.
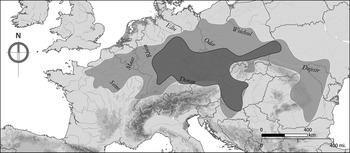
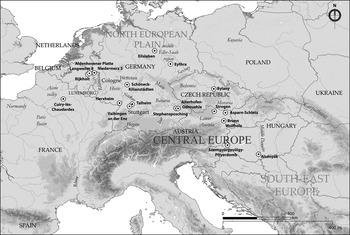
Recent work (see below) has shown that the LBK originated in Transdanubia, in present-day western Hungary, and adjacent parts of Austria, from the local late Starčevo Culture, which had developed as part of the north Balkan expansion that we saw in the last chapter. Beginning c.7600–7500 BP, by c.7300 BP it had spread westwards as far as the river Rhine, over 1000 km away, and northwards into north-central Poland, on the edge of the North European Plain. Less than 300 years later it had reached Normandy in the west, and the Ukraine, nearing the coast of the Black Sea, in the east (see Fig 4.3a for the LBK distribution, and Fig 4.3b for sites mentioned in this chapter). Across the whole area its archaeological record is remarkably uniform, not just in the architecture of the houses but also in the pottery, the crop-based agriculture and in soil preferences and settlement locations. The speed of its initial spread across such a large area of continental Europe has always seemed surprising, and this, combined with the distinctiveness of the LBK Culture and its marked difference from the Early Neolithic cultures of the Balkans, has provided the main basis for a long-standing debate on whether the expansion was the result of the rapid adoption of crops, animals and a farming way of life by local hunter-gatherers or the dispersal of immigrant farmers spreading from the south-east.
The distribution of the LBK.
Map of sites and regions mentioned in Chapter 4.
The Genetic Evidence for the Mechanism of LBK Expansion
As we saw in the last chapter, this debate is now being resolved in favour of the dispersal view as a result of the growing number of analyses of ancient DNA from human skeletons, initially from mtDNA but now increasingly using the huge amounts of information available in whole-genome data. In effect, over a remarkably short time, the ancient DNA evidence has become strong enough to provide the framework for the archaeology of the spread of farming in general, and the LBK in particular, rather than vice versa, so it is here that we need to start. In 2009 a comparison of ancient mtDNA samples from European Mesolithic human skeletons with samples from LBK bones (Bramanti et al., Reference Bramanti, Thomas and Haak2009) found that the two populations were strongly differentiated; there was a vanishingly small probability that the LBK farmers could be descended from the Mesolithic foragers. Subsequent analyses have only confirmed this.
We saw in the last chapter that the first farmers in the northern Balkans were overwhelmingly of Aegean–Anatolian ancestry. The LBK farmer genome data now available (Haak et al., Reference Haak, Lazaridis and Patterson2015; Lipson et al., Reference Lipson, Szécsényi-Nagy and Mallick2017) show the same pattern. In the LBK origin area of Transdanubia the average hunter-gatherer ancestry is only around 1%. Further west, in Germany, the corresponding figure is around 4%, with the additional hunter-gatherer admixture being acquired from individuals with genomes of the ‘Western Hunter Gatherer’ (WHG) group in Central Europe after c.7500 BP as the farming population expanded rapidly westwards.
In other words, the expansion of farming into the Carpathian Basin and then across Central Europe with the LBK was the result of a demographic expansion from the south-east and ultimately from the Aegean and Anatolia.
The Archaeological Record of Farmer–Forager Interaction
The recent genetics results have obvious implications for what we should expect archaeologically of the farming expansion into Central Europe. If the evidence points to very low levels of hunter–gatherer admixture then we should expect very little archaeological evidence of farmer–forager interaction, whether because there were very few foragers present to interact with or because they kept separate from one another, or some combination of the two.
Just as in the case of the Balkans discussed in the last chapter, on ecological grounds we would expect Mesolithic population levels to have been very low away from riverine areas with rich aquatic resources because the oak-lime forest cover that had developed in lowland Central Europe in the course of the Early Holocene would only have supported low densities of prey animals (e.g. Discamps, Reference Discamps2014). For the more easterly part of the LBK region a recent review of the evidence (Kaczanowska and Kozłowski, Reference Kaczanowska and Kozłowski2014) makes clear that there was very little Mesolithic settlement in the LBK origin area of western Hungary and the same is true of adjacent Lower Austria, where only three putatively Late Mesolithic sites are known. Importantly, the sites around the west Hungarian source of radiolarite, a high-quality lithic raw material widely exchanged among early LBK sites, are not Mesolithic, as has been claimed, thus the proposal that early farmer groups were interacting with local foragers to obtain the material must be rejected, an argument confirmed by the fact that there is no evidence of radiolarite use at the Late Mesolithic sites in Lower Austria. North of the Carpathians, in contrast, traces of Late Mesolithic occupation are extensive but they occur in areas of sandy soils, avoiding the loess, the fertile wind-blown sediments laid down during the Ice Age, preferred by the LBK. Despite the fact that these areas were intermixed, so that settlement was ‘mosaic’ in character, there are no indications of Mesolithic impacts on LBK lithics, but isolated finds of LBK polished tools such as adzes do occur in Mesolithic areas, though not in actual Mesolithic assemblages. A similar situation is found in the Saxony region of Germany: farmers and foragers co-existed in different soil/ecological zones but with little initial contact, which only developed later (Stäuble and Wolfram, Reference Stäuble, Wolfram, Hansen and Meyer2013 and see below).
At the western end of the LBK distribution, a study of trends in Mesolithic occupation in the Low Countries, on the basis of the chronological and spatial distribution of microliths, found that those areas of the Low Countries that subsequently became LBK early farming nuclei had long been devoid of Mesolithic occupation (Vanmontfort, Reference Vanmontfort2008). It appears that the loess areas settled by the incoming LBK farmers were marginal to already low-density Mesolithic populations. In general, the evidence for farmer–forager interaction during the LBK in the west is slight. In the Netherlands and Belgium, for example, there are no definite occurrences of Mesolithic artefacts on LBK sites, while at least the great majority of the LBK artefacts found outside the loess settlement areas do not have Mesolithic associations, suggesting that they represent special-purpose LBK sites (Amkreutz and Vanmontfort, Reference Amkreutz, Vanmontfort, Hofmann and Bickle2008); recent finds of LBK-associated Limburg pottery at sites in the marshland of the river Scheldt are equivocal in their significance though at least one site has produced definite evidence of farmer–forager contact (Crombé et al., Reference Crombé, Sergant, Perdaen, Meylemans and Deforce2015). The earliest LBK settlements in Germany east of the Rhine and then in the Rhineland itself obtained much of their flint from the Rijkholt source in the Netherlands, outside the LBK settlement area at this time, so it is assumed that this implies contact with local hunter-gatherers, but the evidence in terms of finds in LBK settlements is slight. As in the eastern part of the LBK area, it is not until much later that there is stronger evidence of contact. Whether the lithic technologies of the western LBK were influenced by the local Mesolithic population remains a matter of debate, with strong arguments made both for and against (e.g. Löhr, Reference Löhr1994; Robinson et al., Reference Robinson, Sergant and Crombé2013).
The strongest evidence for interaction of some sort comes from the presence of a specific, distinctive type of pottery, the La Hoguette type, found both on early (but not the earliest) LBK sites in south-west Germany and also by itself on a number of sites in the Rhône valley and further west, as far as Normandy. From a detailed analysis of the technology and decoration of a find of La Hoguette pottery that indicates a very high level of skill and from a consideration of its regional context, Pétrequin and colleagues (Reference Pétrequin, Martineau, Nowicki, Gauthier and Schaal2009) conclude that it represents the expansion of a group from the south that had acquired pottery, crops and farming skills from the early colonising farmers who first settled on the coast of southern France early in the 8th millennium BP (see Chapter 5). The occurrence of sherds on LBK sites presumably indicates exchange and there are parallels between the distribution of La Hoguette pottery and of Columbella shells that were arriving in the Upper Rhine area during the Mesolithic. The other very distinctive pottery tradition found on LBK sites in the north-west part of the LBK distribution, which has also been regarded as indicative of non-LBK pottery traditions and forager–farmer interaction, is Limburg pottery. However, a recent detailed technical study sees it as probably a special-purpose variety of LBK ware (Gomart, Reference Gomart2014), and it has no closed associations with Mesolithic flint (Amkreutz et al., Reference Amkreutz, Vanmontfort, De Bie, Verbeek, Vanmontfort, Louwe Kooijmans, Amkreutz and Verhart2010).
In summary, hunter-gatherer populations in the loess areas of Central Europe favoured by the LBK farmers existed at very low densities and had little to do with the expanding farming groups. In fact, as we will see, the distribution of the first farmers was restricted to certain extremely specific environments that were very limited in extent. Outside these areas hunter-gatherers must have continued to exist but are largely archaeologically invisible. It was only when farming and farmers expanded their distribution in the late 7th millennium BP that interaction on a larger scale occurred (see Chapter 6).
LBK Origins
While the Neolithic across the Balkans and the Aegean is generally agreed to have considerable similarities in terms of material culture, the LBK is different and represents much more of a break from the material culture of its south-east European ancestors. In the past that could be ascribed to the impact of local Mesolithic groups. Now that the genetic evidence has made this argument untenable it needs to be seen in a different light.
As noted already, the LBK seems to have originated in Transdanubia, western Hungary, and adjacent areas of Austria. Work in recent years has shown that Starčevo occupation reached here, the north-west limit of its distribution, c.7800 BP (Bánffy et al., Reference Bánffy, Osztás and Oross2016) and on its northern fringes the sites of Brunn/Wolfholz on the outskirts of Vienna (Stadler, Reference Stadler2005) and Szentgyörgyvölgy-Pityerdomb (Bánffy, Reference Bánffy2004) in the Lake Balaton area seem to represent formative sites of the LBK, overlapping with the local late Starčevo, c.7500 BP. However, recent formal modelling suggests that the rapid LBK expansion did not begin until the 74th century BP (Bánffy et al., Reference Bánffy, Osztás and Oross2016; Jakucs et al., Reference Jakucs, Bánffy and Oross2016), implying that it was even faster than previously thought. The site of Alsónyék in southern Transdanubia, just outside the formative area, has a Starčevo occupation beginning just after 7800 BP and continuing until c.7500 BP. It is then abandoned and a new settlement lasting over 300 years is founded on the same site c.7300 BP by people using early (but not formative) LBK pottery and building LBK longhouses.
As with the other standstills in farming expansion, the reasons in the Starčevo-LBK case remain unclear. One reason might be a need for cereal crops to adapt genetically to more northerly temperate environments but the only work carried out so far, on barley, suggests that the spread of a variety with a mutation that switched off the sensitivity of the plant to increasing day length was later than the initial spread of farming (Jones et al., Reference Jones, Charles and Jones2013). Work on emmer and einkorn wheat, much the most important LBK crops, remains to be carried out, but it may be that the standstill is connected to the major cultural reformulation that the LBK represents, for example the development of the characteristic LBK longhouse, which may have been associated with new patterns of kinship and residence.
It is proposed here that the origin of the LBK should be seen as an example of the cultural equivalent of ‘peripatric speciation’ (Mayr, Reference Mayr, Huxley, Hardy and Ford1954; Rosenberg, Reference Rosenberg1994). This occurs when a small population on the edge of a larger one becomes isolated from it. The formation of new cultural patterns such as that which characterises the LBK is more likely to occur in small groups physically separated to some degree from their parent population, for a variety of reasons; the sanctions that help to maintain the existing pattern may be weaker, for example, allowing social innovations. Moreover, the new pattern that emerges is likely to have a considerable chance element to it, especially founder effects, in that a small peripheral sub-population will not contain all the elements of the parent population, or even necessarily a representative sample, while innovations may be idiosyncratic. These founder effects will be further enhanced by the chance vicissitudes arising from transmission in small populations. Such patterns may be particularly prevalent in the context of migration. If we think of this in terms of the tempo and mode of evolution, the tempo on such occasions is fast, corresponding to punctuated rather than gradual change, while the mode is the creation of a new branch of the evolutionary tree, ‘phylogenesis’ in the jargon, or evolutionary diversification. This represents a very significant difference from the spread of farming into the Balkans; the latter does not represent a cultural ‘speciation’ but a gradual development (‘anagenesis’), through innovation, adaptation and no doubt some drift, from its Aegean and Anatolian ancestors.
What evidence do we have for such a mechanism in this case? If founder effects and drift are occurring then they should also be visible in the genetics of the human population. Comparison of the Aegean and Anatolian Early Neolithic genomes described in the last chapter with those from Central Europe indeed produced evidence of founder effects in samples from Hungary and Germany (Hofmanová et al., Reference Hofmanová, Kreutzer and Hellenthal2016). Similar evidence of founder effects is seen in a marked reduction in the mtDNA genetic diversity of cattle associated with the LBK, especially the more westerly samples, compared with south-east Europe, and in high levels of genetic distance from regions to the south-east closer to the location of initial cattle domestication (Scheu et al., Reference Scheu, Powell and Bollongino2015).
A loss of diversity is also seen in the crops found in the archaeobotanical assemblages from LBK sites compared with south-east Europe. The suggestion that this might arise as a result of drift and founder effect was explored by Conolly et al. (Reference Conolly, Colledge and Shennan2008, following Colledge et al., Reference Colledge, Conolly and Shennan2005). They first of all excluded crops that might have been deliberately dropped through selection owing to the changing climatic and growing conditions as farming expanded to the north, such as lentil and chickpea. In fact, even when sensitive crops and a number of rare species were excluded, there was still a statistically significant loss of diversity in the LBK compared with the Balkans, which might be accounted for by drift and founder effect. In the event the actual reduction in diversity with the LBK was much greater than that produced by the drift models constructed by Conolly et al. so they rejected the hypothesis, suggesting instead that, in addition to the selective factors leading to the dropping of environmentally sensitive crops like chickpea, there was a cultural preference for the glume wheats, emmer and einkorn, the only two cereals present in a majority of LBK sites. However, Pérez-Losada and Fort (Reference Pérez-Losada and Fort2011) were able to show that if you introduce a spatial dimension to the simulation and consider only the small number of pioneering settlements at the expansion front, then the observed reduction in diversity is indeed achieved, so it may be that no further process is needed to account for it after all.
The basis for this is the phenomenon known as ‘surfing on the wave of advance’, a process, like the wave of advance itself, first described for the genetics of species range expansions (Edmonds et al., Reference Edmonds, Lillie and Cavalli-Sforza2004; Excoffier and Ray, Reference Excoffier and Ray2008). It results in a loss of genetic diversity in spatially expanding populations because the few individuals at the front of the wave are likely to be the most successful; the same will be true of their offspring. As a result, ‘the pioneer genotypes are continually transmitted forward and surf along with the wave’ (Lehe et al., Reference Lehe, Hallatschek and Peliti2012: 1). The more likely it is that a mutation close to the wave front becomes fixed, i.e. becomes the only one present, the more likely it is that it will then dominate the gene pool when the expansion finishes, and the greater the loss of genetic diversity. The argument is that the same applies to cultural innovations: those that occur at the front of the wave are likely to become predominant and, because the numbers at the wave front are small, chance will play an important role in determining which ones prevail. This is relevant to the loss of LBK diversity not just in subsistence and the genetics of the human population but in other domains as well. The pottery is extremely uniform across the broad area of the earliest LBK (Cladders, Reference Cladders2001), and far less diverse than its Balkan ancestors, and it is only in the middle and late LBK that this changes. But there is more going on here than just drift. The lack of innovation in the LBK has often been pointed out (e.g. Sommer, Reference Sommer2001) and is at least as apparent in the longevity of the striking architecture of the longhouses (Coudart, Reference Coudart1998) and in the choice of site locations (see below) as in the crops and pottery already mentioned. The close connection now demonstrated between the genetic and cultural patterns suggests why, because it indicates a pattern of strongly vertical cultural transmission from parents to children. This is inherently conservative because it leaves little scope for the adoption of innovations from outside the local group that challenge existing practices. The result is strong path dependence: once a set of knowledge and practices has become established it defines the range of options that can be envisaged in the future.
The picture we have then is of a group of communities with a common origin that as a result of initial innovation and drift, on the borders of the Balkan Early Neolithic koiné, developed a novel way of life which turned out to be extremely successful as an adaptation and then became fixed in an extremely conservative formula for their economic and cultural activities. This combined with a strongly expansionist ethos that led them in many cases to make the risky decision to move long distances in search of somewhere suitable to settle. Promising dispersal opportunities are chances for increased successful fertility and if others are already taking advantage of them it makes no sense to postpone reproduction.
The Speed of the LBK Spread
Although the speed of the LBK expansion has always attracted attention, it should be clear from what we have seen of the spread of farming into western Anatolia, the Aegean and the Balkans that it is not so exceptional. In all these cases when expansion occurred it was rapid, following the ‘leapfrog’ or Lévy flight pattern, but was then followed by a pause of several hundred years. The LBK is one more example. Studies have clearly shown that the earliest LBK was thinly distributed over a zone from Hungary to western Germany (see e.g. Lenneis, Reference Lenneis, Whittle, Hofmann and Bailey2008: fig 1), including areas that were much more densely settled later in the LBK, and the same is true of the LBK expansion further west, in northern France (Dubouloz, Reference Dubouloz2012). In other words, here, as in the Aegean and the Balkans, people were moving on from one area to the next long before those areas had reached the occupation density that the LBK agricultural system was later capable of supporting; in all these cases there was an initial phase of long-distance dispersal, followed by short-distance infilling. This may have had negative consequences in some cases through ‘Allee effects’, as discussed in the previous chapter. In fact, this may be the reason that relatively few of the very earliest LBK sites continue into later phases and that there was to some degree a ‘recolonisation’ later in the LBK at much greater densities (Cladders and Stäuble, Reference Cladders, Stäuble, Eckert, Eisenhauer and Zimmermann2003); the earliest settlements, especially those far away from the founding zone, were often failures.
In the case of the LBK the speed of the spread would have been increased by advection – preferential movement in the direction that gave colonisers the best returns – in this case given by its focus on a spatially rather narrow band of suitable micro-environments, the loess soil areas already mentioned, together with a narrow range of temperature and precipitation conditions. The soils that form on loess are extremely fertile because their high proportion of silt particles provides both good water availability and aeration as well as easy plant root penetration and cultivation; they are also rich in potassium and nitrogen. Field experiments have demonstrated that there is a much smaller yield difference between unfertilised and well-fertilised fields on deep loess soils than on soils on other surface geologies, especially in drier conditions (Catt, Reference Catt2001).
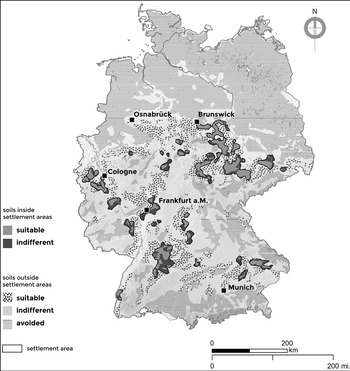
Zimmermann’s (Reference Zimmermann, Wendt, Frank and Hilpert2009b) detailed spatial analysis of the LBK in the Lower Rhine Basin shows that sites were concentrated in small patches that were relatively densely occupied at the time of the LBK population peak. Thus, in this area where soils classified as suitable for early farming made up 11.6% of the land area, settlement was largely concentrated in 3.8%, only a third of the suitable area. Most of the difference can be accounted for by the fact that LBK settlement seems to have been further restricted to areas with annual precipitation of less than 800 mm, but even so it is clear that there were suitable areas west of the Rhine where, at the height of LBK occupation, settlement does not occur. Further east, the same environmental restrictions on the LBK distribution, in terms of loess soils, annual rainfall between 500–800 mm and annual mean temperature no lower than 7–8⁰C, have also been demonstrated for Austria by Lenneis (e.g. Reference Lenneis, Whittle, Hofmann and Bailey2008), though here too there seem to have been suitable areas that were never occupied. It is clear then that LBK pioneer farmers were extremely particular about where they settled. This is illustrated clearly by Fig 4.4, which shows the spatially limited nature of LBK occupation at the scale of Germany as a whole. Moreover, those preferences seem to have changed little over the course of the LBK, again pointing to the conservatism of the agricultural system. The one exception to this pattern are the LBK communities found on the non-loess soils of the North European Plain along the lower Vistula and lower Oder in Poland, which might be argued to have ‘overshot’ the best areas in the long-distance search for new areas to colonise, rather than filling in the prime habitats to the south (Bogucki et al., Reference Bogucki, Nalepka, Grygiel and Nowaczyk2012).
Map of the distribution of LBK settlement in Germany.
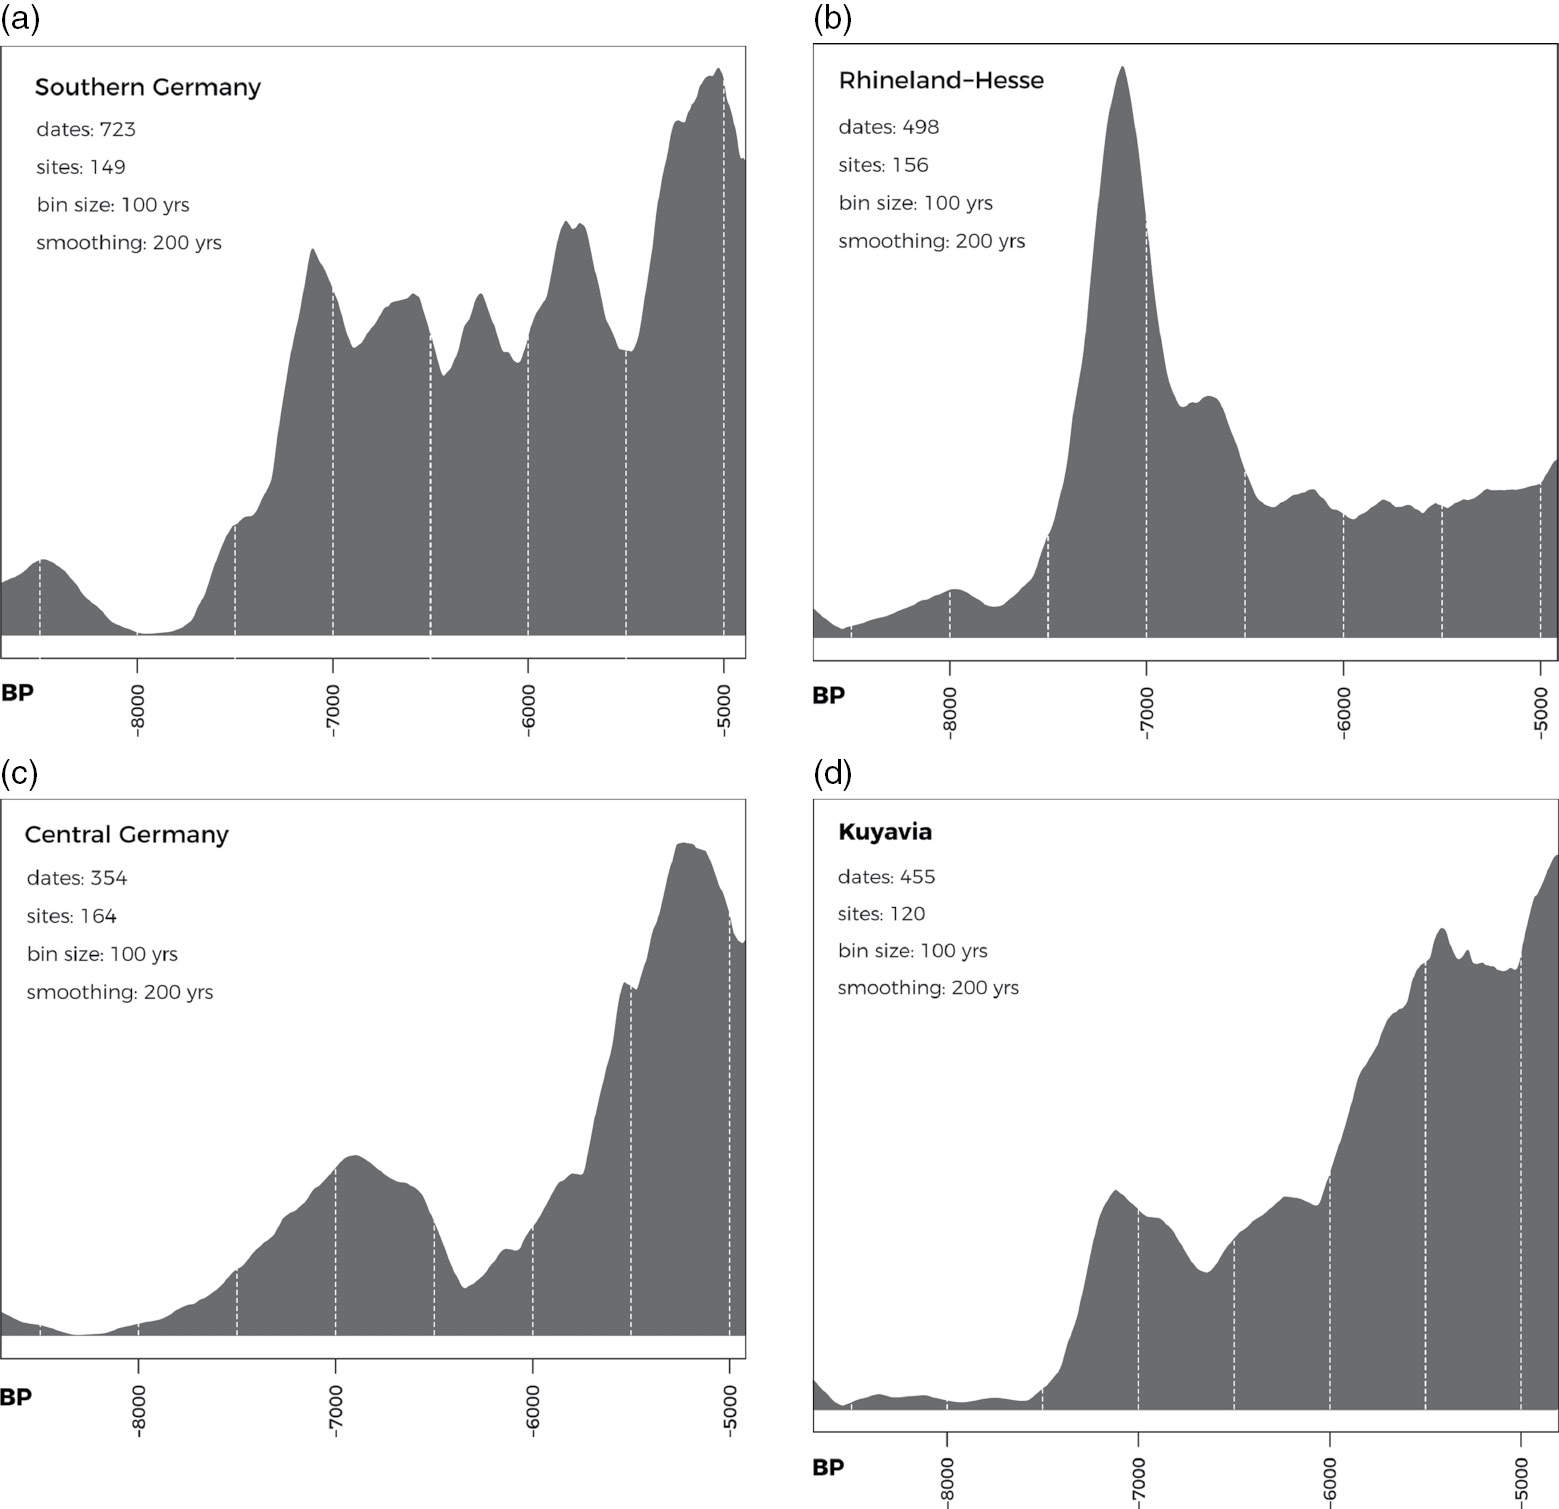
The rich archaeological record of the LBK and its long history of research make it possible to explore the processes involved in the expansion in more detail than the regions examined in Chapter 3. Extensive data is now available on LBK demography, both at broader and more local scales, and they confirm one another. On the basis of studies of the number, size, and density of settlements across a number of different regions, Petrasch (Reference Petrasch2001, Reference Petrasch, Gronenborn and Petrasch2010) calculated extremely high population growth rates, between 0.9% and 2.7% per year, for the LBK. Zimmermann et al. (Reference Zimmermann, Richter, Frank and Wendt2004: fig 15, table 6) estimate that there would have been about 15,000 LBK households in western Central Europe in the 71st century BP, a population of 100,000 or more on the basis of the usual estimates of the number of people per house. This implies an annual growth rate of c.2.4% given that the LBK had started expanding 300 years earlier. Regional population patterns inferred from summed radiocarbon probabilities (Shennan et al., Reference Shennan, Downey and Timpson2013; Timpson et al., Reference Timpson, Colledge and Crema2014) (see Fig 4.5) also show significant increases. In all cases the population grows rapidly before reaching a peak and then declining at the end of the LBK in three of the four regions shown (see below).
Radiocarbon population proxy for four regions in Central Europe: a) Southern Germany; b) Rhineland and Hesse; c) Central Germany; d) Kuyavia. a), c) and d) Data from EUROEVOL project; b) Data from EUROEVOL project updated by Professor A. Bevan.
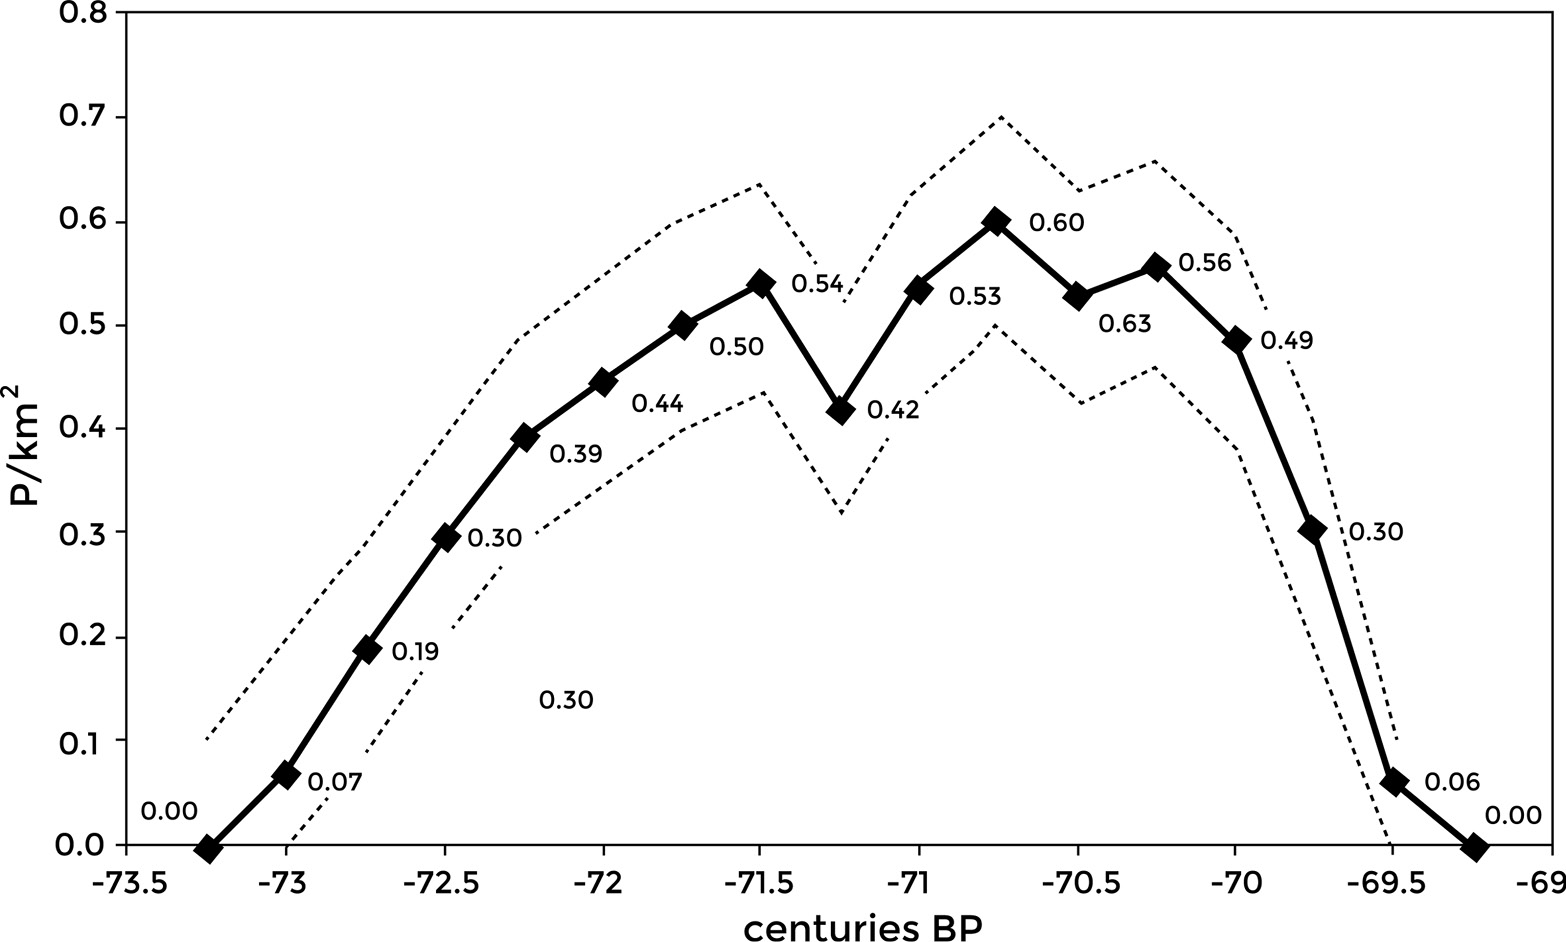
In the LBK case these broad regional patterns are repeated at the micro-scale where detailed work has been carried out. In the Lower Rhine Basin, an area to the west of Cologne in Germany where there has been large-scale excavation in advance of strip-mining for brown coal, we see population grow to a peak after 200 years, followed by a dip and then a rise to a slightly higher peak followed by decline and abandonment 100 years later (Zimmermann et al., Reference Zimmermann, Hilpert and Wendt2009a: fig 6) (see Fig 4.6). A detailed study of all the site records from a small region of Moravia in the eastern Czech Republic, albeit with less temporal resolution, shows a very similar picture (Kolář et al., Reference Kolář, Kuneš and Szabó2016), while Dubouloz (Reference Dubouloz2012, Reference Dubouloz, Bocquet-Appel and Bar-Yosef2008) comes to the same conclusions about demographic patterns in the western LBK.
LBK population density in the Lower Rhine Basin.
LBK Economic and Social Organisation
In terms of domestic animals the LBK does not differ markedly from its north Balkan ancestors though cattle and pig tend to be more frequent and caprines less so, but there are time trends within the LBK variation (Manning et al., Reference Manning, Conolly, Stopp, Colledge, Conolly, Dobney, Manning and Shennan2013a), for example, a tendency for there to be higher proportions of domestic pig at the end of the LBK while cattle dominate in the preceding phase. More striking is the trend in the exploitation of terrestrial wild animals, which is highest in the earliest LBK and then declines. In the past this would have been seen in terms of ‘Mesolithic influence’ but in the light of the genetics this is no longer tenable. In fact, the early sites with high proportions of wild species are all in southern Germany, where uplands with wild animals are closer to agricultural areas, and this pattern continues there through the next phases, so it is probably linked to source-sink ecological dynamics: there was a reservoir of game populations that continued to fill the vacancies created by hunting. In contrast, the evidence for the exploitation of terrestrial wild species in the Polish LBK is negligible (Marciniak, Reference Marciniak, Colledge, Conolly, Dobney, Manning and Shennan2013). There is relatively little information on the age-at-death distribution of the faunal assemblages and its relation to different strategies for animal keeping, though what there is does not support a specialised dairying pattern (Fraser et al., Reference Fraser, Bogaard, Schäfer, Arbogast and Heaton2013); however, the occurrence of specialised ceramic sieve vessels with residues confirming that they were used for cheese-making is indicative that milking was important, most probably of cattle (Salque et al., Reference Salque, Bogucki and Pyzel2013). Moreover, there is every reason to believe from what we know ethnographically that cattle were slaughtered for community events such as feasts rather than to provide a daily meat ration, for which milk is likely to have been much more important. Both cattle and pigs seem to have been carefully controlled; no doubt the same is true of sheep and goats. In the case of cattle and pigs this is indicated by the lack of mitochondrial evidence for introgression of local aurochs genes into the domestic cattle and the evidence that the domestic pigs from the LBK site of Eilsleben in Germany continued to be of the Anatolian/Near Eastern mtDNA haplotype, which is not present in pre-Neolithic wild pigs in Central Europe (Larson et al., Reference Larson, Albarella and Dobney2007; Ottoni et al., Reference Ottoni, Girdland Flink and Evin2012). However, new still unpublished genomic data, which contains much more information than mtDNA, is now suggesting that some introgression with local aurochs, even if minimal, did occur and that, despite the Eilsleben finding, Anatolian pig lineages were already beginning to be replaced by European ones during the Balkan earlier Neolithic (Burger, pers. comm.). In any case, subsequently Near Eastern pig lineages died out completely and were replaced by European ones.
We have already seen that the LBK crop agriculture system represented a significant decrease in diversity in comparison with the Balkans, with the majority of sites including only two cereals: emmer and einkorn. Peas are also widely found, as well as flax, while opium poppy occurs on later LBK sites, though whether as a local domestication in the north-western LBK or as an import from the west Mediterranean is currently unclear (Salavert, Reference Salavert2011). Now, however, we need to look more closely at how the agricultural system functioned. Early LBK studies, such as those of Soudsky at the famous Czech site of Bylany, postulated that its subsistence was based on slash-and-burn farming, with frequent movement of the settlements, one way to account for the rapid spread. However, on the basis of a functional ecological analysis of the weed species found in the archaeobotanical assemblages at LBK sites, indicating a lack of the perennial weeds that would be expected in newly cleared ground and a dominance of annual species, Bogaard (Reference Bogaard2004b) argued that they indicated long-term cultivation of the same sites, resembling small-scale ‘garden’ agriculture, a continuation of the system that we have already seen postulated for Anatolia, the Aegean and the Balkans. This argument was later further supported by stable isotope analyses of carbonised seed remains from LBK settlements, which showed increased nitrogen isotope values, indicative of an enhancement of soil nitrogen, implying the addition of manure to maintain fertility (Bogaard et al., Reference Bogaard, Fraser and Heaton2013); this would be in keeping with the evidence just mentioned that cattle and pigs were closely controlled. At the site of Vaihingen, south-west Germany, for example, the δ15N nitrogen values were higher than those inferred for herbivore forage and imply an application of 10–15 tons/hectare of manure on the basis of comparison with experimental cereal-growing plots. Manuring at this rate would have been intensive in terms of labour requirements but also in its land use, in its high inputs to a small area. In any case, as we have seen, loess soils are capable of maintaining moderate cereal yields even without the addition of fertiliser (Catt, Reference Catt2001). The argument that the cultivated areas were small is strengthened by the remarkably low impact of the archaeologically highly visible LBK in local pollen diagrams, where indicators of forest clearance and crop cultivation are generally slight (see e.g. Bogucki et al., Reference Bogucki, Nalepka, Grygiel and Nowaczyk2012; Lechterbeck et al., Reference Lechterbeck, Edinborough, Kerig, Fyfe, Roberts and Shennan2014), though see Kreuz (Reference Kreuz2012: 70) for evidence of clearance in pollen spectra). This does not mean that the rest of the landscape was unused, however. Isotope studies have shown that least in some cases cattle were moved seasonally to non-loess areas, even if those were not very far away (Knipper, Reference Knipper2011).
On the basis of assumptions about daily calorific needs and the yield of a hectare of land, Kreuz (Reference Kreuz2012: 124) calculates that for the daily nutrition of a community of 20 people for a year it would only have been necessary to use c.10 ha, 3% of the available land within a kilometre radius of the settlement, for growing crops, so it is clear that even if her yield estimates are considerably exaggerated large numbers of people could easily be supported. On the basis of figures calculated by Russell (Reference Russell1988) for the time taken to produce a kilo of cereal per person per day, from preparing the field by hand to grinding the grain, it would have taken about 25% of the available annual labour time.
At least as important as the basic framework of subsistence, however, is how it was organised, both in economic and social terms. The most sustained attempts to address such topics have been focussed on the site of Vaihingen just mentioned (Bogaard et al., Reference Bogaard, Krause and Strien2011). This was founded during the earliest LBK and its occupation continued for c.450 years, through to the late LBK, during which several phases can be distinguished. It is believed that at its height, in the earlier LBK Flomborn phase, there were 40–50 longhouses, corresponding to 300–400 people on the most widely used estimate of the average number of people who would have occupied a house, dropping to 15–18 houses at the transition to the middle LBK. From an analysis of the characteristics of the archaeobotanical assemblages and their distribution in relation to the different houses it has been claimed that in the earlier periods of occupation different house groups had differential access to specific cultivated areas over generations, and that one group in particular had access to the best plots, those on loess-based soils nearest to the village. This would certainly fit with the practice of intensive garden cultivation and the labour investment in plots of land that this implies, but the specific claims depend on the disputed identification of different parts of the village as associated with different ‘clans’, while an attempt to find a similar pattern at Langweiler 8, the dominant settlement in the Merzbachtal cluster in the Lower Rhine area was unsuccessful (Zimmermann, pers. comm.).
Nevertheless, claims of inequality fit in with inferences that can be made from strontium isotope studies of teeth from human skeletons to identify patterns of mobility. They point to a widely occurring pattern of greater variability among females than males, resulting from the fact that many more females were non-local, i.e. they did not pass their early lives in the place where they were buried (Bentley et al., Reference Bentley, Bickle and Fibiger2012). The authors see this as pointing to patrilocal residence patterns, where women moved on marriage to the residence of their husband’s family. The pattern often occurs where there are kin group property rights, such as land rights, that are inherited through the paternal line. Males buried with distinctive stone adzes, made of material obtained by long-distance exchange, also had more uniform isotope signatures than those without from the same site, with values corresponding to those for loess soils, pointing to inequality among males.
Population Ecology of the LBK Expansion
To gain more insight into the processes that produced these patterns we need to return to the broader scale of the LBK expansion. As we have seen, it was an overwhelmingly demic one similar in its pattern to that which brought farming to the northern Aegean and then to the Middle Danube; long-distance movements took place leading to the colonisation of new places long before existing settlement areas reached densities anywhere near the carrying capacity of the Early Neolithic farming system. Generic reasons have been suggested for the pattern, for example that Lévy flights represent an efficient search procedure in situations of uncertainty, but the detailed data on the history of LBK settlements makes it possible to look at relevant considerations in more detail.
As outlined by Shennan (Reference Shennan, Bocquet-Appel and Bar-Yosef2008), the basis for understanding the characteristics of the LBK expansion is provided by principles derived from natural selection thinking as they relate to decision-making concerning spatial behaviour (Sutherland, Reference Sutherland1996; Winterhalder and Kennett, Reference Winterhalder, Kennett, Kennett and Winterhalder2006: 16). These principles predict the distribution of individuals in relation to resources on the basis of the ‘ideal-free distribution’. When individuals (of any species) seeking to maximise their probability of survival and reproductive success move into a new area they will occupy the resource patch which gives them the best returns. As more individuals occupy the patch the returns to each individual decline, to the point that the returns to an individual from the best patch are no better than those from the next best patch, which at this point has no occupants. Now the returns from both patches are equal and they will be occupied indiscriminately until such time as the population grows to the point at which there is an equal benefit to be gained by occupying a still worse patch, and the process is repeated, with the relative quality of the patches being reflected in their different population densities.
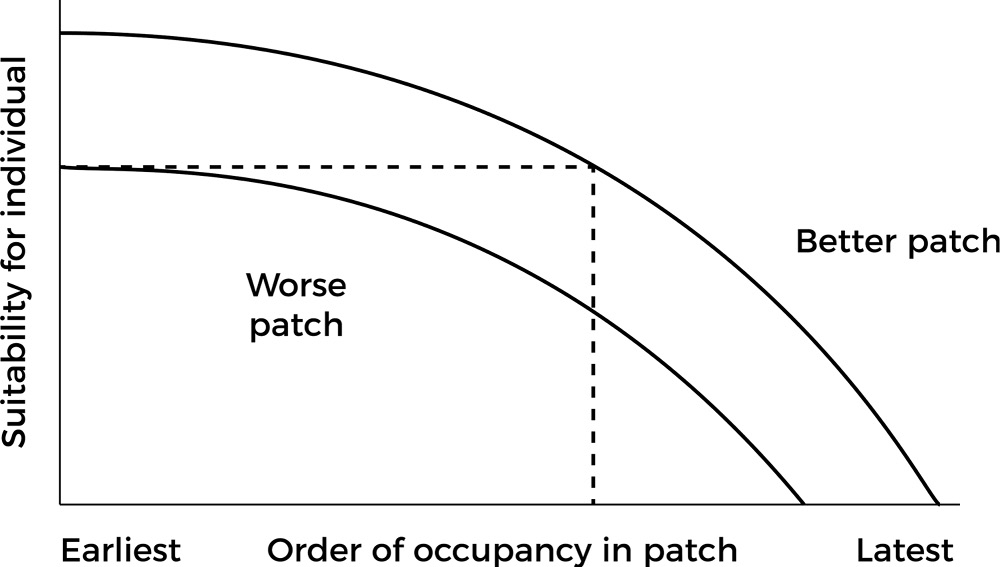
When there is territoriality, however, the situation is different. Here the so-called ‘ideal despotic distribution’ applies (Fig 4.7). The first individual occupying an area is able to select the best territory in the best patch. Subsequent individuals settling there do not affect the first arrival, but have to take the next best territory, and so on, until there comes a point where the next settler will do just as well by taking the best territory in the next best patch. Subsequent individuals will then take territories in either patch where the territories are equally suitable. In contrast to the ideal-free distribution, where interference competition from new settlers decreases the mean return for everybody, including those who arrived first, in the case of the ideal despotic distribution the returns depend on the order of settlement, so that the initial settlers of the best territory in the patch will do best, so long as they can defend the territory against anyone who might seek to take it from them.
The ideal despotic distribution.
In the case of the spread of farming into Europe, the new households being formed as population expanded would have been evaluating the costs and benefits of staying near their parents’ household or finding somewhere else, following the principles of the ideal despotic distribution. In principle, all that would have been required for further spatial expansion is a shift in the balance of costs and benefits between accepting the next best local territory available and taking the risk of finding and settling a new top quality patch some distance away, allowing for the fact that to be the very first occupant of a more distant patch might have disadvantages, as we have already seen. In fact, we need to qualify this somewhat. While there are settlements in which the earliest phase consists of a single house (e.g. Strogen, Lenneis, Reference Lenneis, Whittle, Hofmann and Bailey2008), in the case where it was the first settlement in a local region it generally consisted of several houses; for example, at Langweiler 8 in the Rhineland there were four (Zimmermann, Reference Zimmermann2002), at Stephansposching in Bavaria it was between two and six (Pechtl, Reference Pechtl, Wolfram and Stäuble2012). This would have mitigated the risks of isolation.
In the light of these population ecology principles, it seems likely that in the case of the LBK there was a massive advantage in being the founding settlement in a high-quality area, so that the groups breaking away as settlements grew and fissioned were always competing for this role. Thus, Kerig (Reference Kerig2008) was able to demonstrate that LBK settlement in Hesse in western Germany followed the principles of the ideal despotic distribution, with the best territories occupied first, while in the Aisne valley in northern France, at the western end of the LBK distribution, long-lasting settlements were located in places with higher proportions of land suitable for cereal agriculture than short-lived ones (Dubouloz, Reference Dubouloz2012). On this basis we expect the founding settlement in a particular area to be the dominant one and this is generally what we find. Vaihingen, already described, is one example and in fact has no local ‘offspring’ settlements. Another is Langweiler 8, just mentioned, the first settlement founded in the valley of the Merzbach stream, which was occupied throughout the c.400 years of the local LBK sequence and was always the largest (Boelicke et al., Reference Boelicke, Lüning and Stehli1994). Even if its location was only one of the best available in the region from the farming point of view, it would have had founder advantage in terms of control of local territory, and its leading position is also suggested by the fact that it seems to have acted as a redistribution centre for lithic resources. These were obtained from the major source of high-quality flint at Rijkholt, some distance away to the west, either as a result of controlling exchange relations with local foragers beyond the agricultural frontier or through direct access to the source (Zimmermann, Reference Zimmermann2002). Moreover, it was at Langweiler 8 that a ditched enclosure of possible ritual significance was constructed in the latest local phases of LBK occupation, a subject to which we will return.
Bell and Winterhalder (Reference Bell and Winterhalder2014) have shown that despotic conditions can slow down rather than increase the rate of migration by increasing the time required for the despotic habitat to reach carrying capacity, the opposite of what is argued here, but their model assumes that it is only subordinates, as opposed to dominants, that would want to move. In the LBK context, with its patrilocal residence system and probable patrilineal inheritance, there is no reason why it should not have been younger sons of successful founding lineages who led fissioning community segments, rather than subordinates whose wealth and reproduction had been restricted, as in the case of European aristocracies whose primogeniture rules led to more risky but potentially lucrative careers for younger sons, often in distant colonies. In studies of known recent settlement fissioning, disputes and conflicts of various kinds have been the motive (Walker and Hill, Reference Walker and Hill2014). However, the small number of houses at the earliest sites in different regions seems to indicate that their populations were well below the 100–200 associated with significantly increased levels of scalar stress (Alberti, Reference Alberti2014), though this certainly changed in the course of the LBK. In the expansionary context described here there may simply have been a socio-cultural expectation of moving on and establishing founder advantage.
Initially then there was rapid settlement fission associated with founding new settlement nuclei in new regions, quite possibly involving ‘leapfrog’ migration in the sense described by Sahlins (Reference Sahlins1961), citing Bohannan (Reference Bohannan1954) for the Tiv in Nigeria, with groups from within the already established LBK area moving out beyond the frontier – this is suggested by the long-distance connections of some early sites (Schade-Lindig and Schade, Reference Schade-Lindig, Schade, Gronenborn and Petrasch2010). Then there was local infilling, with founding settlements increasing in size and small, local daughter settlements being established; this is seen, for example on the Aldenhovener Platte in the western Rhineland (Zimmermann, Reference Zimmermann2002) but also in the Wetterau region north of Frankfurt (Schade, Reference Schade2004). Relatively rapidly though, as a result of this infilling, the individual micro-regions began to fill up and reach a ceiling. The empirical existence of these ceilings is visible in the demographic proxy data discussed above but what produced the limits on equilibrium population is unclear. As we have seen earlier, Zimmermann has argued that, even allowing for the very restrictive soil and climate conditions required for LBK agriculture, there would still have been more than enough land available for the small-scale intensive agriculture that was most probably practised, but ensuring the availability of fodder for cattle would have required very large territories. Schmidt et al. (Reference Schmidt, Gruhle and Rück2004) have suggested that fluctuations in the total number of houses once an initial ceiling had been reached, as on the Aldenhovener Platte, were affected by local climatic patterns, with slight rises indicating more favourable conditions and declines pointing to downturns. Such sensitivity would suggest that local populations did indeed near the carrying capacity sustainable by the LBK subsistence system during the later LBK when long-distance expansion had ceased.
It is likely that the local growth in population would have led to increased inequality between different communities if the ‘ideal despotic’ principle prevailed. Potentially too it would have increased competition between those communities, although founder settlements would have retained an advantage in any such competition; in the Rhineland, for example, Langweiler 8 was always the largest settlement in its area. The evidence for increasing inequality comes from settlements as well as cemeteries. For the settlement evidence the case was made by van der Velde (Reference van der Velde1990), on the basis of sites in the south-eastern Netherlands and the Aldenhovener Platte discussed above. LBK houses seem to be made up of three modules: a north-west, central and south-eastern part, each with different functions. Some houses only have the central part, presumed to be the main living area, some a central and north-west element, and others have all three parts; the south-eastern part, believed to be the front, is generally argued to have included a granary. Van der Velde proposed that the distinctions between houses with larger and smaller numbers of elements relate to the wealth and status of their associated households and cannot be explained by changing household composition arising from family life-cycles. At the Dutch sites the houses with all three elements had more room than the others (the individual house elements were larger) and more stone adzes were associated with them. At the site of Langweiler 8 cereal-processing waste was preferentially associated with the large houses (Bogaard, Reference Bogaard2004b). On the basis of a spatial analysis of the settlements he studied, van der Velde also showed that the units of which the settlements were made up suggest the existence of long-term social patterns: particular households and groups of households seem to have persisted through time, with continuing inheritance of status witnessed by the rebuilding of houses of the same type in the same places. Coudart’s (Reference Coudart1998) analysis of LBK houses led her to conclude that major rank or wealth differentiation did not exist but she too points to some indications of status differences. She notes, for example, that granaries were never associated with small houses and that some buildings were more spacious than others. Interestingly, she also suggests that perhaps the largest houses were associated with the groups that had first established the settlement.
A recent analysis of the late LBK (c.7050–6900 BP) site of Cuiry-lès-Chaudardes in the Aisne valley of northern France (Gomart et al., Reference Gomart, Hachem, Hamon, Giligny and Ilett2015) identifies two groups of houses that existed throughout the duration of the occupation. One group was characterised by large houses, which showed a dominance of stock-keeping and cereal-grinding evidence and homogeneous and conservative pottery-making traditions. The other group was made up of small houses, with more evidence of hunting and craft activities and a greater diversity of pottery-making techniques. The first is argued to represent houses showing ‘continuity and strong production capacity with possible surplus’ that were occupied by long-established families and the second a ‘process of integration and economic maturation’ (Gomart et al., Reference Gomart, Hachem, Hamon, Giligny and Ilett2015: 244 and fig 9), houses occupied by small newly established families, including some belonging to newcomers. On the basis of what we have seen for the LBK more generally, it seems probable that the pattern represents a contrast between founding families with superior wealth and status and late comers with diminished wealth and property rights.
As far as burials are concerned, it is clear that there were complex patterns of spatial differentiation involving both burial within settlements and also the existence of separate cemeteries, mainly of individual inhumations, which are very rare in the earliest LBK phases. Jeunesse (Reference Jeunesse1997) concludes that the earliest ones present a picture of relatively egalitarian societies, with indications of achieved status for older men, while the later ones tend to have a small group of graves, including child burials, clearly distinguished from the rest by the presence of markedly richer grave goods and possible symbols of power. This is the case, for example, with the cemetery of Niedermerz 3 that belonged to the settlements of the Merzbachtal on the Aldenhovener Platte and was established in the 72nd century BP. Cemeteries would have come into existence for precisely the reasons proposed in the long-standing Saxe-Goldstein model (Saxe, Reference Saxe1970; Goldstein, Reference Goldstein1981; Morris, Reference Morris1991): to represent an ancestral claim to territory in the face of increasing competition as local carrying capacities began to be reached.
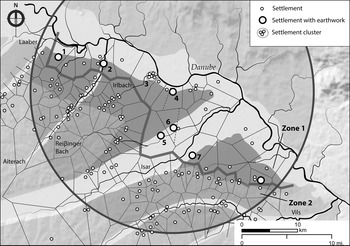
Similar processes to those seen in the western LBK can also be seen in Lower Bavaria, along the Danube, where it is joined by the river Isar and other tributaries (Pechtl, Reference Pechtl, Wolfram and Stäuble2012). The major site of Stephansposching rapidly grew eight-fold from the founding two to six houses. Here too there are persistent rebuildings of houses on the same sites showing the importance of maintaining the continuity of the household and its rights, Pechtl suggests. Given that the lives of the houses seem to have been much shorter than would have been necessary from the structural point of view, new houses may have been built with each new generation, as a new household head replaced his predecessor. What is particularly interesting in this region though is the evidence for the settlement pattern (see Fig 4.8). On the edge of the plain here and in the hillier land behind it there are numerous LBK sites scattered along small streams at intervals of no greater than 2 km. Most of these are small, with few houses, an average of six from the excavations that have taken place, and little evidence of rebuilding, suggesting that they were only occupied for short periods. On the lower river terraces closer to the main river valleys, however, the situation is very different. There are fewer sites, at greater distances from one another, and they are different in character, the majority including earthwork enclosures. Thus, the site of Stephansposching and its two neighbours all have enclosures, indicative of prestige competition Pechtl argues. One of these sites, Aiterhofen-Odmuehle, also has a cemetery with burials containing rich grave goods. These sites are mainly large, densely occupied settlements lasting hundreds of years, which deserve the title of villages. While the average number of houses known from excavation areas at these sites is 44, the number in a given settlement as a whole was certainly much larger than this.
The LBK settlement pattern in Lower Bavaria. Site 2 Aiterhofen; 4 Stephansposching.
As local micro-regions became more fully occupied, competition between lineages would have become increasingly important and members of the senior line would increasingly have had to assert their position in order to maintain it. The deposition of rich grave goods as a form of costly signalling (Neiman, Reference Neiman1997; Bliege Bird and Smith, Reference Bliege Bird and Smith2005) might have had a role here. In this case, the number of rich burials would not simply be a reflection of the size or power of the senior lineage but of the competitive pressure it was under in particular places and times. Pechtl (Reference Pechtl, Hofmann and Bickle2009) sees the construction of exceptionally large longhouses in a similar light, as associated with inter-lineage competition. Most of them date to the late LBK when population was at its highest.
The Decline and Disappearance of the LBK
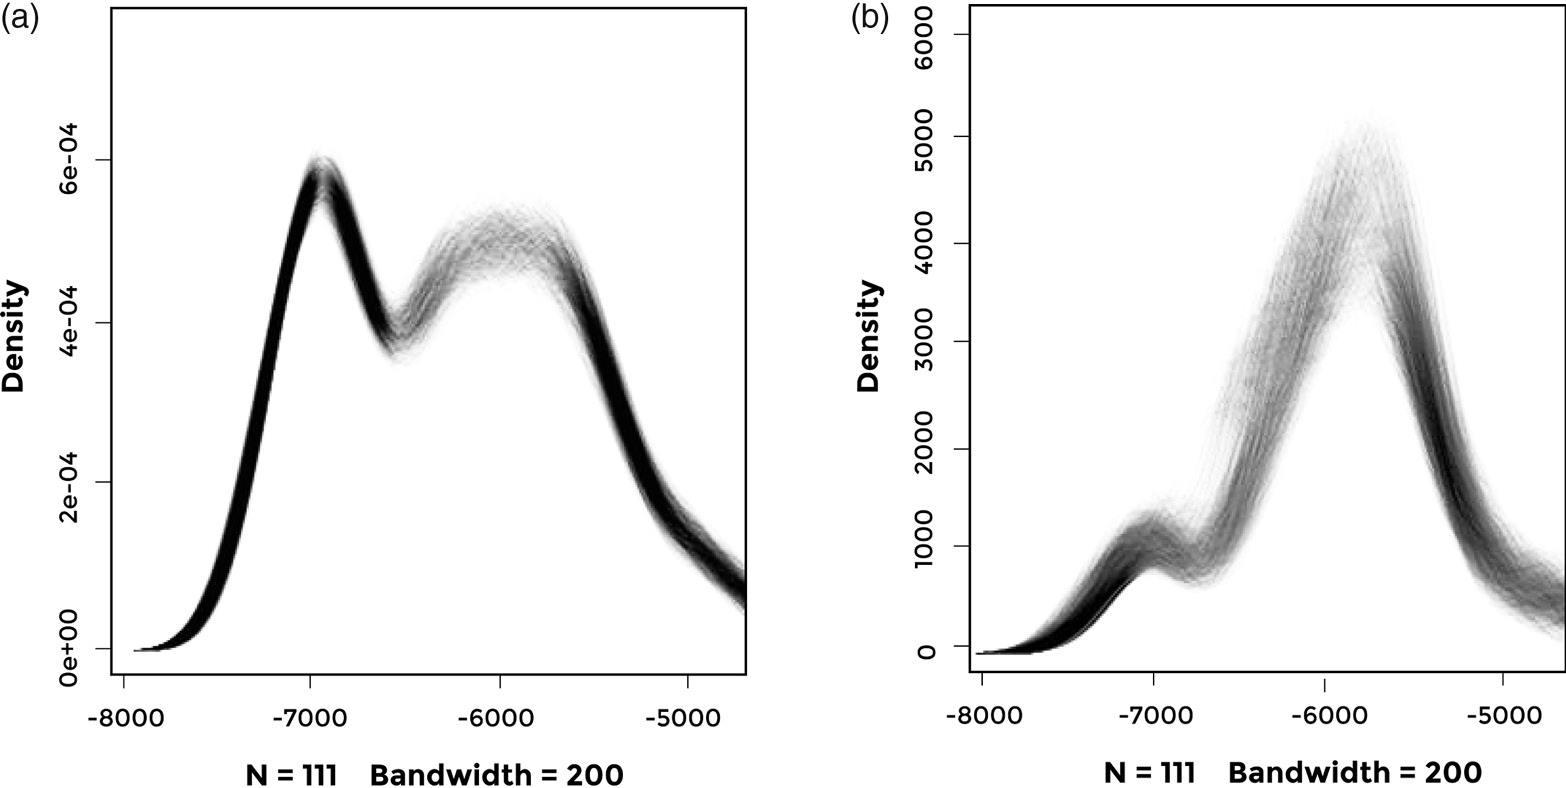
The development of local inequality based on priority of access during the colonisation process is not the only widespread institutional trend to be observed in the course of the LBK. The appearance of ditched and/or palisaded enclosures (see Fig 4.2b for the enclosure at Langweiler 8) in growing numbers in later occupation phases seems to characterise many if not most LBK settlement micro-regions; the overall picture is well brought out in Fig 4.9a, which shows a rapid rise to a peak in the number of enclosures at c.7000 BP, followed by a fall. There has been considerable discussion of the function of these late enclosures, but some are certainly associated with violence. The site of Herxheim, for example, has extensive evidence of cannibalism in the human remains buried in the ditches (Boulestin et al., Reference Boulestin, Zeeb-Lanz, Jeunesse, Haack, Arbogast and Denaire2009), while the idea that defence was often among their roles has been supported in recent years by the finding of three massacre sites dated to local late LBK phases in three different regions.
Chronological distribution of enclosures in Central Europe. a) Number of enclosures; b) Number of enclosures weighted by their size. Distributions created by using an aoristic method and repeated sampling from known enclosure date ranges.
Kerig (Reference Kerig, Veit, Kienlin, Kümmel and Schmidt2003) has suggested that the enclosures represent the emergence of a new type of social institution integrating larger numbers of people into a single social unit, which would presumably have incorporated the patrilineal land-holding lineage system that has been postulated above. The existence of institutions capable of bringing large numbers of men together for warfare, at least on a temporary basis, is suggested by the scale of all three known massacres. At Talheim in south-west Germany the remains of 34 individuals were recovered (Wahl et al., Reference Wahl, Konig and Biel1987); at Asparn-Schletz in eastern Austria at least 67, even though the enclosure ditch into which they had been dumped was only partially excavated (Teschler-Nicola et al., Reference Teschler-Nicola, Gerold, Kanz, Lindenbauer and Spannagl1996); at Schöneck-Kilianstädten in Hesse, western Germany, there were 26 individuals, with evidence of torture and/or mutilation (Meyer et al., Reference Meyer, Lohr, Gronenborn and Alt2015). These figures imply very large numbers of attackers. A possible analogy comes from Fredrik Barth’s description of the Faiwolmin group in New Guinea (Barth, Reference Barth1971, cited in Soltis et al. (Reference Soltis, Boyd and Richerson1995). Barth pointed out that the western Faiwolmin communities lived in nucleated villages centred on cult houses whereas populations in the east were more dispersed. The centralised communities thus had a military advantage and, as a result, were able to expand towards the east, where the social system could not organise as many people for defence.
Whether the LBK enclosures were themselves always defensive constructions then is not really the point if one accepts that they represent a new kind of social institution involving larger scale integration and mitigating scalar stress. In a similar vein Zimmermann (Reference Zimmermann2012) sees them as corresponding to the size of the largest cooperating social unit at the time, and, on the basis of his spatial method for population estimation (e.g. Zimmermann et al., Reference Zimmermann, Richter, Frank and Wendt2004), estimates this to be in the low hundreds. We have already seen it postulated that enclosures appeared in Lower Bavaria as a result of prestige competition between long-lasting major settlements. In the light of the evidence for massacres it can be suggested that once institutions emerged that integrated larger numbers of people into a cooperating unit that was competitively successful, other groups had little option but to copy them if they wished to avoid potentially disastrous consequences. The general context in which to see this is the reaching of local carrying capacities in many of the areas where LBK farmers had settled; by this time one group’s gain was another’s loss.
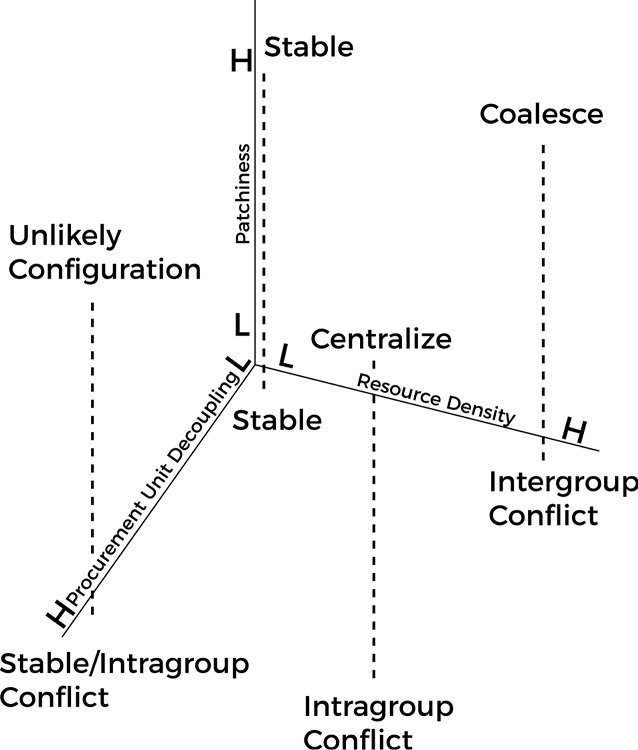
Important further light can be thrown on the whole LBK settlement and social sequence just described by considering the ‘self-centered decision model for reproductive decisions’ developed by Read and LeBlanc (Reference Read and LeBlanc2003) and its implications for understanding the consequences population processes can have on social behaviour and institutions. Their key point is that, while an individual/family-centred cost–benefit model of the kind presented earlier in this book is always central to reproductive decision-making, the institutional consequences of the aggregated local reproductive decisions vary, depending on three factors: resource density, resource patchiness and the extent to which the reproductive decisions of families are decoupled from the fate of the larger group of which they are a part (see Fig 4.10). The LBK situation was one in which resource density was high and the degree of patchiness low at the level of individual settlement catchments, though high at the larger scale. In the early phases of settlement expansion it seems that small groups of households were relatively autonomous and settlements could fission at will. As population grew, intra-group inequality increased, as we have seen. Moreover, since all the local settlement regions were becoming full at the same time, it would increasingly have been the case, in Read and LeBlanc’s words (Reference Read and LeBlanc2003: 62), that, ‘The demographic dynamics of one group [would] impact the population dynamics of neighbouring groups’, thus the fortunes of individual families and their corporate groups would have been increasingly closely bound together. The prediction of the model in these circumstances is inter-group conflict. Thus, the role of the social institutions associated with the enclosures in mitigating scalar stress, and helping corporate groups act more effectively as entities, as described above, would have become more important as the dominant social dynamic shifted from a position on the lower left of the space in Fig 4.10 to the upper right.
The three dimensions identified as affecting the outcomes of Read and LeBlanc’s decision-making model and the outcomes predicted for the eight configurations defined by extreme values on each dimension. H, high; L, low.
The widespread occurrence of enclosures is not the only indicator of change in the later LBK. Long-distance lithic exchange also declined. Throughout most of the LBK period supplies of high-quality flint were obtained from special sources and exchanged very widely (e.g. Zimmermann, Reference Zimmermann1995). In the latest phase, exchanged lithic raw materials declined in frequency at settlement sites and increasing proportions of the lithic assemblages were made up of material from local sources of poorer quality. Relations between adjacent groups may have broken down so completely that long-distance exchanges, with material passing through many hands, became impossible.
This process may have been one of the factors that led to a population crash in many LBK areas just after 7000 BP, including all those with evidence of massacres. If you look at the aggregate radiocarbon pattern for the four LBK regions shown in Fig 4.5 you find clear evidence of population decline at the end of the LBK in southern Germany, the Rhineland and Kuyavia. However, this is not universal. The exception is central Germany, one of the largest settlement areas, which does not show a marked decline until the later 7th millennium BP (Müller, Reference Müller2001: 424 and fig 261) and where there is also a continuous cultural development from the LBK to its successor Stichbandkeramik (SBK or Stroke-Ornamented Pottery), for example at the site of Eythra (Cladders et al., Reference Cladders, Stäuble, Tischendorf, Wolfram and Smolnik2012). Bohemia, another large LBK settlement area to its south-east, shows a similar pattern of cultural and demographic continuity into the mid-7th millennium BP, with a population peak c.6800 BP (Demján and Dreslerová, Reference Demján and Dreslerová2016).
These large-scale patterns are confirmed by evidence from specific local regions. They are seen, for example, in the abandonment of the Aldenhovener Platte region of western Germany (Zimmermann, Reference Zimmermann2002) and of the LBK areas of the Netherlands (Crombé and Vanmontfort, Reference Crombé, Vanmontfort, Whittle and Cummings2007), as well as in pollen and settlement evidence from Hesse (Eisenhauer, Reference Eisenhauer and Beier1994; Schweizer, Reference Schweizer, Eckert, Eisenhauer and Zimmermann2003) showing a marked decrease in occupation intensity at the end of the LBK. The Hegau region of south-west Germany shows a similar picture, as does the Upper Rhine area, with a gap between the end of the LBK and the beginning of the subsequent Hinkelstein phase (Denaire et al., Reference Denaire, Lefranc and Wahl2017). Climatic factors may have been relevant to these collapses though the evidence so far is equivocal (Schmidt et al., Reference Schmidt, Gruhle and Rück2004; Gronenborn et al., Reference Gronenborn, Strien, Dietrich and Sirocko2014). Simulations of climatic impacts on the LBK settlement system (Bocquet-Appel et al., Reference Bocquet-Appel, Moussa, Dubouloz, Giligny, Djindjian and Costa2015) show that adverse conditions could have an impact on the size of the population but it is short-lived: population ‘bounces back’ very quickly. Accounting for the longer-term population decreases or regional abandonments that occurred remains problematical, and the same is true of other features of the LBK. What was it about the LBK farming system that meant that it did not expand beyond the narrow band of loess soils, which would obviously have solved local pressure problems? Given the apparent availability in some regions of suitable settlement areas that were never occupied, as we saw above, were there other limitations that contributed to the crisis in many regions? These are questions that remain to be addressed.
Cultural Transmission, Niche Construction and the LBK
We have seen that the LBK was overwhelmingly a demographic expansion, into which small numbers of hunter-gatherers were absorbed. In such a context, as we would expect, we see the wholesale transmission of a way of life from one generation to the next and from one place to the next. Because of its dependence on annual cereals and mobile domestic animals it was a very portable way of life that was extremely successful, though only within a limited range of environmental conditions. That way of life had developed in the western Carpathian Basin in the mid-8th millennium BP, in the context of the innovations and drift associated with the cultural equivalent of peripatric speciation. It included the material resources represented by crops and animals as well as traditions of social, cultural and economic knowledge and practice. Some of those practices were the basis for the expansion, for example in the area of subsistence and perhaps the social relations reflected in the longhouses. Others, like the pottery decoration for example, would have been simply the ‘cultural baggage’ associated with the expanding population and largely governed by fashion and drift. Because people and practices had a recent common origin, communities in Poland and the Paris Basin, for example, were similar in many respects to one another, no doubt they had a common language, though regional differences would gradually have developed. The vertical transmission implied by the strong correlation between genetic and cultural patterns would have been inherently conservative. In other words, once the initial successful formula had been established it would have been hard to imagine alternatives.
In the next chapter we will see that many of the patterns and processes characteristic of the LBK can be found in the spread of farming along the north coast of the Mediterranean.


