Across various social domains, including speech communication, perception of others can largely be seen as a problem-solving task, one in which impressions are formed based on a combination of concrete knowledge and assumptions about an individual or group (e.g., Yzerbyt, Schadron, Leyens, & Rocher, Reference Yzerbyt, Schadron, Leyens and Rocher1994). When these impressions are formed, however, concrete knowledge is often relegated to the background in favor of socially constructed beliefs, resulting in skewed or overgeneralized judgments known as stereotyping or biases (e.g., Stroebe & Insko, Reference Stroebe, Insko, Bar-Tal, Graumann, Kruglanski and Stroebe2013). Socially constructed biases thus reflect the imbalance between real evidence and perceivers’ views acquired through their experience in a given environment, and these attitudes are often used to justify dislike of those considered to be different based on misinformation and unfounded beliefs. The chief objective of this study was to extend prior research on socially constructed biases to the domain of second language (L2) speech. Specifically, the goal was to determine the extent to which social biases can be manipulated—within a speech rating task—to influence listeners’ judgments of L2 speakers in terms of global dimensions of L2 speech (accentedness, comprehensibility, flow) and its specific characteristics (segmental accuracy, intonation).
LINGUISTIC STEREOTYPING
Humans generally seek to construct a favorable identity and secure their membership as part of an “in group” (i.e., the group to which they belong) by comparing themselves to outsiders; these comparisons frequently involve linguistic factors, including dialectal variations in pronunciation and speech colored by features common to other languages (e.g., Bourhis, Sioufi, & Sachdev, Reference Bourhis, Sioufi, Sachdev and Giles2012; Giles & Watson, Reference Giles and Watson2013). For instance, as demonstrated in Labov’s (1972) classic study, speakers can use their pronunciation (e.g., variation in vowel quality) to create an identity so as to differentiate themselves from members of other groups. It is now common knowledge that speakers use language as a primary group distinction when judging others, exploiting variations in speech to make inferences about speakers’ social groups and attributing (often stereotypical) judgments to these speakers and their groups (e.g., Bourhis et al., Reference Bourhis, Sioufi, Sachdev and Giles2012; Dragojevic, Gasiorek, & Giles, Reference Dragojevic, Gasiorek, Giles, Berger and Roloff2016; Ryan, Reference Ryan1983; Wigboldus, Spears, & Semin, Reference Wigboldus, Spears and Semin2005).
Ensuing speech-based attitudes can be positive. For instance, Dalton-Puffer, Kaltenboeck, and Smit (Reference Dalton-Puffer, Kaltenboeck and Smit1997) found that native speakers of British English with a Received Pronunciation (RP) accent were rated by L2 learners as more courteous, educated, and organized than those with other native accents. This stereotypical attitude is not particularly harmful to those who speak with a RP accent, but it may lead to unfair generalizations about those speakers who do not. However, most frequently, speech-based attitudes are negative, especially when expressed by majority groups targeting minority status speakers. For example, in an early study, Ryan, Carranza, and Moffie (Reference Ryan, Carranza and Moffie1977) showed that native English listeners’ evaluations of L2 speakers were strongly associated with speakers’ accents, such that listeners judged Spanish speakers with heavy accents in English to be of lower status (in terms of their eventual occupation), to be lower in solidarity (in terms of the likelihood of becoming friends), and to generally speak less pleasantly. Similarly, compared to speakers of regional and standard dialects, L2 speakers in the United States reported feeling more stigmatized by native speakers and expressed weaker affiliation to the country, with stronger accents associated with the perception of being an outsider (Gluszek & Dovidio, Reference Gluszek and Dovidio2010a; Gluszek, Newheiser, & Dovidio, Reference Gluszek, Newheiser and Dovidio2011).
Attitudes toward specific cultural groups, societal norms regarding minority speakers, and the importance of language to a particular society—including how it is used in education, politics, and the media—can all influence listener perception and stigmatization of L2 speakers (see Gluszek & Dovidio, Reference Gluszek and Dovidio2010b). However, it appears that expectations might influence listeners’ attitudes and behaviors at least as much as the actual speech they hear (Lindemann & Subtirelu, Reference Lindemann and Subtirelu2013). This was the case in Lindemann’s (2002) study, which paired native English speakers with native Korean speakers in an interactive task in English. Throughout the task, some native English speakers who had been identified as having negative attitudes toward Koreans refrained from communicating vital information to their partners or neglected to acknowledge communication from them. These speakers also reported their interactions to be less successful than did those native speakers who were identified as having positive attitudes toward Koreans. Indeed, most observed instances of avoidance and problematizing involved the “negative attitude” participants, implying that attitudes of the listener prevail over proficiency of the speaker.
Biases become even more problematic when linguistic differences are used to judge speakers based on imagined or preconceived ideas. Kang and Rubin (Reference Kang and Rubin2009) define this type of bias as reverse linguistic stereotyping, or the process by which general attributes of a speaking community negatively influence how a speaker is perceived, often through reference to characteristics that are completely imagined. For example, in a study of Grade 3 and 4 schoolchildren, Ford (Reference Ford1984) showed that teachers preferred the writing samples produced by students when those samples were paired with the speech of native English speakers than when paired with the speech of Spanish-accented L2 learners, regardless of which learners produced the written work. In a striking demonstration, Rubin (Reference Rubin1992) showed that native listeners attributed strong accent to a university lecture when paired with an image of a Chinese-looking female and, in fact, understood significantly less content from this lecture, compared to the same lecture paired with an image of a Caucasian female, even though the audio was recorded in both instances by the same native English speaker from Ohio.
Stereotypical judgments of this kind generally reflect people’s individual experiences. In a study of 158 culturally diverse individuals (i.e., native and L2 speakers with various levels of exposure to, education in, and experience with English), Kang and Rubin (Reference Kang and Rubin2009) showed that speech ratings were influenced by rater background in that listeners with less exposure to L2 speakers in their daily lives both rated the same English speech sample less favorably (in terms of quality of instruction and perceived “standardness” of accent) and understood less of what was being said when it was presented under the guise of an East Asian L2 English speaker rather than a Euro-American native English speaker. Similarly, Hu and Lindemann (Reference Hu and Lindemann2009) showed that Cantonese speakers of L2 English were evaluated significantly higher in three out of four rating tasks when listeners were told that the speech sample they heard belonged to an English speaker from the United States as opposed to when they were told that it belonged to an English speaker from China. In sum, listeners’ evaluations of other speakers’ linguistic performance—particularly the performance by L2 speakers—are often influenced by listeners’ beliefs, expectations, experiences, and stereotypical views rather than the speakers’ actual performance.
MANIPULATING SOCIAL BIAS
The special role of speech as a source of stereotyping and social biases is unsurprising, given that preference for familiar speech patterns emerges in the first year of a child’s life (e.g., Kinzler, Dupoux, & Spelke, Reference Kinzler, Dupoux and Spelke2007) and that speech acts as a dominant cue guiding children’s and adults’ perceptions and actions, for example, when choosing friends (e.g., Girard, Floccia, & Goslin, Reference Girard, Floccia and Goslin2008). Speech patterns are also prioritized over other sources of bias such as race, gender, or appearance (e.g., Kinzler, Shutts, DeJesus, & Spelke, Reference Kinzler, Shutts, DeJesus and Spelke2009; Rakić, Steffens, & Mummendey, Reference Rakić, Steffens and Mummendey2011). What is surprising, however, in light of the important role of speech in guiding listeners’ attitudes and behaviors, is that little research has targeted the impact of socially constructed biases on listeners’ evaluations of L2 speech. In fact, most work in this area (as reviewed in the preceding text) has been concerned with documenting listeners’ attitudes toward various types of native and nonnative speech patterns, labeled as “accents” (e.g., Beinhoff, Reference Beinhoff2013; Giles & Rakić, Reference Giles, Rakić and Holtgraves2014), but not with examining relative effects of various degrees of socially constructed biases on listeners’ assessments of L2 speech, for instance, in terms of global dimensions (e.g., comprehensibility, fluency) or specific characteristics (e.g., segmental, suprasegmental accuracy). Because listener-based evaluations of L2 speech are common to both research settings (e.g., Derwing & Munro, Reference Derwing and Munro2015) and assessment contexts (e.g., Harding, Reference Harding2012; Isaacs, Reference Isaacs and Kunnan2013), understanding the impact of social biases on listener evaluations of L2 speech is a priority.
Several strands of prior research suggest that socially constructed biases can be manipulated to the extent that they could produce varying degrees of impact on listeners’ evaluations of speech. For instance, research focusing on bias reduction through explicit training has shown that socially constructed attitudes can be mitigated through instruction. Staples, Kang, and Wittner (Reference Staples, Kang and Wittner2014) involved native-speaking undergraduate students in informal, cooperative contact activities with L2 speakers for eight weeks. At the end of the intervention, the contact group, compared to the noncontact group, rated L2 instructors as being less accented, more comprehensible, and having greater teaching ability (see also Kang, Rubin, & Lindemann, Reference Kang, Rubin and Lindemann2015). In another training study, Derwing, Rossiter, and Munro (Reference Derwing, Rossiter and Munro2002) exposed three groups of native-speaking students enrolled in a social work class to various combinations of exposure to L2 speech, cross-cultural discussion, and instruction on specific pronunciation targets, all with a focus on Vietnamese-accented speakers of L2 English. Following an eight-week intervention, there were no clear effects of exposure and explicit teaching about the features of Vietnamese-accented English on listeners’ ability to understand it. However, listeners reported improved confidence that they could interact with L2 speakers, attributing that confidence to instruction.
Explicit instruction is not the only means to influence socially constructed biases toward speech. Niedzielski (Reference Niedzielski1999), for example, showed that American listeners differed significantly in their perception of vowel sounds produced by the same speaker as a function of a single piece of information provided about the speaker, namely, whether the speaker was a resident of the United States or Canada. Furthermore, even a general social bias against L2 speakers can be manipulated, as demonstrated through Hansen, Rakić, and Steffens’s (Reference Hansen, Rakić and Steffens2014) study of 42 German speakers who were asked to judge the competence and employability of native Turkish speakers of L2 German. Researchers were able to mitigate listener bias against L2 speakers by engaging listeners in “perspective taking.” Those listeners who had the opportunity to use their L2 (English) in a brief exchange with a research confederate prior to the rating session provided higher ratings for L2 German speakers, compared to listeners who did not engage in L2 production before rating. L2 learner performance can also be manipulated through socially constructed biases. Paladino et al. (Reference Paladino, Poddesu, Rauzi, Vaes, Cadinu and Forer2009), for instance, found that Italian participants underperformed in written and oral tests of L2 German when simply reminded of the widely held perception that Italians of the region were known to have poor ability in German.
THE CURRENT STUDY
If socially constructed biases can be manipulated through instruction by engaging language users in particular experiences, or simply through providing (and even merely implying) certain information, then it is important to determine the degree to which listeners’ speech ratings are susceptible to such manipulations. Should L2 speech ratings be shown to be easy to influence—by highlighting listeners’ existing biases or by creating new ones—such findings could have consequences for the validity of speech ratings carried out in various settings (Derwing & Munro, Reference Derwing and Munro2015). Despite the abundance of research on ways to influence language users (see Molden, Reference Molden2014), the current study is among the first in the field of L2 speech learning to subtly incorporate a social bias into the rating task and to examine social influences on multiple rated measures of L2 speech as assessed by naïve, untrained listeners. These rated measures captured global listener-based characteristics of L2 speech such as comprehensibility (ease or difficulty of understanding), accentedness (extent to which a speaker sounds nativelike), and flow (overall pacing and speed of utterance delivery). The measures also included specific listener-based accuracy measures, targeting individual segments (accuracy in production of consonants and vowels) and intonation (natural rise and fall in pitch, speech melody).
The chief objective of this study was to determine the effect of deliberate positive and negative social bias manipulation on listeners’ ratings of native French speakers of L2 English from Quebec. Immediately before the rating task, one third of the listeners heard a short (scripted and rehearsed but naturally delivered) personal opinion by the researcher praising L2 English skills of native French speakers. Another third of the listeners heard a personal opinion by the researcher criticizing L2 English skills of native French speakers, while the remaining third of the listeners were exposed to no biasing opinion. The assumption guiding this study was that a fleeting bias introduced at the outset of a rating session (in a social environment with a history of tension between English- and French-speaking communities) would either enhance or suppress the ratings provided by naïve listeners, relative to the ratings of listeners who were not exposed to a social bias manipulation.
Because the impact of social bias on listeners’ judgments of L2 speech is likely influenced by their specific experiences (e.g., Kang & Rubin, Reference Kang and Rubin2009; Wigboldus et al., Reference Wigboldus, Spears and Semin2005), the naïve, untrained listeners for this study were recruited to represent a broad age range (18–72). Our working assumption was that older and younger listeners would differ in the extent to which they were impacted by the 1977 French Language Charter (Bill 101), which designated French as the sole official language of Quebec and restricted the use of English in public domains (including education) as a way of strengthening the ethnolinguistic vitality of Francophones in Quebec (Corbeil, Reference Corbeil2007). Older listeners (e.g., those older than 40) would represent members of Quebec’s anglophone community who had been children or young adults when the status of English changed from majority to minority, which might make them particularly sensitive to the issues surrounding the status of English in Quebec. In contrast, younger listeners would be considered Quebec’s anglophones who had been raised and schooled at a time when the official status of French would be less contested, which might make these listeners less sensitive to English-centered social bias. Therefore, a more specific prediction was that, if present, the effect of a social bias manipulation might be qualified by listeners’ age (a continuous variable in this study), such that bias may be more pronounced for older than younger listeners. The following research question guided the study: Does a social bias manipulation (positive or negative) influence the ratings of listeners of different ages in terms of the comprehensibility, accentedness, consonant and vowel errors, intonation, and flow of L2 speech?
METHOD
LISTENER GROUPS
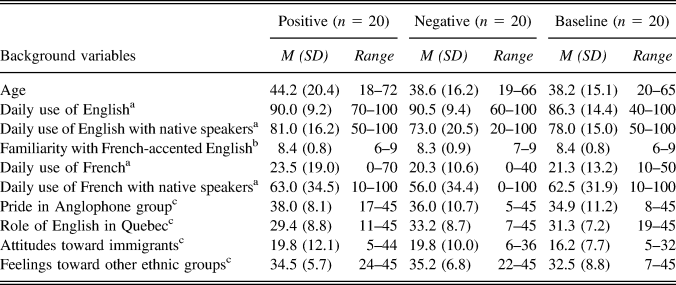
Listeners included 60 native English speakers (36 females, 24 males), all self-identified members of the English-speaking anglophone community of Quebec and all residents of Montreal. All listeners were born and raised in monolingual English households in Quebec and most (37) were schooled in English, with 21 listeners reporting bilingual English-French education at the secondary level, one reporting English-Hebrew education at the elementary level, and one reporting French immersion at the elementary level. Of the 60 listeners, 17 graduated from a junior college and 46 were finishing or had already obtained a postsecondary degree. Most (51) listed English as their ethnic language; of the nine remaining, one provided no language, and the others listed Italian (2), Urdu (2), Kanienkeha (Mohawk) (1), Hebrew (1), Yiddish (1), and Hungarian (1). Three were employed at an English-speaking university in administrative or support positions, while the remaining were professionals unaffiliated with educational institutions or students outside of language-related disciplines. When asked to rate how well specific labels describe them on a 9-point scale (1 = “not at all,” 9 = “perfectly”), listeners clearly preferred the “Canadian” (M = 8.3, range = 1–9) and the “Anglophone Quebecer” (M = 7.7, range = 1–9) labels to the “French Canadian” (M = 2.2, range = 1–9) and the “Quebecois” (M = 3.9, range = 1–9) labels. As shown in Table 1, which summarizes listeners’ background characteristics, all listeners reported knowledge of French and high familiarity with French-accented English.
Listeners’ background characteristics

a Based on a 0–100% scale.
b Based on a 1–9 scale (1 = “not at all,” 9 = “very much”).
c Sum of the question responses (max = 45) targeting this construct (see Appendix 1), based on a 1–9 scale (1 = “disagree,” 9 = “agree”).
The 60 listeners were randomly assigned to three experimental groups (n = 20), then exposed to either a positive manipulation (12 females, 8 males), a negative manipulation (11 females, 9 males), or no manipulation (13 females, 7 males) before the rating task. The group receiving no manipulation was designated as the baseline listener group. As indicated by nonsignificant results of Levene’s tests of homogeneity of variance (p > .05), all demographic, background, and social attitudinal variables for the three listener groups, except for listener age (where a Levene’s test yielded a significant value at p = .003), included similar data distributions within the three groups. Therefore, as suggested by Field (Reference Field2009), for between-group comparisons, we report F statistics (equal variances assumed) in all cases except comparisons of age, for which we report Welch’s F (equal variances not assumed). As shown in Table 1, the three groups did not differ significantly in any background or language variables, F(2, 57) < 1.08, p > .35, including age, Welch’s F(2, 37.48) = .63, p = .54;Footnote 1 responses to a social attitudes questionnaire (see Appendix 1) targeting the strength of listeners’ pride for their ethnic group (5 questions, Cronbach’s ɑ = .90); their perception of the role of English in Quebec (5 questions, ɑ = .71); their attitudes toward immigrants (5 questions, ɑ = .86); and their feelings toward other ethnic groups (5 questions, ɑ = .76), F(2, 57) < 1.04, p > .36.Footnote 2 While most listeners (58) reported normal hearing, one listener each in the positive and negative bias groups indicated having hearing issues (partial hearing loss in one ear, perception difficulty with low registers). Excluding these two listeners from analyses resulted in no change in the findings; therefore, the reported analyses included the entire dataset of 60 listeners.
SPEECH MATERIALS
The target audio samples evaluated by listeners included the speech of 40 Quebec francophones (27 women, 13 men) from the dataset analyzed by Isaacs and Trofimovich (Reference Isaacs and Trofimovich2012). All were native speakers of French born and raised in French-speaking Quebecois families and schooled exclusively in French (M age = 35.6 years, range = 18–61). The speakers recorded brief narratives in English in response to the “Suitcase Story”—an eight-panel picture story describing two passers-by who ran into each other at a busy intersection and inadvertently took each other’s similar-looking suitcases (Derwing, Rossiter, Munro, & Thomson, Reference Derwing, Rossiter, Munro and Thomson2004). The samples included approximately the first 30 seconds of each narrative (23–36 seconds) with initial disfluencies (including false starts and hesitations) removed.
RATING PROCEDURE
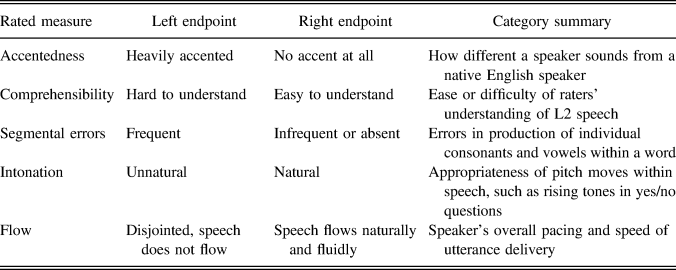
The rating procedure was the same across all listener groups. Each listener, tested individually, provided two sets of ratings in the same sequence: two global variables (accentedness, comprehensibility) and three specific pronunciation variables (segmental errors, intonation, flow), all summarized in Table 2. The ratings were carried out in the same session using 1,000-point sliding scales programmed in the custom-built speech evaluation software Z-Lab (Yao, Saito, Trofimovich, & Isaacs, Reference Yao, Saito, Trofimovich and Isaacs2013). The endpoints of each scale were not labeled numerically, and the scale contained no interval markings; however, the endpoints were identified as negative (frowning face) and positive (smiling face) and corresponded to the ratings of 0 and 1,000. The scales for accentedness and comprehensibility appeared on screen together, and listeners were required to listen to each sample (presented in randomized order) once before providing their ratings, on the assumption that accent and comprehensibility reflect initial, intuitive perceptual judgments. The scales for the remaining three variables (segmental errors, intonation, flow) also appeared together, but listeners were permitted to replay each sample multiple times after the initial playback before providing their ratings.
Summary of rated categories with scalar endpoint descriptors (0–1,000)

At the beginning of each session, listeners were first shown the picture story described by the speakers. They were then instructed about each rating category using definitions and examples and were asked to evaluate three extra practice samples before proceeding to rate the 40 target speech samples (using headsets). The critical manipulation involved the researcher providing a memorized and well-rehearsed biasing anecdote to listeners after they rated the practice samples, which was casually shared as the researcher made necessary adjustments to the computer to close the practice sample file and open the target sample file. In the negative manipulation group, listeners heard a short (scripted and rehearsed but naturally delivered) personal opinion by the researcher about her experience getting food at a local eatery prior to the experiment and not being served adequately in English by a native French-speaking employee who, according to the researcher, had an atrocious accent, had poor grammar, and had not bothered to learn the other official language of Canada. In the positive manipulation group, listeners heard a comparable opinion of the same length and emotional content, except that it shared the researcher’s positive experience at the same local eatery where she had been served by a native French-speaking employee whose accent and grammar were excellent and who, according to the researcher, made a great effort to learn the other official language of Canada (see Appendix 2 for full scripts). Listeners in the baseline group received no social bias manipulation.
At the end of the session, listeners filled out a language background questionnaire, a social attitudes questionnaire, and the final debrief questionnaire, which asked them to retrospectively judge the pleasantness of the rating session, the researcher’s helpfulness, the rating task difficulty, and their confidence in rating, using 100-millimeter continuous semantic differential scales (see Appendix 3). Listeners were invited to comment about any part of their interaction with the researcher that might have affected their ratings. They were also debriefed after each session; these final comments, as well as detailed notes about listeners’ reactions during the session, were recorded as field notes by the researcher.
DATA ANALYSIS
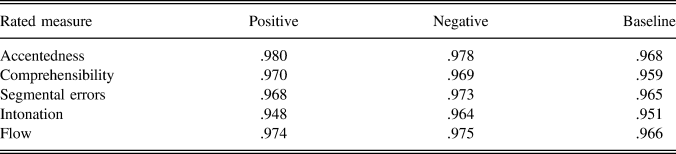
All ratings within each listener group were first checked for internal consistency (Cronbach’s ɑ). As shown in Table 3, listeners were highly consistent in their ratings, with reliability indexes falling within the .95–.98 range, which is comparable to reliability estimates reported previously with similar rater samples (e.g., Derwing & Munro, Reference Derwing and Munro1997). The debrief questionnaire responses were scored in terms of the distance (in millimeters) between the left endpoint of the scale and the listener’s mark (cross or checkmark) on the 100-millimeter scale. Comparisons of these ratings confirmed that the three listener groups did not differ in their reactions to the session or the researcher (equal variances assumed based on nonsignificant results of Levene’s tests), F(2, 57) < 1.26, p > .29,Footnote 3 finding the experience pleasant (M positive = 84.2, M negative = 87.0, M baseline = 92.8) and the researcher helpful (M positive = 95.1, M negative = 94.6, M baseline = 97.8), or in their understanding and use of the rating criteria, evaluating task difficulty similarly (M positive = 71.5, M negative = 70.6, M baseline = 74.0) and being similarly confident in their speech ratings (M positive = 80.0, M negative = 73.9, M baseline = 81.6).
Interrater reliability across listener groups (Cronbach’s ɑ)

The field notes were analyzed broadly for direct quotes from the listeners reflecting their awareness of a bias manipulation and their positive or negative stance toward any aspects of L2 speech. Because the field notes contained spontaneous, unstructured reflections (as opposed to elicited responses to a predefined question set), these analyses were descriptive and used for illustrative purposes only. Before the purpose of the experiment was revealed to them at the end of the session, all listeners responded “no” or “not really” to the question asking if they thought anything that the researcher said influenced their ratings, occasionally commenting on the helpfulness of the researcher (e.g., “she just made me more comfortable and I listened to her instructions,” “she was very clear without being leading,” “she made me feel very at ease,” “I was completely objective with no bias”). Therefore, the three listener groups appeared to be similarly unaware of the social bias manipulation and seemed comparable in their reactions to the researcher and the testing situation.Footnote 4
To determine the effect of social bias manipulation on L2 speech ratings, multilevel linear models were computed in R (Bates, Mächler, Bolker, & Walker, Reference Bates, Mächler, Bolker and Walker2015) using the nlme package (Pinheiro, Bates, DebRoy, Sarkar, and R Core Team, Reference Pinheiro, Bates, DebRoy and Sarkar2018). Multilevel linear models are generally not subject to the assumptions of homogeneity of regression slopes and data independence and can also cope with missing data, which makes these models a robust alternative to ANOVAs (see Field, Reference Field2009). In each set of models, the relevant speech rating (accentedness, comprehensibility, segmental errors, intonation, flow) served as the dependent variable, with social bias manipulation (negative, positive, baseline), listeners’ age (continuous variable), and social bias × age interaction as fixed factors, random intercepts for speakers and listeners, and random slope for social bias. The baseline listener group was designated as the reference group. Model fit was evaluated through a chi-square test on each successive model, proceeding from simpler to more complex models, with a more complex model adopted only when it improved fit. Prior to reporting each final model, we established that random intercepts and (where appropriate) also random slopes across the three groups were distributed normally; these assumptions were met. For all model parameters, 95% confidence intervals (CIs) were derived to determine the statistical significance of each parameter (i.e., interval does not cross zero). Whenever listeners’ ratings were predicted by a significant social bias × age interaction, this interaction was broken down by fitting separate multilevel models for younger versus older listeners (using the median value of 31.5 years for listener grouping but treating age as a continuous variable within each group) with social bias as a fixed factor.
In the last step, to account for potential effects of listeners’ individual experience with L2 English speech and their preexisting social biases, the final model for each dependent variable was updated by using an additional seven predictors as fixed factors—(a) listeners’ familiarity with French-accented English, (b) amount of daily use of French, (c) amount of daily use of French with native French speakers, (d) listeners’ pride for their ethnic group, (e) their perception of the role of English in Quebec, (f) their attitudes toward immigrants, and (g) their feelings toward other ethnic groups. Because of space limitations, the results of multilevel modeling are illustrated graphically only for the ratings of accentedness and comprehensibility (which are representative of all findings). Appendix 4 includes color figures illustrating the full dataset.
RESULTS
SOCIAL BIAS AND L2 SPEECH RATINGS
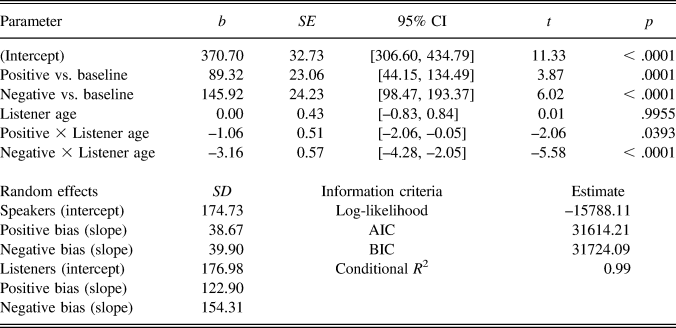
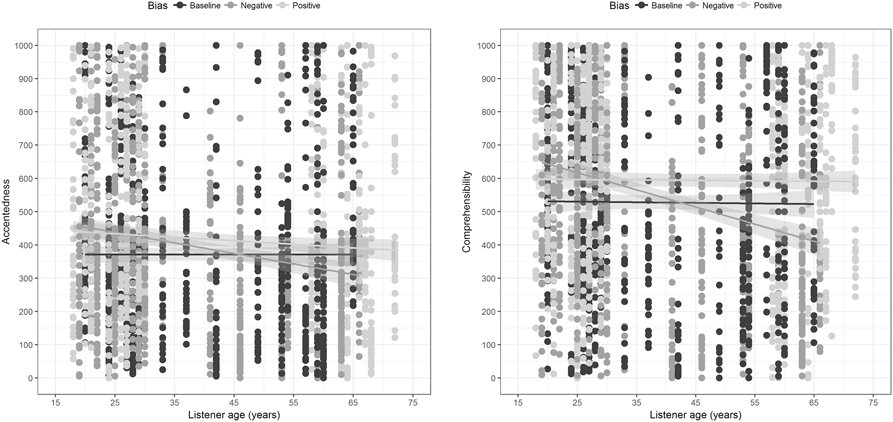
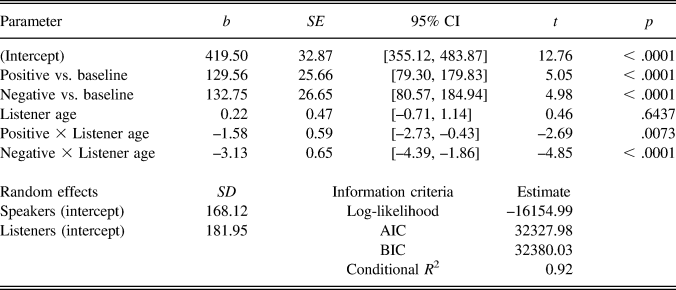
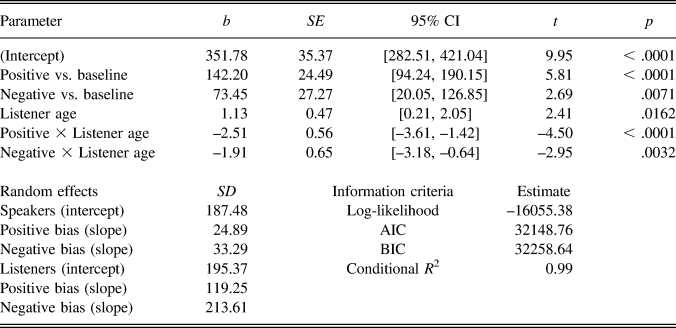
The results of multilevel modeling for accentedness are summarized in Table 4 and illustrated graphically in Figure 1 (left panel), which depicts the relationships between listeners’ age and accentedness ratings separately for each listener group. As shown in Table 4, there was a significant effect of positive bias, relative to baseline listeners’ performance. However, this effect was qualified by a significant age-based interaction. This interaction was driven by younger listeners upgrading speakers to a greater extent (+63 points on a 1,000-point scale), b = 62.59, t(1158) = 4.16, p < .0001, 95% CI [33.11, 92.07], compared to older listeners (+23 points only), b = 22.58, t(1158) = 1.77, p = .0777, 95% CI [–2.48, 47.63], relative to baseline listeners’ ratings. There was also a significant effect of negative bias, which was further qualified by an interaction. Younger listeners upgraded speakers (+80 points), b = 80.01, t(1158) = 5.18, p < .0001, 95% CI [49.74, 110.27], while older listeners downgraded them (–32 points), b = –32.47, t(1158) = –2.51, p = .0124, 95% CI [–57.86, –7.07], relative to baseline listeners’ scores.
Model for accentedness with baseline group used as the reference level

Notes: AIC = Akaike information criterion, BIC = Bayesian information criterion. Conditional R 2 = variance explained by fixed and random factors.
Scatterplot of accentedness (left panel) and comprehensibility (right panel) ratings as a function of listeners’ age, with regression lines depicting the best linear fit for each listener group and shaded areas encompassing 95% confidence intervals.

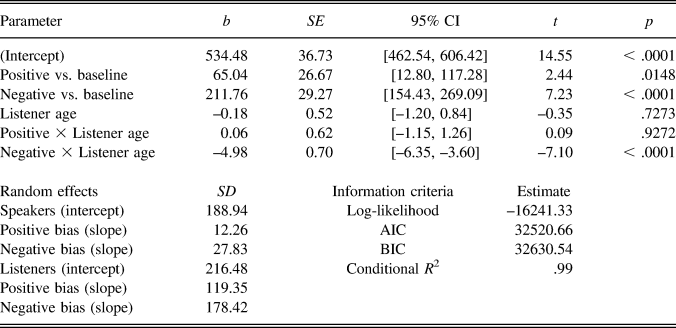
The results of multilevel modeling for comprehensibility, summarized in Table 5 and illustrated in Figure 1 (right panel), revealed a significant effect of positive bias, with no significant interaction. Regardless of age, positively oriented listeners provided significantly higher ratings (+65 points), relative to the performance of baseline listeners. However, the effect of negative bias was qualified by an age-based interaction. As with the ratings of accentedness, younger listeners upgraded speakers (+74 points), b = 73.84, t(1158) = 4.64, p < .0001, 95% CI [42.67, 105.00], while older listeners downgraded them (–35 points), b = –34.75, t(1158) = –2.24, p = .0256, 95% CI [–65.21, –4.29], relative to baseline listeners’ scores.
Model for comprehensibility with baseline group used as the reference level

Notes: AIC = Akaike information criterion, BIC = Bayesian information criterion. Conditional R 2 = variance explained by fixed and random factors.
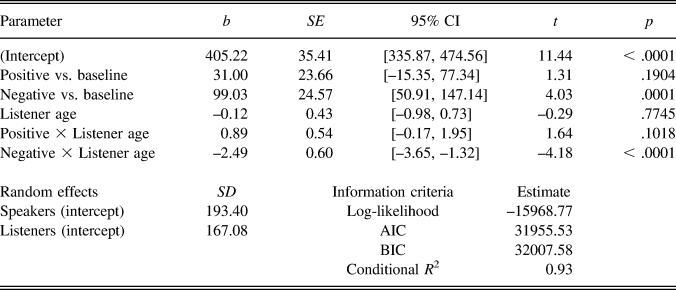
For segmental errors (summarized in Table 6), there was no significant effect of positive bias, meaning that positively oriented listeners and baseline listeners rated speakers similarly regardless of listeners’ age. However, the statistically significant effect of negative bias was qualified by an interaction, such that younger listeners upgraded speakers in their ratings (+31 points), b = 31.13, t(1158) = 2.53, p = .0115, 95% CI [7.03, 55.23], while older listeners showed a (nonsignificant) tendency to downgrade the same speakers (–25 points), b = –25.35, t(1158) = –1.90, p = .0581, 95% CI [–51.53, 0.84], relative to baseline listeners scores.
Model for segmental errors with baseline group used as the reference level

Notes: AIC = Akaike information criterion, BIC = Bayesian information criterion. Conditional R Footnote 2 = variance explained by fixed and random factors.
As summarized in Table 7, for ratings of intonation, multilevel modeling revealed significant effects of positive and negative bias, with both effects qualified by interactions. Under positive bias, the interaction effect was driven by younger listeners providing higher intonation ratings (+83 points), b = 83.09, t(1158) = 6.04, p < .0001, 95% CI [56.15, 110.02], compared to older listeners’ ratings (+39 points), b = 39.37, t(1158) = 2.82, p = .0048, 95% CI [12.05, 66.69], with both younger and older listeners upgrading speakers in their ratings, relative to baseline listeners’ scores. Under negative bias, younger listeners upgraded speakers (+61 points), b = 61.47, t(1158) = 4.47, p < .0001, 95% CI [34.53, 88.40], while older listeners downgraded them (–37 points), b = –37.34, t(1158) = –2.68, p = .0075, 95% CI [–64.66, –10.02], relative to baseline listeners’ performance.
Model for intonation with baseline group used as the reference level

Notes: AIC = Akaike information criterion, BIC = Bayesian information criterion. Conditional R 2 = variance explained by fixed and random factors.
Finally, for the ratings of flow (summarized in Table 8), multilevel modeling showed significant effects of positive and negative bias, with both effects qualified by interactions. Under positive bias, the interaction was driven by younger listeners providing higher flow ratings (+70 points), b = 70.43, t(1158) = 5.48, p < .0001, 95% CI [45.22, 95.63], compared to the scores by baseline listeners, whereas older listeners’ ratings did not differ from baseline listeners’ assessments, b = 5.48, t(1158) = 0.39, p = .6952, 95% CI [–21.92, 32.88]. Under negative bias, younger listeners upgraded speakers (+26 points), b = 26.16, t(1158) = 2.03, p = .0421, 95% CI [0.96, 51.36], while older listeners showed a (nonsignificant) tendency to downgrade speakers (–26 points), b = –25.93, t(1158) = –2.68, p = .0639, 95% CI [–53.33, 1.47], relative to baseline listeners’ scores.
Model for flow with baseline group used as the reference level

Notes: AIC = Akaike information criterion, BIC = Bayesian information criterion. Conditional R 2 = variance explained by fixed and random factors.
LISTENERS’ EXPERIENCE AND PREEXISTING SOCIAL BIAS
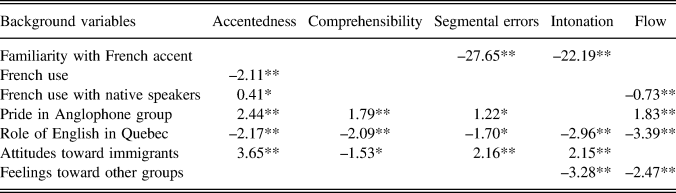
A series of models with additional predictors used to account for listeners’ prior experience and preexisting biases yielded the findings that were identical to those reported previously through simpler models (as summarized in full in Appendix 5). However, these analyses also revealed several additional findings regarding the contributions of experiential and social variables to listener assessments of L2 speech. As summarized in Table 9, which lists statistically significant b values for relevant predictors, listeners’ familiarity with French-accented English contributed negatively to the ratings of intonation and flow, resulting in a decrease in ratings by about 22–28 points as listeners’ familiarity rating increased by 1 point on a 9-point self-rated familiarity scale. Listeners’ self-rated use of French contributed negatively to the ratings of accentedness (with ratings being lower by about 21 points for every 10% increase in self-reported L2 French use), while self-reported French use with native speakers of French yielded trivial contributions to the ratings of accentedness and flow. Finally, self-rated social variables demonstrated consistent, albeit small, effects on listener assessments. In general, a stronger sense of pride for listeners’ ethnic group and stronger anti-immigrant sentiments were associated with higher ratings for four speech measures (12–37 points higher for a 10-point increase on the 45-point social scale). Stronger beliefs about the role of English in Quebec and more positive feelings about other ethnic groups were linked to lower ratings for five and two speech measures, respectively (17–34 points lower for a 10-point increase on the 45-point scale).
Summary of listener background variables predicting L2 speech ratings

Note: **p < .001, *p < .01.
DISCUSSION
This study was motivated by research into the manipulation of socially constructed biases and stereotypes (e.g., Hansen et al., Reference Hansen, Rakić and Steffens2014; Paladino et al., Reference Paladino, Poddesu, Rauzi, Vaes, Cadinu and Forer2009), with the view of extending research into what are generally understood to be stable ratings of L2 speech (e.g., Derwing & Munro, Reference Derwing and Munro2015). The main goal was to determine whether ratings provided by listeners exposed to either a positive or a negative anecdote about L2 English skills of native speakers of Quebec French immediately before the rating task would differ from ratings provided by listeners who heard no anecdote. We also sought to clarify whether effects of a bias manipulation would depend on listeners’ age (i.e., for listeners representing different generations).
In brief, we found strong, consistent effects of both positive and negative bias manipulation, relative to the performance of baseline listeners, with these effects dependent on listeners’ age. Positively oriented younger listeners provided higher ratings for four of the five measures (accentedness, comprehensibility, intonation, flow), upgrading speakers by 63–83 points, compared to baseline listeners’ assessments. Positively oriented older listeners also upgraded speakers (39–65 points higher) relative to baseline listeners’ ratings, but only for two measures (comprehensibility, intonation). However, the rating behaviors of younger and older listeners diverged under a negative bias manipulation. Negatively oriented younger listeners provided more favorable ratings for all five measures (26–80 points higher), compared to baseline listeners’ assessments. By contrast, negatively oriented older listeners downgraded the same speakers relative to baseline listeners’ ratings (25–37 points lower) for all measures (most notably, accentedness, comprehensibility, and intonation). These effects held even after several experiential and social variables had been factored into multilevel models (see Appendix 5).
ROLE OF SOCIAL BIAS MANIPULATION
The three target listener groups did not differ in terms of strength of pride for their ethnic group; their perception of the role of English in Quebec; their attitudes toward immigrants and other ethnic groups; their reactions to the rating session and the researcher; or their understanding and use of the rating criteria. Furthermore, potential preexisting individual differences across listeners (i.e., in experience with L2 English speech by Quebec French speakers) were also factored into statistical analyses and used as predictors. Therefore, the obtained differences between the groups’ ratings are most likely attributable to the social bias manipulation. Setting listener age aside, social manipulations produced an effect on listeners—either positive or negative—affecting all speech measures.
These results support research pointing to the powerful role of stereotypes in listeners’ reactions to speech (e.g., Gluszek & Dovidio, Reference Gluszek and Dovidio2010b). Exposure to a short anecdote about L2 speech may have been sufficient for listeners in the negative manipulation group (particularly those who were older than the median age of 31.5 in the current sample) to regard French speakers of English as out-group members. Comments provided by negatively oriented listeners (particularly older ones) point to the relative social distance they perceived between themselves and the speakers, whom most listeners referred to as “the French” or “they.” For example, one listener (age 63) commented, “I love the French, but they’ve got blinders on,” while another listener (age 19) shared, “It’s especially a problem in retail. I mean, I am the customer. I deserve to be waited on in the language of my choice. I know it’s Quebec, but … come on!” This increased social distance may have encouraged at least some listeners to amplify the differences between their own speech and that of the speakers whose speech samples they were rating. By contrast, positively oriented listeners—and (as discussed in the following text) younger listeners exposed to negative bias—likely experienced enhanced solidarity with the speakers, similar to listeners who received increased exposure to L2 speech (e.g., Staples et al., Reference Staples, Kang and Wittner2014) or those who had firsthand experience using an L2 (e.g., Hansen et al., Reference Hansen, Rakić and Steffens2014). One listener (age 60) in particular spoke of his empathy with the L2 speakers being rated: “It is good because these people we’re listening to sound like me when I’m speaking French.” And another, younger listener (age 29) noted: “Yeah, I think there are a lot of people who try hard to speak English if they feel like it will make it easier for someone else. Montreal is nice that way.” Positively oriented listeners may thus have given L2 speakers the benefit of the doubt and rated them significantly more favorably.
The obtained effects of positive and negative social bias are compatible with multiple frameworks in social psychology, including the social identity theory (e.g., Tajfel & Turner, Reference Tajfel, Turner, Worchel and Austin1986), self-categorization theory (e.g., Turner, Hogg, Oakes, Reicher, & Wetherell, Reference Turner, Hogg, Oakes, Reicher and Wetherell1987), communication accommodation theory (e.g., Dragojevic et al., Reference Dragojevic, Gasiorek, Giles, Berger and Roloff2016), and intergroup communication and acculturation model (e.g., Bourhis et al., Reference Bourhis, Sioufi, Sachdev and Giles2012). While the focus of each framework varies—for example, in terms of analyzing communication at the level of individuals, groups, and even societies—these views are consistent in their predictions. When people regard each other in terms of social and group identities, as opposed to considering each other as individuals, they tend to emphasize similarities between groups or enhance (perceived) differences across them. It is likely that a social bias manipulation, either positive or negative, was sufficient to render the rating context as an intergroup situation (cf. Bourhis & Giles, Reference Bourhis, Giles and Giles1977) as opposed to a setting where individual speakers are heard and evaluated, with the consequence that listeners either converged to the speakers (appreciating their effort in speaking L2 English and providing more generous ratings) or diverged from them (acknowledging their status as members of the French-speaking community and providing harsher evaluations). In their comprehensive review of literature on communication behaviors, Dragojevic et al. (Reference Dragojevic, Gasiorek, Giles, Berger and Roloff2016) asserted that “most interactions are actually intergroup in nature” (p. 8, original emphasis) rather than interpersonal encounters, which suggests that social stereotyping might be unavoidable in any interaction, with interlocutors’ expectations and biases guiding their behaviors. While the rating of audio clips in a research setting by no means qualifies as communication, researchers and, by extension, language testers potentially as well, should be aware of possible social biases that might be introduced by interviewers and raters during (noninteractive) L2 speech assessments.
The finding that positive and negative social bias manipulations influenced L2 speech ratings also aligns with results of research on the role of mood induction (i.e., manipulation of people’s affective states through exposure to happy versus sad music or video) in linguistic and nonlinguistic performance. For instance, participants who have been put into a negative mood tend to focus more on details, while those whose mood has been positively altered engage in more global, abstract processing (e.g., Beukeboom & Semin, Reference Beukeboom and Semin2006; Vissers et al., Reference Vissers, Virgillito, Fitzgerald, Speckens, Tendolkar, Van Oostrom and Chwilla2010). Mood induction may influence the extent of attentional resources allocated by participants to semantic and visuospatial tasks, with happy moods linked to a broader, more distributed scope of attention (e.g., Rowe, Hirsh, & Anderson, Reference Rowe, Hirsh and Anderson2007). Mood induction may also affect speaker behavior in interaction, with happy moods associated with a speaking style that is less sensitive to the needs of the listener (e.g., Kempe, Rookes, & Swarbrigg, Reference Kempe, Rookes and Swarbrigg2013). When listeners in the current study rated audio samples, those exposed to the negative bias may have downgraded their ratings because they were excessively focused on form-level detail in the speakers’ output—for example, attending to phonetic substitutions or nonnative intonation patterns which contribute to the perception of L2 speech as more accented or more effortful to understand. However, positively biased listeners may have approached speech rating holistically and were able to overlook local issues, thus rating the dimensions of accentedness, comprehensibility, intonation, and flow higher. Needless to say, the link between affective states and social biases, in reference to L2 speech ratings, should be studied further (e.g., Cargile & Giles, Reference Cargile and Giles1997; Dragojevic & Giles, Reference Dragojevic and Giles2016) to clarify the extent to which the impact of bias manipulation is based on socially constructed stereotypes and to which it is driven by listeners’ mood states at the time of rating.
LISTENERS’ AGE AND SOCIAL BIAS MANIPULATION
The current findings revealed an age-based distinction in listeners’ reactions to a social bias manipulation. In response to a positive bias, both younger and older listeners upgraded speakers in their ratings, with younger listeners providing higher ratings for accentedness, comprehensibility, intonation, and flow, and older listeners rating comprehensibility and intonation higher, relative to age-matched baseline listeners’ assessments. However, in response to a negative bias, younger listeners upgraded speakers in their ratings for all five measures, while older listeners downgraded speakers for accentedness, comprehensibility, and intonation (with nonsignificant trends to also downgrade speakers for segmental errors and flow). In essence, younger listeners seemed particularly prone to both negative and positive bias, reacting to both similarly—by consistently providing higher ratings relative to the assessments of baseline listeners. Most importantly (as shown in Figure 1 for accentedness and comprehensibility and in Appendix 4 for the rest of the data), the age effect under negative bias was not categorical but linear. Indeed, response functions under negative bias showed a linear decrease in ratings for all five measures as listeners’ age increased. Judging from b values (see Tables 4–8), the decrease in ratings under negative bias amounted to about 2 points (for segmental errors and flow), 3 points (for accentedness and intonation), and 5 points (for comprehensibility) on a 1,000-point scale for an increase by one year in listeners’ age. Put differently, a 20-year difference in listener age would amount to about a 40- to 100-point rating difference under a negative bias manipulation, with younger listeners assessing the same speakers higher than older listeners.
While research regarding rater differences based on age is scant, and seemingly nonexistent in L2 speech research, there is some prior work investigating reactions to native speech to indicate that rater age matters. Younger and older raters may align in some aspects of speech rating, as in Caplan and Samter’s (1999) finding that speech act type was perceived similarly by both younger and older raters. However, other aspects of speech rating, like tolerance of offensive language (Mulac, Reference Mulac1976), judgments of story quality (Beaudreau, Storandt, & Strube, Reference Beaudreau, Storandt and Strube2006), and the ability of a speaker to stay focused on the topic (James, Burke, Austin, & Hulme, Reference James, Burke, Austin and Hulme1998), may be perceived differently. For instance, in Mulac’s study, older raters (mean age 43.6) downgraded the aesthetic quality of speakers who used obscenities in their persuasive speeches significantly more than did younger raters (mean age 20.3). In Beaudreau et al.’s research, when raters of two age groups (mean ages 20.3 and 76.3) were presented with positively, negatively, or neutrally worded personal stories told by older and younger speakers, older raters judged older speakers’ stories to be of better quality, whereas younger raters made no such distinction. But younger speakers also have their preferences, as found in James et al.’s work on biographical interviews, where younger raters (mean age 18.3) judged older speakers to be significantly more off-topic than younger speakers, whereas older raters (mean age 72.3) made no such distinction. Findings such as these might reflect cases of raters preferring linguistic output by speakers of their own age group, such that higher ratings are assigned to those whom raters feel are most like themselves.
While it is impossible from the current (rather limited) speaker sample to make a clear case for younger and older listeners preferring, through their rating behavior, speakers of their own age, multiage listeners (particularly when exposed to a negative bias) reacted to the same speakers differently—most likely along generational lines. In fact, visual inspection of the data (see Figure 1 and Appendix 4) indicate that response functions for the baseline and negative bias groups intersected around the values of 40–45 years for listener age, which is consistent with our original prediction of how the 1977 French Language Charter (Bill 101) might have impacted multiage anglophone speakers. Lamarre, Paquette, Kahn, and Ambrosi (Reference Lamarre, Paquette, Kahn and Ambrosi2002), who observed 190 conversations between Montrealers (ages 18–35), provide additional support for this generational difference. Although Montreal’s linguistic neighborhoods are still intact, younger speakers seem to navigate across linguistic boundaries for work and social interaction, much more so than older Montrealers. This is a generation of highly efficient codeswitchers who often engage in bilingual conversations to equalize interlocutor power and reduce potential linguistic tension. A preference toward linguistic accommodation is also characteristic of this generation, which may reflect global changes in language use, as young Montrealers do not insist on settling on one language for communication, instead choosing whichever language—English, French, something else, or a combination of two or more—that results in the most effective communication.
Based on the idea that young Montrealers not only accept linguistic diversity but also prefer the flexibility of varied language use, regardless of interlocutor proficiency (Lamarre et al., Reference Lamarre, Paquette, Kahn and Ambrosi2002), it is likely that the younger listeners in the current sample, when exposed to a negative bias, experienced some degree of solidarity with the L2 speakers and associated themselves with the fellow multilingual speakers, thereby canceling out the effect of the negative manipulation and, in fact, lending an additional rating boost in response. This reaction would be in line with the findings of Pantos and Perkins (Reference Pantos and Perkins2013), who found that American university students (mean age 20) rated Korean-accented English higher than American-accented English, a finding likely based on raters feeling reluctant to be seen as discriminatory, choosing instead to overcorrect. Leaving aside the extent to which implicit versus explicit attitudes contributed to rater behavior (an issue that should be addressed in future research), many younger listeners in this study expressed a protective view over L2 speakers in debrief comments, such as “I think there are probably a lot of people in Montreal, especially the older generation who are … I don’t want to say racist, but who judge people unfairly” (age 25). Many younger listeners also verbally “pushed back” upon hearing the negative manipulation, noticeably more so than older listeners. For instance, one listener (age 30) commented: “It seems like only the older generation has that view. I am so used to speaking both languages and hearing all of the different accents that I don’t care.” Another listener (age 21) shared, “Yeah, but I also think about the other side of it. I know a lot of English speakers who can’t get a job because they don’t speak French well enough.”
IMPLICATIONS FOR RESEARCH
Previous research has held human judgments up as a gold standard for speech assessment (e.g., Eskenazi, Reference Eskenazi2009). The results of the current study cast doubt on the relative stability of human ratings of L2 speech and point to the importance of social context, defined both narrowly (e.g., immediate rating situation) and broadly (e.g., sociopolitical environment). Although the local context in this study was tightly controlled, in that it took place in a laboratory in which listeners heard a biasing anecdote about an interaction involving an L2 speaker, the real-world settings in which assessors find themselves before they pass judgment on L2 speech are less rigidly controlled. Moreover, as prior research has shown, people are likely unaware of the experiences that activate stereotypes and of their subsequent impact (e.g., Molden, Reference Molden2014). The negative stereotypes attributed to L2 speakers can result in overt behaviors with important real-life consequences that extend, for example, to employment (e.g., Hansen & Dovidio, Reference Hansen and Dovidio2016).
The current research demonstrated that many L2 speech ratings (comprehensibility, accentedness, flow, intonation, segmental errors) may be susceptible to social bias manipulation. In future lab-based studies, researchers might overcome the role of socially constructed biases by relying on a large number of raters and by employing raters who come from heterogeneous social groups and perhaps represent different age ranges. In the real world, though, most L2 learners do not have the luxury of having their speech assessed by more than one or two people. Extrapolating from the current findings, it is possible that an unfriendly encounter at a café, an unpleasant hallway conversation, or cheerful banter prior to an interview or a rating session could influence raters’ assessments. Therefore, future rater training should address the role of biases and stereotypes and the extent to which even seemingly minor prior experiences may play a role in judgments of L2 speech and, by extension, L2 speakers. In laboratory studies, this may mean that possible preexisting biases must be identified and brought to the attention of the listeners prior to rating. Becoming aware of and attending to biases is essential for changing behavior (Bodenhausen & Moreno, Reference Bodenhausen, Moreno, Bless and Forgas2000).
Setting social bias aside, one reassuring finding of this study was that baseline listeners’ assessments of L2 speech appeared to be stable across listeners’ age. As shown in Figure 1 illustrating the data for accentedness and comprehensibility (and in Appendix 4, which depicts results for the remaining measures), linear response functions in the baseline group were independent of age, perhaps with the exception of flow ratings, suggesting that—in the absence of a social bias manipulation—listeners representing a broad age spectrum tend to provide comparable L2 speech ratings. The relationship between listeners’ age and their L2 speech assessments may need to be explored further, taking into consideration listeners’ individual characteristics (hearing acuity, attention control) or specific types of assessments (global ratings, accuracy scores).
One ancillary, yet not less interesting, finding of this study pertained to additional contributions of several individual differences in listeners’ experience and in their social attitudes to listener assessments of L2 speech. For instance, listeners with more familiarity with French-accented L2 English, those with more experience of daily French use, and those espousing stronger beliefs about the role of English in Quebec tended to provide harsher ratings. In turn, listeners with stronger opinions about immigrants and other ethnic groups and those with a stronger sense of pride in their ethnicity tended to provide more lenient ratings (see Table 9). It would be imprudent for us to elaborate on these findings extensively because these analyses were used to control for preexisting differences across individual listeners, not to explore these effects in detail. Nevertheless, the obtained associations align well with results of prior work documenting listener experience effects in L2 speech research (e.g., Kang & Rubin, Reference Kang and Rubin2009) and research targeting the roles of social biases and attitudes in evaluations of L2 speech (e.g., Dragojevic & Giles, Reference Dragojevic and Giles2016; Lindemann, Reference Lindemann2002). These findings invite further, more focused investigations of the interplay between listeners’ prior experience, socially manipulated biases, and speech ratings.
The current study took place in Montreal, Quebec, where the relationship between the English and French has been tenuous. The listeners have all been affected by the official language policy that classifies them locally as members of the linguistic minority. Within Canada, however, these same individuals belong to the linguistic majority. Future research that seeks to determine whether it is possible to manipulate biases locally should consider investigating other language pairings that differ in their relative status within a given speech community. The researcher who met with listeners is a doctoral student in Montreal and a native speaker of English from the northeastern United States (a 15-minute drive from the Canadian border). Although she shared a language with all listeners, she was not a member of the local speech community. None of the participants commented on the researcher’s American accent, but a few asked post-rating if she was from western Canada. Having a researcher who speaks a different variety of the language than that of the listeners (including also a researcher who speaks the target language as an L2) or one whose education level aligns more with that of the listeners might have an effect on the findings of future studies. Furthermore, it would be interesting to investigate other relationships that emerge from the dataset, including, for instance, any evidence of a relationship between participants’ preferred ethnic and linguistic labels and their rating behaviors.
During the rating sessions, participants occasionally paused between samples to ask if they should rate word stress, grammar, or vocabulary. While these factors were not the focus of this study, it would also be interesting to explore additional factors such as word stress and sentence stress, as these prosodic features are easily identifiable, even for untrained listeners (Munro, Reference Munro1995). In future work, it would also be possible to make use of a range of listeners, including teachers, younger participants, multilinguals, or fellow L2 learners of the target language, and to target other measures of speaking performance, not necessarily those that are confined to pronunciation.
CONCLUSION
The current study examined the extent to which typical listener-based judgments of L2 speakers’ oral performance are susceptible to effects of a brief social manipulation biasing listeners toward positive versus negative aspects of L2 speakers’ performance. We found strong, consistent effects of positive and negative bias manipulations on all five targeted speech ratings, such that the ratings provided by listeners under a social bias manipulation diverged significantly from the ratings provided by baseline listeners. These results demonstrate that listener ratings may be more manipulable than previously assumed. The current findings add to the growing body of research in applied linguistics (e.g., Winke, Gass, & Myford, Reference Winke, Gass and Myford2013) and social psychology (e.g., Paladino et al., Reference Paladino, Poddesu, Rauzi, Vaes, Cadinu and Forer2009) targeting various sources of bias on measures of L2 learning and use, and invite further investigations into social, attitudinal, and emotional underpinnings of listener assessments of L2 speech. Such research will provide valuable insights into the validity of listener judgments.
SUPPLEMENTARY MATERIAL
To view supplementary material for this article, please visit https://doi.org/10.1017/S0272263118000244