


Introduction
In order to create an avalanche-forecasting system, it is important to understand in detail the meteorological and snowpack conditions that lead to the formation of weak layers. Surface hoar is one of the most frequently occurring types of weak layer and has long been of interest to avalanche researchers (e.g. Reference Perla and MartinelliPerla and Martinelli, 1976). Surface-hoar crystals are caused by sublimation (solid condensation) of water vapor in the atmosphere onto a snow surface, and often form under nocturnal, clear and humid conditions with perceptible wind. These meteorological conditions suitable for surface-hoar growth have been discussed by Reference Lang, Leo and BrownLang and others (1984), Reference BreyfogleBreyfogle (1987), Reference ColbeckColbeck (1988), Reference HollerHoller (1998) and Reference Mingo and McClungMingo and McClung (1998). Recently, Reference Hachikubo and AkitayaHachikubo and Akitaya (1997a) obtained the transfer coefficient of water vapor from field observations and found that the sublimation rate of surface hoar can be estimated from meteorological conditions.
While it has been believed that surface hoar forms during calm nights (Reference SeligmanSeligman, 1936, p. 55), wind plays an important role in surface-hoar growth. Reference ColbeckColbeck (1988) concluded theoretically that some wind is necessary for turbulent transfer of water vapor, and a specific wind speed which maximizes the sublimation rate was proposed. Although similar discussions are found for dewfall (Reference MonteithMonteith, 1957; Reference OkeOke, 1987), it has not been confirmed yet in surface-hoar formation because quantitative observations are scarce.
Assessing the formation of the surface-hoar layers remains an additional challenge for operational avalanche forecasting. A numerical model, Crocus, has been developed to simulate the energy and mass balance at the snow surface and the evolution of snow-cover stratigraphy as a function of meteorological conditions (Reference Brun, Martin, Simon, Gendre and ColéouBrun and others, 1989, Reference Brun, David, Sudul and Brunot1992). Reference Mingo and McClungMingo and McClung (1998) applied Crocus and compared potential surface-hoar periods from a calculation of latent-heat exchanges with the observed surface-hoar periods. Their simulation showed promising results, and further detailed examination has been expected by avalanche researchers.
In this work, the wind effect on the sublimation rate is expressed by a heat-balance model (called the Simple model in this paper) at the snow surface under nocturnal and clear-sky conditions, and these calculated results are compared with the observation data. Besides this, the time evolution of the heat balance is also simulated with Crocus, and the validity of the simulated sublimation rate is discussed.
Observation Site and Methods
Observations were carried out on clear nights in the three seasons of January-March 1994, December 1994-March 1995 and December 1995-March 1996. The site is located on a mountain ridge near the avalanche-research station (240 ma.s.L, 45° N, 142° E) of the Institute of Low Temperature Science, at theTeshio Experimental Forest of Hokkaido University inToikanbetsu, northern Hokkaido,Japan.
Detailed information on the observational methods and instrumentation used is given by Reference Hachikubo and AkitayaHachikubo and Akitaya (1997a). Air temperature, relative humidity, wind speed and net radiation were measured at 1 m height and averaged for 30 min. Snow surface temperature was also measured with six copper-constantan thermocouples (accuracy ±0.1 °C), and the mean value of these readings was adopted. A drop of water was frozen onto the tips of the thermocouples, and they were then set on the snow surface so that the sensor was like a small ice particle on snow and the snow surface temperature would be correctly measured. The vapor sublimation rate was obtained directly from the weight change of a 20 mm thick snow block on an aluminum plate of 0.5 × 0.6 m2.
Description of Numerical Experiments
Simple model
A simple model of heat balance under nocturnal and clear-sky conditions has been developed in order to discuss the wind effect on the sublimation rate of water vapor (Reference Hachikubo and AkitayaHachikubo and Akitaya, 1997b). The heat budget at the surface is expressed as (e.g. Reference StullStull, 1988)

where Rnet is the net radiation, H is the sensible-heat flux, lE is the latent-heat flux (I means the latent heat for sublimation) and G is the conductive-heat flux from the snow. These are expressed as


where ε is the emissivity of snow, L↓ is the incoming atmospheric radiation, a is the Stefan-Boltzmann constant, Ch and Ce are the bulk transfer coefficients of heat and water vapor, cp is the specific heat of air at constant pressure, p is the air density, u is the wind speed, T is the temperature, q is the specific humidity and A is the thermal conductivity of snow. The subscripts z, s, g mean heights of z, the snow surface and a distance of Δd below the surface, respectively. In Equation (2), the value of 0.97 was used for ε (Reference Kondo and YamazawaKondo and Yamazawa, 1986). L↓ was taken to be (Reference Takeuchi, Kondo, Ganpo and AsaiTakeuchi and Kondo, 1981)

where Tb and qh are the mean value of temperature and specific humidity in the boundary layer, respectively; Th = Tz and qh = qz are assumed in this model. Equations (3) and (4) constitute what is called the bulk transfer method (Reference StullStull, 1988), and the bulk transfer coefficient C is expressed as (Reference Thorn and MonteithThorn, 1975)

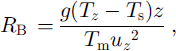
where C (N) is the bulk transfer coefficient in a neutral atmosphere, RB is the bulk Richardson number, g is the gravitational acceleration and Tm is the mean air temperature that is supposed to be Tz. In this model the values of 3.3 × 10⁻³ and 2.4 × 10⁻³ reported by Reference HachikuboHachikubo (1998) are used as Cm of heat and water vapor, respectively, q is a function of T and relative humidity RH at height z, given as (Reference SuttonSutton, 1953)

where e sat is the saturated vapor pressure at T(K) and pair is the atmospheric pressure. e sat (Pa) is empirically given as (Reference DorseyDorsey, 1968)

where a, b, c, d and e are –5631.1206, 8.2312, –3.861449 × 10⁻², 2.77494 × 10⁻⁵ and –10.66619, respectively. qs in Equation (4) is obtained assuming that the vapor is saturated at the snow surface; then qs is a function of Ts from Equations (9) and (10). G was calculated from Equation (5) assuming that A is 0.21 W m-1 K-1 for a density of 200 kg m–3 (Reference Izumi and HuziokaIzumi and Huzioka, 1975). In the field observation, a temperature profile beneath the snow surface in night-time was obtained by Reference Hachikubo and AkitayaHachikubo and Akitaya (1997a) who found a similar change between the air temperature and the snow temperature at 0.05 m depth. A good linear relation (R = 0.82) was found between Tg at 0.05 m below the snow surface and Tz at lm height from all the data from 1994 to 1996; hence Tg (K) is assumed to be a function of Tz,

where the standard deviation of Tg is 1.9 K. We may say that the snow temperature beneath the snow surface gradually changes according to the air temperature during night-time. Although Equation (11) is an empirical formula, it does not greatly affect the following result of wind dependency on sublimation.
In this model, the snow surface temperature Ts was obtained numerically by substituting Equations (2–11) into Equation (1), where Tz, qz and uz at 1 m height are input parameters. Accordingly, IE, i.e. the sublimation rate, can be calculated from Equation (4).
Crocus model
Crocus is a numerical model of snow cover developed for avalanche forecasting (Reference Brun, Martin, Simon, Gendre and ColéouBrun and others, 1989, Reference Brun, David, Sudul and Brunot1992). Given initial conditions (the profile of snow cover) and boundary conditions (meteorological conditions), it can simulate the subsequent time evolution of the snow cover. Crocus requires the specification of nine meteorological parameters as inputs: air temperature, relative humidity, wind speed, precipitation and its phase, incoming longwave radiation, direct and diffuse shortwave radiation and cloudiness. In this paper, 18 runs of surface-hoar formation observed from 1994 to 1996 were simulated by Crocus.
Since surface hoar develops under neutral to stable conditions, it is necessary to consider the dependency of turbulent transfer coefficients, such as Ch and Ce, on air stability. As described in Reference Brun, Martin, Simon, Gendre and ColéouBrun and others (1989) and Reference Martin and LejeuneMartin and Lejeune (1998), transfer coefficients of heat and water vapor used in Crocus depend on air stability, according to Equations (7) and (8).
Since the snow profiles (snow temperature, snow density and snow type) were not measured during the observation period, I estimated the initial conditions of snow temperature at 0.05 m depth from Equation (11), and supposed that the snow depth was 1 m and the snow temperature at the bottom kept at 0°C. The dependency on Tg as an initial condition was checked, and confirmed that the root mean square of the error was ±0.1 × 10⁻⁶ kg m–2 s–1 when Tg was changed within its standard deviation of 1.9 (K). “Partly decomposed precipitation particles” (Reference ColbeckColbeck and others, 1990) were specified as the snow type of the initial conditions, and the snow density was expressed as a parameter (100, 200 and 300 kg m–3). As each period of surface-hoar formation was relatively short (<14h), and the thermal environment around the snow surface was strongly controlled by radiative cooling, these assumptions are appropriate. In the simulation, the snow density is the most important parameter of snow property since it affects the conductive-heat flux from the snow and changes the heat balance.
Results and Discussion
Wind effect on surface-hoar growth
Figure 1 shows the sublimation rate plotted against wind speed. Symbols indicate the observation data sorted by a condition of Rnet < –60 W m–2 (i.e. nocturnal and clear-sky condition), and solid lines indicate the relations between the sublimation rate calculated with the Simple model and uz when Tz is –7°C (i.e. the mean air temperature obtained from the observation data); relative humidity is a parameter. The results of the Simple model plotted as solid lines are in good agreement with the observation data, though the model slightly overestimated the measured sublimation rate at wind speeds of > 3ms–1. When the relative humidity is high (90–100%RH), the sublimation rate seemed to increase with wind speed. On the other hand, when the humidity is 60–70%RH, the sublimation rate changed from positive to negative with increase in wind speed. The calculation results clearly showed that there is a specific wind speed which maximizes the sublimation rate when the air is not saturated with water vapor, whereas the sublimation rate increases with wind speed when the air is nearly saturated.
Relation between measured sublimation rate and wind speed at lm height during clear-night conditions; relative humidity is a parameter. Symbols represent measurements; full lines are results from the Simple modelfor Tz = –7aC.

The wind effect on the sublimation rate depends on the balance between the wind speed and the specific humidity difference in Equation (4); qs means the saturated vapor pressure at Ts, and Ts which is lower than Tz in night-time increases and approaches Tz as uz increases, so the difference between qz and qs decreases as uz increases. It is important that the sublimation rate simply increases with wind speed when the air is saturated, since the increase in uz exceeds the decrease in the specific humidity difference in Equation (4).
Reference SeligmanSeligman (1936) observed surface-hoar formation even under strong winds, while Reference ColbeckColbeck (1988) noted that perceptible winds precluded surface-hoar growth. From the results of the present observation and the Simple model, it is reasonable to conclude that Colbeck’s conclusion is applicable when the air is not saturated, and the case reported by Seligman is possible when the air is nearly saturated. Reference SeligmanSeligman (1936) noted that such a condition would be found when a warm and humid wind, in which no fog droplets have developed, starts to blow. Therefore, in a windy mountainous area, surface hoar can develop rapidly when vapor is abundant.
Snow surface temperature and heat balance
On 1–2 March 1994, it was almost clear all night and the surface-hoar crystals were observed to grow up to about 5 mm high (Reference Hachikubo and AkitayaHachikubo and Akitaya, 1997a). Figure 2 shows the time variation of the air temperature Tz at 1 m height and the snow surface temperature Ts on 1–2 March 1994. Ts of the Simple model agrees fairly well with the observed Ts. After 0400 h local time (LT) the observed Ts increased due to a thin cloud cover which increased incoming longwave radiation, whereas the model underestimates Ts by about 2–3°C. This is mainly because the light cloudy skies did not satisfy the initial condition of “clear-sky”. On the other hand, Ts simulated by Crocus is underestimated by about 2–3°C throughout this period, while variation of Ts is similar to that of the observed Ts. The error bars express the effect of the snow density (100–300 kg m–3) at the initial time; Ts is low when the snow density is low in the same meteorological conditions. This result indicates that the initial snow density affects Ts within ±1°C.
Time variations of au temperature and snow surface temperature, 1–2 March 1994. The error bars around the black circles depend on the initial snow density (100–300 kg m3).

The time variation of the heat-balance components at the snow surface on 1–2 March 1994 is shown in Figure 3. Figure 3a shows the data measured directly or estimated using the observed Ts, all of which were obtained independently (Reference Hachikubo and AkitayaHachikubo and Akitaya, 1997a); the net radiation was measured with an all-wave net radiometer, the latent-heat flux was derived from the sublimation rate, the sensible-heat flux was calculated with Equation (3) and the conductive-heat flux from the snow was calculated with Equation (5). The net radiation nearly balanced with the sum of sensible-, latent- and conductive-heat flux below the snow surface. As shown in Figure 3b (Simple model) and Figure 3c (Crocus), the results of both models generally express the heat-balance components, except for the Simple model after 0400 h LTdue to the failure to consider incoming longwave radiation from clouds.
Time variations of heat-balance components, 1–2 March 1994. (a) Observation, (b) Simple model, (c) Crocus model; the initial snow density is 200 kg m3.

The Simple model and the Crocus model estimated 0.218 kg m–2 and 0.209 ± 0.013 kg m–2, respectively, as the total sublimation on 1–2 March 1994 (12 h), while the observed sublimation was 0.166 kg m–2. These overestimates of the sublimation are directly due to the underestimates of Ts in Figure 2.
Estimation of the sublimation rate
In Figures 4 and 5, the sublimation rates of 18 runs of surface-hoar formation observed from 1994 to 1996 are sorted by a condition of Rnet < –60 W m–2 for the Simple model, and all the data are used for Crocus.
Comparison between the calculated and observed sublimation rates obtained in the three seasons January-March 1994, December 1994-March 1995 and December 1995-March 1996; the initial snow density is a parameter, (a) Simple model; only observed data with Rnet < –60 W m–2 were selected, (b) Crocus model.

Comparison between the calculated and observed snow-surface temperatures obtained in the three seasons January-March 1994, December 1994-March 1995 and December 1995-March 1996; the initial snow density is a parameter. (a) Simple model; the observed data are sorted by a condition of Rnet < –60 Wm2. (b) Crocus model.

Figure 4 shows the comparison between the calculated and the observed sublimation rates. Good linear relationships exist for each model, but the Simple model and Crocus overestimate the calculated rate by about 0.6 × 10⁻⁶ and 1.3 × 10–kg m–2 s–1, respectively. Since the effect of snow density causes differences of ±0.2 × 10⁻⁶ kg m–2 s–1 in these graphs, the parameter of snow density seems not to affect the biases.
Figure 5 shows the comparison between the calculated and the observed snow-surface temperatures Ts. The Ts simulated by the Simple model is in very good agreement with the observations. By contrast, as we have seen in Figure 2, Crocus generally underestimates Ts by about 2–3°C when Ts is –5° to –15°C; in addition, the difference between them increases with decrease in Ts and reaches > 5°C when Ts is –20°C. In both graphs the effect of snow density on Ts increases with decrease in Ts.
Empirical transfer coefficients of heat and water vapor are often used in micrometeorology but they depend on the surface roughness, the measuring height of meteorological quantities and the air stability. In the above results of Crocus, I adopted the default values: both 3.7 × 10⁻³, for Ch and Ce. These values of Ch and Ce are much larger than those obtained by Reference HachikuboHachikubo (1998), which have been adopted in the Simple model.
The relation between the sublimation rates calculated by Crocus and the observed ones is shown in Figure 6; Ce is a parameter. Reference Martin and LejeuneMartin and Lejeune (1998) stated that the turbulent fluxes such as H and IE are little affected by the aerodynamic surface roughness which decides Ch and Ce. In Figure 6, the relation is little changed and confirms that the slope of the regression line decreases as Ce decreases. By contrast, Ts is greatly underestimated when Ce is 2.4 × 10⁻³ in Figure 7, which indicates that the heat balance at the snow surface is not well reproduced. While Reference Martin and LejeuneMartin and Lejeune (1998) concluded that the parameterization of turbulence is highly dependent on the site, and no universal or simple formula can be determined, the bulk transfer coefficient is not the cause of the bias, as we have seen in Figures 4b and 6. This is an unresolved problem and needs further consideration.
Sublimation rate calculated by Crocus plotted against the observed sublimation rate. Continuous and dotted lines are the regression lines when Ce is 3.7 × 10⁻³ and 2.4 × 10⁻³, respectively. The initial snow density is 200 kg m–3.

Snow-surface temperature calculated by Crocus plotted against the observed snow-surface temperature when Ce is 3.7 × 10⁻³ and 2.4 × 10⁻³. The initial snow density is 200 kg m–3.

Conclusions
The wind effect on sublimation rate was observed and discussed with a heat-balance model (the Simple model) for sublimation under nocturnal and clear-sky conditions with respect to surface-hoar formation. In the wind-speed range 0–6 m if1, a specific wind speed which maximized the sublimation rate was found when the relative humidity was <80%, whereas the sublimation rate seemed to increase with wind speed when the relative humidity was >90%, at least in the range 0.5–3.5 m s–1. These results agreed with those of Reference ColbeckColbeck (1988) and Reference SeligmanSeligman (1936), respectively.
An event of surface-hoar formation in the field was simulated with both the Simple model and Crocus. The heat balance at the snow surface was not well reproduced by Crocus which underestimated the snow-surface temperature by about 2–3°C. The Simple model reproduced well both the time variations of the snow-surface temperature and the heat-balance components, though there was some disagreement because cloudiness was not considered. In addition, Crocus overestimated the sublimation rate by about 1.3 × 10⁻⁶ kg m–2 s–1 when surface hoar formed. However, the results of Crocus show promise for the quantitative prediction of surface-hoar formation, even if the parameters for turbulent transfer were the default values of Crocus.
Acknowledgements
I would like to express my gratitude to E. Akitaya, D. Kobayashi and N. Ishikawa of the Institute of Low Temperature Science, Hokkaido University, for their helpful suggestions and valuable advice throughout the study. I am also grateful to the staff of the Teshio Experimental Forest of Hokkaido University for their cooperation. The Crocus model was used under license from Meteo-France. This research was partly supported by the Fund for Avalanche Research of the Ministry of Culture, Sports, Science and Technology, Japan.



