INTRODUCTION
Over the past 30 years, the number of African Americans and Latinos serving in state legislatures and Congress has grown relatively steadily. This increase is attributable primarily to the rise in the number of districts with substantial minority population concentrations and the increasing propensity of these districts to elect minority representatives—very few minority legislators were elected from overwhelmingly non-Hispanic White districts between 1992 and 2015. However, our data show that there has been a shift in the minority concentration required: prior to the 2010 round of redistricting, minority candidates had a better than equal chance of being elected only in majority-minority districts (e.g., Casellas Reference Casellas2011; Davidson and Grofman Reference Davidson and Grofman1994; Lublin Reference Lublin1997a; Lublin et al. Reference Lublin, Brunell, Grofman and Handley2009; Tate Reference Tate2003; Whitby and Gilliam Reference Whitby, Gilliam, Weisberg and Patterson1998). More recently, districts falling in the 40–50% Black or Hispanic range have offered minority candidates a better than equal opportunity to be elected to legislative office.
We believe this increase in minority electoral success in districts that have a substantial but not a majority minority population concentration can be explained primarily by the rise of the Republican Party, particularly in the South, and the marked increase in political polarization nationwide. We propose a probability model of minority electoral success that conceptualizes it as a function of the percentage of minorities and the percentage of Republicans in the district. Heightened racial polarization in party primary participation, with White voters increasingly likely to vote in the Republican primary, results in the likelihood of minority candidates securing the Democratic nomination increasing along with the share of Republicans. Consequently, the likelihood of a minority candidate (Democrat) winning the general election also increases, until the percentage Republican reaches the point at which the Republican candidate (non-minority) is likely to win. The point at which the minority candidate has the greatest likelihood of success—the “sweet spot” on the curve—varies depending on the percentage Black and the percentage Republican in the district, with lower minority percentages required as the Republican percentage increases, so long as the Republican percentage is not high enough to win the general election.
In the section “Explaining the Increase in the Number of Minority Legislators,” we document the increase in African-American and Latino state and congressional legislators over time and consider a variety of possible explanations for this rise in minority electoral success. We argue that the best explanation for the increase in the number of minority legislators is the rise in Republican voting strength, particularly in the South, and heightened partisan polarization. In the section “Modeling the Relationship between Minority Population and Republican Voting Percentages: Finding the “Sweet Spot” for Maximum Minority Electoral Success,” we present a probability model depicting the relationship between the percentage Republican in the district and the likelihood of minority electoral success for a series of fixed minority population concentrations. This curvilinear model generates a “sweet spot” identifying the point at which the minority candidate has the maximum likelihood of success. “The Impact of Minority Population Concentrations on Electing Minority Legislators” section provides an updated examination of the relationship between minority population concentrations and provides evidence in support of our model. We find that, while the vast majority of African-American and Latino state and federal legislators are still elected from districts in which Blacks and Hispanics comprise a majority of the population, minority electoral success has increased in districts that have a substantial minority population but are less than majority-minority in composition. The “Multivariate Analysis of Minority Electoral Success” section presents additional evidence of the very strong relationship between minority population concentrations on electing minority candidates using a multivariate analysis. In the final section, we discuss our findings and what we believe are the possible ramifications of this increase in minority electoral success rates in districts with substantial but less than majority minority populations.
EXPLAINING THE INCREASE IN THE NUMBER OF MINORITY LEGISLATORS
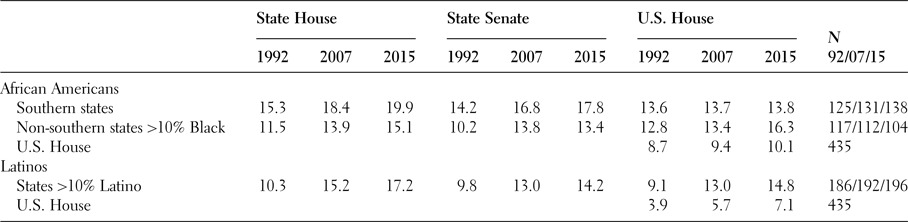
As Table 1 indicates, there has been a relatively steady increase over time in the percentage of legislators elected who are African-American and Latino in states with substantial minority populations.Footnote 1 The increase in the percentage of African Americans elected over the 23 years between 1992 and 2015 is found in both the South and the non-South, and is evident at all three legislative levels—state house, state senate, and congressional.Footnote 2 The growth in the share of Latino legislators in states with Hispanic populations of at least 10% is more pronounced, and is in part a reflection of Hispanic population growth in these states.
Percent African-American and Latino elected legislators in 1992, 2007, and 2015

Source: Data compiled by the authors. The race and ethnicity of legislators were identified using the National Association of Latino Elected and Appointed Officials (NALEO) directory, the National Black Caucus of State Legislators directory and data provided by the Joint Center for Political and Economic Studies, as well as personal knowledge and inquiries.
Note: The eleven states included in the tabulations for the South are: AL, AR, FL, GA, LA, MS, NC, SC, TN, TX, and VA. The eight non-South states with Black populations greater than 10% included in the tabulations are: DE, IL, MD, MI, MO, NJ, NY, and OH. The ten states with Hispanic populations greater that 10% included in the analysis are: AZ, CA, CO, FL, IL, NV, NJ, NM, NY, and TX.
Several explanations have been offered for the increased success of minority candidates. First, over the past 30 years, some scholars have contended that, whatever the need for race conscious districting in 1965 when the Voting Right Act was first enacted, or in still earlier periods of American history, that need is now past (Cameron, Epstein, and O'Halloran Reference Cameron, Epstein and O'Halloran1996; Swain Reference Swain1995; Thernstrom Reference Thernstrom1987; but see Canon Reference Canon1999). Their view is that voting patterns are no longer as highly racially polarized as they once were and therefore minority candidates can be elected to office with non-Hispanic White support, even in districts where minorities are not a voting majority. The election of America's first African-American President in 2008 has been offered as evidence to support this argument.
We, however, are suspicious of the claim that racially polarized voting has substantially diminished. First, there is no evidence to support this claim—even the 2008 presidential election was, in fact, quite polarized (Ansolabehere, Persily, and Stewart Reference Ansolabehere, Persily and Stewart2010). Moreover, as our data below will show the vast majority of minority office holders are still elected from districts with substantial minority populations. If White voters were increasingly willing to vote for minority candidates, there would be an increase in the number of overwhelmingly White districts electing minorities and we do not see this in the data. Second, the marked increase in partisan polarization, especially in the South, with Whites supporting the Republican Party and minorities strongly supporting congressional and legislative candidates who are Democrats, is very likely to have produced an increase in racial polarization in general elections (Abrajano and Hajnal Reference Abrajano and Hajnal2015; Hajnal Reference Hajnal2007; McKee Reference McKee2010; McKee and Springer Reference McKee and Springer2015; McKee and Teigen Reference McKee and Teigen2009).
A second explanation focuses on the nature of candidate recruitment by parties and activist networks and highlights the importance of the growth in the pool of minorities who are business people, teachers, lawyers, or other highly educated professionals (Branton Reference Branton2009; Juenke and Shah Reference Juenke and Shah2015; Maestas, Maisel, and Stone Reference Maestas, Maisel and Stone2005; Maestas et al. Reference Maestas, Fulton, Maisel and Stone2006; Shah Reference Shah2014). This work also highlights the importance of the growth in the pool of minority candidates who have achieved political positions at lower levels such as school boards and city councils and are thus both better positioned and more highly motivated to seek higher office (Shah Reference Shah2015). While we recognize the importance of candidate recruitment and the size of the minority recruitment pool, we would emphasize the link between supply side and demand side factors. Only if minority candidates see themselves as having a realistic chance to win would we expect well-qualified candidates to run and, at least until very recently, the perception was that only majority-minority districts provided this opportunity, at least in the South.Footnote 3 As our data below demonstrates, this perception is not misplaced: the overwhelming majority of minority candidates win election from districts that are majority-minority in composition.
We believe the single best explanation for the increase in minority legislators continues to be the minority concentration in the districts, but that this must be considered in conjunction with the percentage of voters who support Republican candidates in these districts. Our data indicate that while minority candidates are still largely reliant on majority-minority districts for election to legislative office, a growing number of minority candidates are winning in districts with substantial, albeit not majority, minority populations (specifically, in districts that are between 40 and 50% minority in composition). We believe the reason for this increase in minority electoral success in districts with substantial but less than majority-minority population is, perhaps counterintuitively, the rise of the Republican Party, particularly in the South, and the increase in political polarization nationwide. As a growing number of Whites shift their primary votes to Republican primaries, the percentage of minority voters in Democratic primaries increases, making it easier for minority candidates to win the Democratic nomination. The increase in political polarization suggests that, while White voters in general are less likely to vote for minority candidates since these candidates are overwhelmingly associated with the Democratic Party and many White voters are Republican, White Democrats are more likely to vote for an African-American or Latino Democrat than a White Republican (McConnaughy et al. Reference McConnaughy, White, Leal and Casellas2010).Footnote 4 As long as White Republicans do not constitute a majority of the voters in the general election, and enough White Democrats are willing to cast a vote for an African-American or Latino Democrat over a White Republican, these minority candidates can win the less than majority-minority seat. Below we propose a model conceptualizing the relationship between percentage minority in the district and the percentage of voters in the district who vote Republican and identifying the point on the curve that maximizes the likelihood of minority electoral success given a fixed percentage minority and shifting Republican percentages.
MODELING THE RELATIONSHIP BETWEEN MINORITY POPULATION AND REPUBLICAN VOTING PERCENTAGES: FINDING THE “SWEET SPOT” FOR MAXIMUM MINORITY ELECTORAL SUCCESS
This model is a formalization and extension of the ideas proposed in Grofman, Handley, and Lublin (Reference Grofman, Handley and Lublin2001), who show that, if we assume some White crossover voting in the general election for the minority candidates nominated by the party with which the White voter identifies, what can be critical for minority electoral success is the ability to win a given party's nomination in the primary.Footnote 5 Grofman (Reference Grofman2006) refers to these districts as minority “opportunity” districts because, even though minorities do not comprise a majority of the voters, they have a realistic opportunity to elect candidates of their choice to office.Footnote 6 Minority voters affiliate disproportionately with the Democratic Party, and the vast majority of minority officeholders are Democrats.Footnote 7 A group of minority voters whose population is large enough to provide them with a realistic chance to elect their candidate of choice in a Democratic primary may be successful in the general election even if the group does not comprise a (citizen voting age) population majority. As the proportion of Whites who are Republicans rises, the size of the minority population needed to control the Democratic primary falls. On the other hand, if the proportion of White Republicans is too high, then the winner of the Democratic primary is unlikely to win the general election.
In the partisan election context, where we have a two stage electoral process involving first a primary and then a general election, the Law of Conditional Probability tells us that the probability of a minority-preferred (minority) candidate being elected is the product of the probability that the minority-preferred (minority) candidate wins the general election if that candidate is the nominee of a given political party, multiplied by the probability that a minority-preferred (minority) wins the primary of that party, summed over all parties.Footnote 8 We make the model more tractable by assuming that the only primary we have to be concerned about in the case of minority voters is the Democratic primary, and we posit a simple two parameter model in which there is a given proportion of Black Democrats (BD), and a variable proportion of Republicans (R), all of whom are White (WR), with White Democrats (WD) as the residual category, and the sum of BD and R ranging between 0 and 1. While we could allow for some fraction of African-American voters to be Republican, given the empirical realities, the 100% approximation is not unreasonable, and it dramatically simplifies the analytics without changing the qualitative features of the model.
Now, if we assume voting in the party primary is essentially polarized along racial lines, we can model the success likelihoods in the Democratic primary in terms of some function of the ratio BD/(BD + WD). Similarly, we can model the success likelihoods in the general election as some function of the ratio (BD + WD)/(BD + WD + R), if we assume that victory for the Democratic candidate in the general election is simply a function of the share of Democrats in the electorate. The result is a curvilinear probability function.
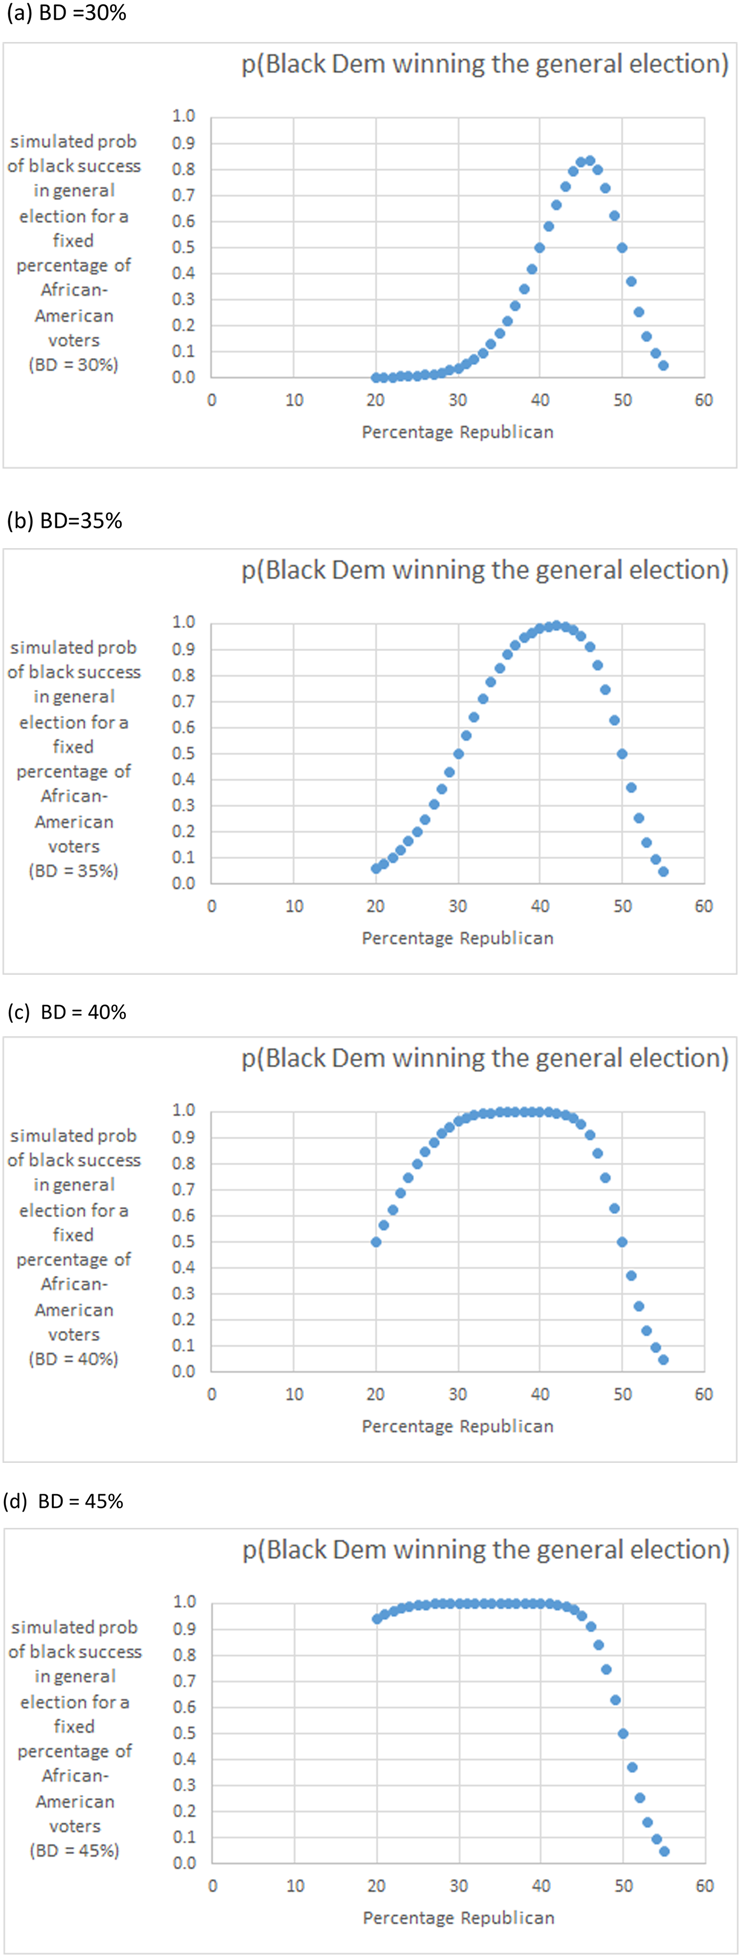
In the simulation we have carried out, using MS Excel, reported in Figure 1, we consider four values of BD: .30, .35, .40, and .45, and model the success function for a Black Democrat in the primary and in the general election using a normal distribution with a fixed standard deviation set arbitrarily at .03 to assure a level of probabilistic variation in outcomes. This is done to reflect the real world of uncertainty as to the results of districts that are reasonably competitive in partisan terms and primaries that are reasonably competitive in racial terms. While the standard deviation of .03 is quite arbitrary, simulations carried out with other values yield qualitatively identical patterns of curvilinearity. But the higher the standard deviation, the more likely it is that even majority Republican districts may occasionally elect a Democrat.
Simulation of Black Democrat's probability of winning the general elections as a function of the percentage Republicans in the District, for a fixed percentage of Black Democratic voters: (a) BD = 30%; (b) BD = 35%; (c) BD = 40%; and (d) BD = 45%.

We see from the curvilinear graphs in Figure 1(a)–(d) that as the Black percentage in the district increases:
(1) the optimum proportion Republican to maximize the likelihood of minority electoral success in the general election falls,
(2) the likelihood of African-American success at that maximum rises to 100%, and
(3) the range of Republican share of the electorate over which the likelihood of success of an African-American candidate is above 50% (above 90%) grows considerably.
We could also posit a slightly more complex model in which WD and BD support levels in the general election were allowed to differ from one another and also to vary with the race of the nominated candidate so that we would not assume that both White Democrats and Black Democrats gave 100% support to the Black Democratic candidate in the general election. We might also allow for turnout differences across the races and parties. But we will not present the results of such simulations here because the main idea of how conditional probabilities yield a curvilinearity generating an electoral “sweet spot” is similar for the simple and more complex simulation models. The main difference is that the Black proportion needed to generate a greater than 50% chance of minority candidate victory in the general election will be higher.Footnote 9 (See the final section below for more discussion on the variables not included in the model presented here.)
THE IMPACT OF MINORITY POPULATION CONCENTRATIONS ON ELECTING MINORITY LEGISLATORS
The relationship between the minority concentration of legislative districts and the election of minority legislators has been examined following each decennial census since at least as far back as 1980.Footnote 10 The consensus of this literature has been that, except for when there are other minorities in the district, it is very difficult for African-Americans to be elected from state legislative or congressional districts that are less than majority African-American in voting age population. It is even more difficult for Latino candidates to be elected from districts that are less than majority Hispanic in voting age.
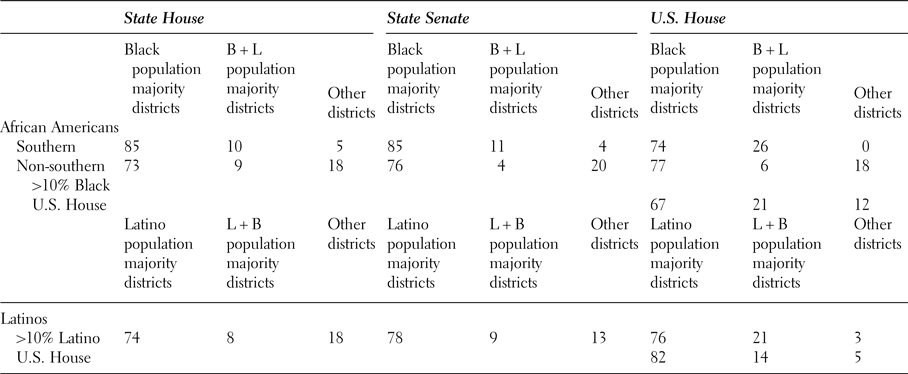
This was still true following the 2010 round of redistricting: the overwhelming majority of African-American and Latino legislators were elected from majority-minority districts. As shown in Table 2, in 2015, 95% of all southern African-American state house representatives were elected from majority-minority districts and 96% of the state senators were from majority minority districts. In the U.S. House, every single African American elected from the South represented a district in which non-Hispanic Whites were in the minority. The percentages for states in the non-South with at least 10% Black population are only a little less stark: 82% of African-American state house representatives, 80% of African-American state senators, and 83% of African-American congressional representatives are elected from majority-minority districts. The percentages for Latino representatives are very similar: 82% of Latino state house representatives, 87% of Latino state senators, and 97% of Latino congressional representatives are elected from majority-minority districts.Footnote 11
The percent of Black Democratic and Latino State House, State Senate, and U.S. representatives in 2015 by district racial composition

Source: See Table 1.
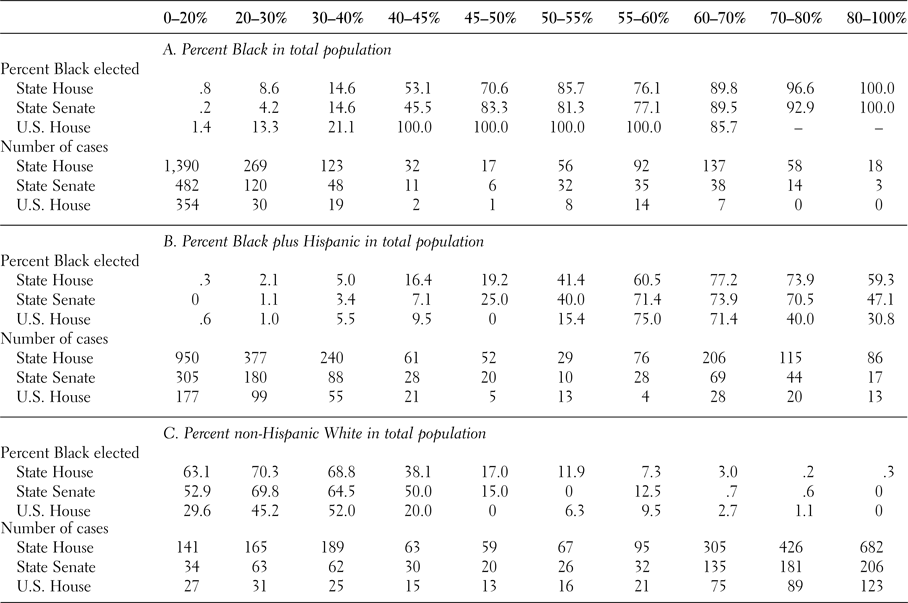
Table 3 examines the relationship between the minority composition of districts and the election of African Americans to legislative office. Table 3A divides legislative districts into categories based on the percent Black in the district and lists the percentage of African Americans representing the districts in each category in 2015. A very distinct pattern emerges, with the percentage of African Americans elected increasing as the Black population share rises. For example, less than 1% of state legislative districts with between 0 and 20% Black elect African Americans to state legislative office, but over 80% of the districts with Black populations falling in the range of 50–55% elect African Americans.
Percent Black elected by district racial composition

Note: This table includes only states greater than 10% Black for state houses and senates but all of the U.S. for the U.S. House. The Black population share was calculated out of the total population and includes all people who checked Black on the U.S. Census alone or in combination with another race. For congressional districts, the Black plus Latino population share was calculated out of the total population and includes all people who responded positively to the question on Hispanic origin or checked Black on the separate racial question regardless of whether or not they also checked another race or said that they are Hispanic as well. However, for state legislative districts, the Black plus Latino population share does not include non-Hispanic Blacks who also checked another race, as those data were unavailable. The non-Hispanic White population share was calculated out of total population and includes all people who responded negatively to the question on Hispanic origin and checked only White in response to the separate racial question. For other source information see Table 1.
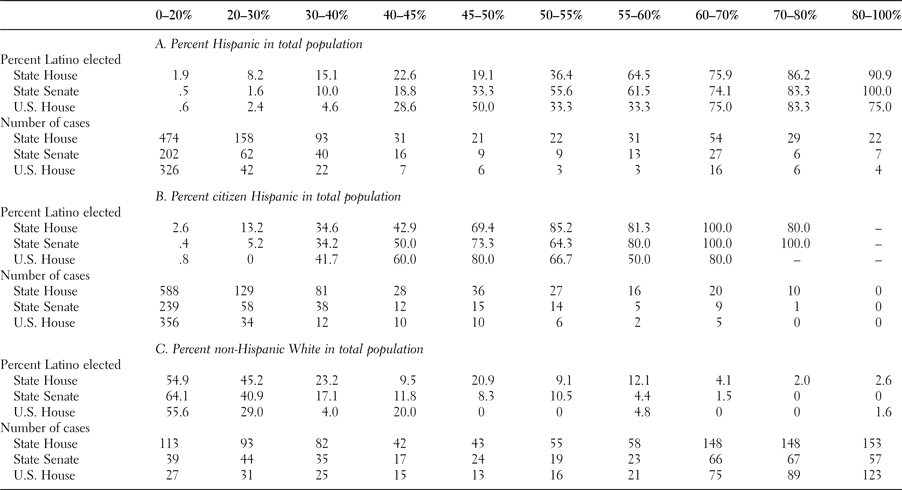
Table 4 demonstrates that the relationship between the Hispanic composition of districts and the election of Latinos to office is comparable with what we find in Table 3 for Africans Americans. However, as Table 4A indicates, Latinos only have the same probability of winning in districts with higher percentages of Hispanics compared with the equivalent Black population share for African Americans. This can be explained by the lower percentage of the Hispanic population that is eligible to vote.
Percent Latino elected by district racial composition

Note: This table includes only states greater than 10% Latino for state houses and senates but all of the U.S. for the U.S. House. The Latino population share was calculated out of the total population and includes all people who responded positively to the question on Hispanic origin on the U.S. Census. The non-Hispanic White population share was calculated out of total population and includes all people who responded negatively to the question on Hispanic origin and checked only White in response to the separate racial question. For other source information see Table 1.
What is important to note about Table 3A (besides the low percentages in categories below 40%, and high percentages in categories about 50%) is that even districts between 40 and 50% Black are more likely than not to elect African Americans to legislative office—and actually far more likely than not in districts in the 45–50% range. This is a recent change: the percentage of districts in the 40–50% range electing African-American candidates was lower a decade ago.Footnote 12 There has been an increase in the share of Latino representatives elected from 40–50% Latino citizen population districts as well.Footnote 13 Unlike past decades, it is the increase in the percentage of minorities elected from districts with substantial but not majority minority populations, in conjunction with the increase in the number of such districts,Footnote 14 which accounts for much of the recent growth in minority representation.
While increases in African-American and Latino representation over past decades have largely come about through an increase in the number of majority-minority districts and the proportion of these districts that elect minorities,Footnote 15 following the 2010 redistricting round, the number of majority Black districts did not increase substantially, and these districts were only slightly more likely to elect African Americans.Footnote 16 The number of Latino citizen population majority districts actually decreased, and these districts were no more likely to elect Latinos to office than the previous decade.Footnote 17 On the other hand, districts with less than 40% were no more likely to elect minorities to office in 2015 than they were previously.
The finding that minority candidates have enjoyed increased success in districts that are between 40 and 50% minority, and not in districts with less than 40% minority, provides evidence for our contention that the rise of the Republican Party and the increase in political polarization have, rather counterintuitively, led to increased minority electoral success at the state legislative and congressional levels.
MULTIVARIATE ANALYSIS OF MINORITY ELECTORAL SUCCESS
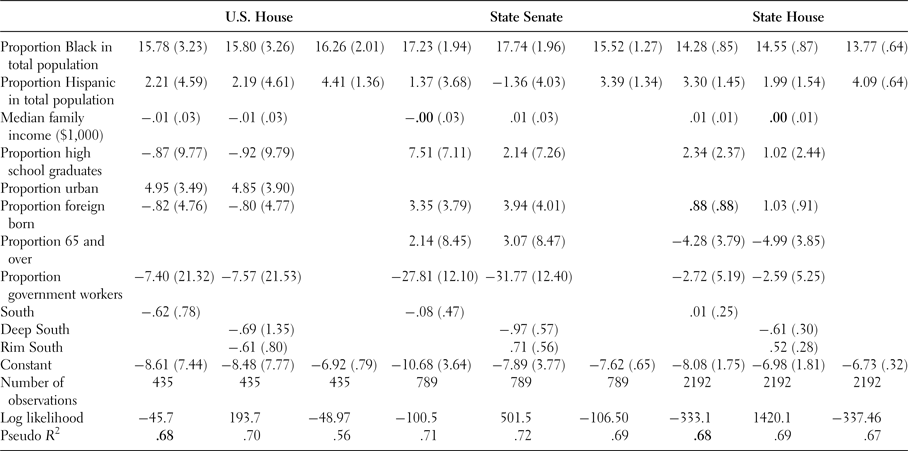
To confirm our contention that voting remains racially polarized and the electoral success of African-American candidates continues to depend on districts with substantial minority population concentrations, we created multivariate models shown in Table 5 with seven nonracial controls included in addition to proportion Black and proportion Hispanic: median family income, proportion high school graduates, proportion urban, proportion foreign born, proportion 65 and over, proportion government workers, location in the South. None of the nonracial controls have a consistent statistically significant impact (p < .05) on the election of either African-American or Latino representatives in state house, state senate, or congressional elections. In contrast, the Black population share has a strongly dominant influence on the election of African-American representatives with the proportion of Hispanics playing a secondary role.
Logit analysis of Black representatives

Note: State legislative results include all states greater than 10% Black. The results are virtually the same if one excludes districts that elected Latinos. Different variables included for state legislative and congressional elections due to data availability.
Replacing the single control for all southern states with two separate controls for the five Deep South states of AL, GA, LA, MS, and SC and the six Rim South states of AR, FL, NC, TN, TX, and VA confirms Hicks's et al. (Reference Hicks, Klarner, McKee and Smith2018) finding that it is more difficult for African Americans to win state legislative elections in the Deep South. In contrast, there is no statistically meaningful difference in their electoral success between the Rim South and non-South. These intra-South differences reflect especially high rates of White Republican support among Deep South Whites (Lublin Reference Lublin2004; McKee and Springer Reference McKee and Springer2015). Models of U.S. House elections, however, do not support extension of this conclusion, as African Americans do not perform appreciably worse in either the Deep South or the Rim South in congressional contests.
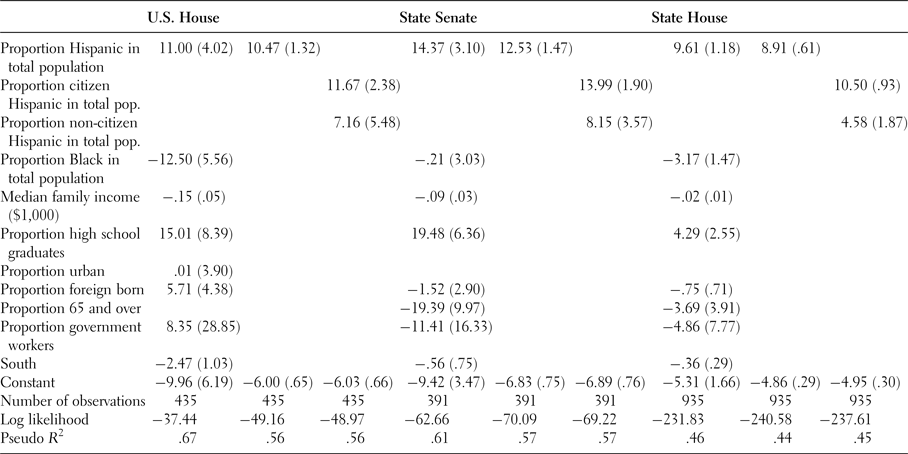
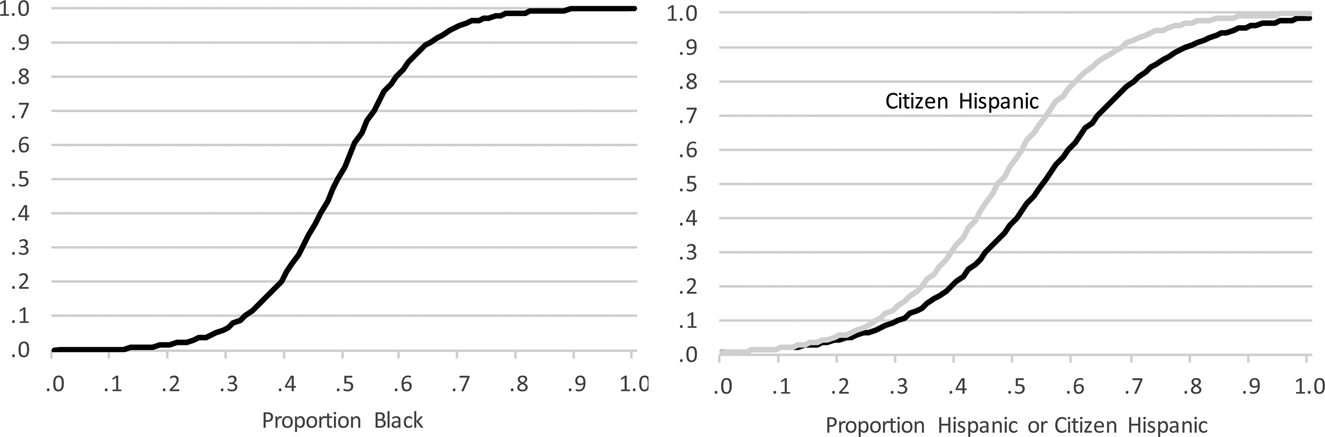
The Hispanic population share overwhelms all other factors in explaining the election of Latino representatives, as shown in Table 6. Models that distinguish citizen and non-citizen Hispanics unsurprisingly show that the share of citizen Hispanics has much greater impact than the share of non-citizen Hispanics, as the latter cannot vote. The same analyses nonetheless indicate that increases in the share of non-citizen Hispanics aids the election of Latinos because citizen Hispanics comprise a larger share of the electorate when the population includes a large number of non-citizens. Figure 2 reveals the predicted relationship between the percentage of African Americans and Latinos and the election of African-American and Latino state representatives, respectively, based on the final simplified models in Tables 5 and 6.
Logit analysis of Latino representatives

Note: State legislative results include all states greater than 10% Hispanic. The results are virtually the same if one excludes districts that elected African Americans. Different variables included for state legislative and congressional elections due to data availability.
(a) Probability of Black state representatives. (b) Probability of Latino state representatives.

CONCLUSION
As in previous decades, minority legislators are still overwhelmingly elected from districts that are majority-minority in composition. In the past, the increase in the number of minority officeholders could be explained by an increase in the number of majority-minority districts and the propensity of these districts to elect minority representatives. While the increase after the 2010 round of redistricting can also be explained in part by the increase in the number of majority-minority districts, a new development is the substantial rise in the success rates of minority candidates in districts that fall in the 40–50% minority range.Footnote 18 This success is concomitant with (1) White voters in the South deserting the Democratic Party in large enough numbers to make it easier for minorities to win Democratic primaries and (2) an increase in political polarization nationally, making it more likely that at least some White Democrats will vote for an African-American or Latino Democrat over a White Republican, allowing the minority candidate to win the general election.
During the 2010 redistricting round, several states increased the number of districts that fell in the 40–50% minority range. However, at least three states drew majority-minority districts without determining whether their pre-established minority percentage target (50% or, in the case of VA, 55%, Black voting age population) was required to elect minority-preferred candidates.Footnote 19 As a result of litigation challenging these districts as drawn with a preponderant racial intent in violation of the Fourteenth Amendment, these states—AL, NC, and VA—had to redraw some of their districts.Footnote 20
It is possible that the number of districts with substantial, but less than majority, minority populations will increase in the next round of redistricting—perhaps in an attempt to avoid the type of litigation faced by AL, NC, and VA.Footnote 21 But caution must be exercised: determining whether a minority candidate can win election in a given district requires a district-specific analysis. The conceptual model offered here relies solely on the minority and Republican percentages in the district to identify the “sweet spot” and some assumptions are made that may be unrealistic in a given district (e.g., 100% of the minority voters and 100% of the White Democrats support the minority Democrat in the general election). A district-specific analysis that includes an analysis of voting patterns would provide an indication of how to adjust the model to account for less than perfect minority voting cohesion, less than 100% White Democratic crossover voting for the minority candidate and less than equal minority and White voting age participation rates.Footnote 22